Create a new Microsoft Sentinel Workbook
In addition to using built-in templates to create a customized workbook, you can create custom workbooks from scratch to produce highly interactive reports that contains texts, analytic queries, metrics, and parameters.
Create a custom workbook
You can create a custom workbook from the Workbooks page in Microsoft Sentinel. Select +Add workbook on the header bar. The New workbook page opens, which contains a basic analytics query to get you started.
Tip
The Azure portal saves each workbook that you create as a workbook resource in the Microsoft Sentinel resource group.
You can start building your workbook on the New Workbook page by selecting Edit. Then select the Edit option to change the text that appears in the new workbook template.
Each workbook provides a rich set of capabilities for visualizing the security data collected from the connectors. You can design your workbook with the following visualization types and elements:
- Text
- Query
- Parameters
- Links/tabs
- Metric
You can add a new element to your workbook by selecting +Add as the following screenshot depicts.

Text visualizations
You can use text blocks to interpret your security data, section headings, telemetry data, and other information. You can edit the text using the Markdown markup language, which provides different formatting options for headings, font styles, hyperlinks, and tables.
Note
Markdown is a markup language that you can use to format text in plain text documents. For more information on how to format text by using Markdown controls, see the markdown guides available online.
After you add the text, select the Preview tab to preview how your content appears. When you complete editing the text, select the Done Editing option.
Query item
You can create a different query from the logs and visualize the data as text, charts, or grids. You can write the query using KQL. Then format the data using various visualizations including:
- Grids (or tables)
- Area charts
- Bar charts
- Line charts
- Pie charts
- Scatter charts
- Time charts
- Tiles
When you create a query, Microsoft Sentinel adds a new Run Query step to the workbook as the following screenshot depicts:

On the header bar, there are several fields that provide you with options to tune the output of the query.
| Name | Description |
|---|---|
| Run Query | Use this option to test the result of the query. |
| Samples | Microsoft provides sample code that contains sample queries that you can add to the workbook. |
| Data Source | Use this option to specify the data source for the query. |
| Resource type | Use this option select the type of resource. |
| Log Analytics workspace | Use this option if you want to query data against more than one resource. |
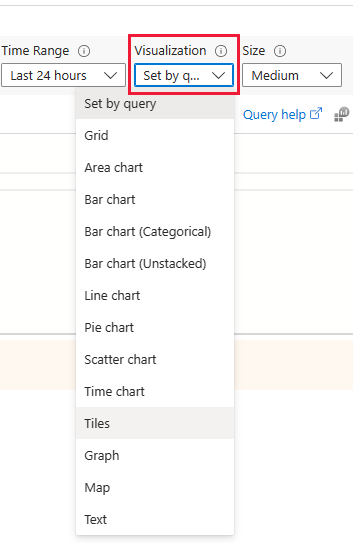
| Time Range | Use this option to specify a time range parameter to use in the query. |
| Visualization | Use this option to choose a specific visualization or choose Set by query to present the data in a different format. |
| Size | Use this option to choose the size of the visualization element. |
On the Advanced Settings tab, you can provide more customization for the settings and the styles of your query step. On the Advanced Settings tab, you can modify properties. For example, you can enter the Chart title, as the following screenshot depicts.
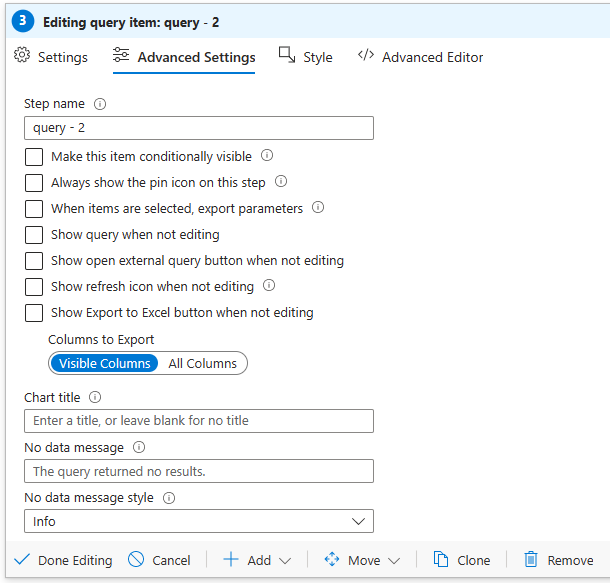
You can use the Style tab to adjust the margin and padding element in the step. After you're done customizing the settings and styles, remember to save the step by selecting Done Editing.
Chart visualizations
When you create a query to present the security data as charts, you can customize:
- Height
- Width
- Color palette
- Legend
- Titles
- Axis types and series
The following example counts all the security alerts and visualizes them in a pie chart.
SecurityAlert
| where TimeGenerated \>= ago(180d)
| summarize Count=count() by AlertSeverity
| render piechart
In the previous example, the query indicates the visualization type for the data. You can also use the query without including the render parameter. Use the Visualization dropdown menu to select one of the offered types of visualizations:
Grid visualizations
You can use the Grid visualization option from the Visualization dropdown menu to present data in tables, which provides an enriched UI for the reports. You can select the Column Settings option to specify which column is displayed in the table and to provide column labels, if necessary.
On the Edit Column settings tab, you can select a different column renderer such as, heatmap, bar, and spark area. If you select Custom formatting, you can set units, style, and formatting options for number values.
Parameters
You can use parameters in your interactive workbook to manipulate the results of the query in different ways. When you select Add Parameter, a New Parameter page opens where you can provide the name and other inputs required for the parameter.
You can create the following parameter types:
- Text. You can enter arbitrary text.
- Drop down. You can modify the appearance of a query step to include a dropdown menu in which you can select a value from a set of values. In this parameter type, you can enter a KQL query or a JSON string to provide the choices for the dropdown list.
- Time range picker. You can select from prepopulated time ranges or select a custom range.
- Resource picker. You can select one or more Azure resources.
- Subscription picker. You can select one or more Azure subscription resources.
- Resource type picker. You can select one or more Azure resource type values.
- Location picker. You can select one or more Azure location values.
- Options group. You can group multiple properties into group.
- Tabs.
- Multi-value.
You can reference parameter values in other parts of the workbooks either by using bindings or by using value expansions.
On the New Parameter pane in the Previews section, you can review the variables that are displayed and used in the query code.
Links/tabs
You can add a links/tabs step to customize the navigation in the workbook with tabs, lists, paragraphs, or bullet lists. You can provide the following inputs while adding a new links/tabs step:
- Text before link. Use this option to display the text before the link is selected.
- Link text. Use this option to specify the actual text that is displayed in the link.
- Text after link. Use this option to indicate the text that is displayed after the link is selected.
- Action. Use this option to specify the action that is performed when you select the link, such as Url, Set a parameter value, and Scroll to a step.
- Value. Use this option to indicate a value for the link.
- Settings. Use this option to configure specific settings based on the link type and support parameters syntax.
- Context pane?. Use this option to open a new context panel to the side instead of a full view.
- Style. Use this option to select between Link, Button (primary), and Button (secondary) styles.
Metric steps
You can use metric steps to combine the results of the workbook with metrics from different Azure resources. After you're done making all your custom modifications to your workbook, remember to save the workbook by selecting Done Editing.