Mitigate application crashes
A crash event could occur due to unhandled exceptions. Recall the ‘Cheesecake’ app example, we identified that a crash event occurred on the app. To narrow down the potential causes, use Crash Monitoring within App Service Diagnostics to further investigate. Here you will review how to configure Crash Monitoring on your application to monitor for potential crashes and how to analyze the collected memory dump.
Configure Crash Monitoring on your app
Crash Monitoring is a feature in Azure App Service Diagnostics that allows users to collect memory dumps and callstack information to identify the root cause of the crash. You can locate Crash Monitoring by navigating to App Service Diagnostics. Select Diagnostic Tools, and then Crash Monitoring from the left navigation menu.
To configure Crash Monitoring, first select an existing storage account in which the collected info will be saved. Note that you are advised to use one storage account per app and refrain from modifying data on the storage account while the tool is running. Configure the start time and end time using the time picker. You can choose the number of dumps you want to collect. In this scenario, we will choose 4. Then, select Start Monitor. When you start the monitor, the app settings will be updated to enable Crash Monitoring and restart the app. Now the configuration is completed.
Analyze the collected memory dumps and call stack information
After some time, the tool may detect a crash and automatically collect a call stack and a memory dump at the time of the crash. This could take up to 15-20 minutes for this insight to populate after a crash.
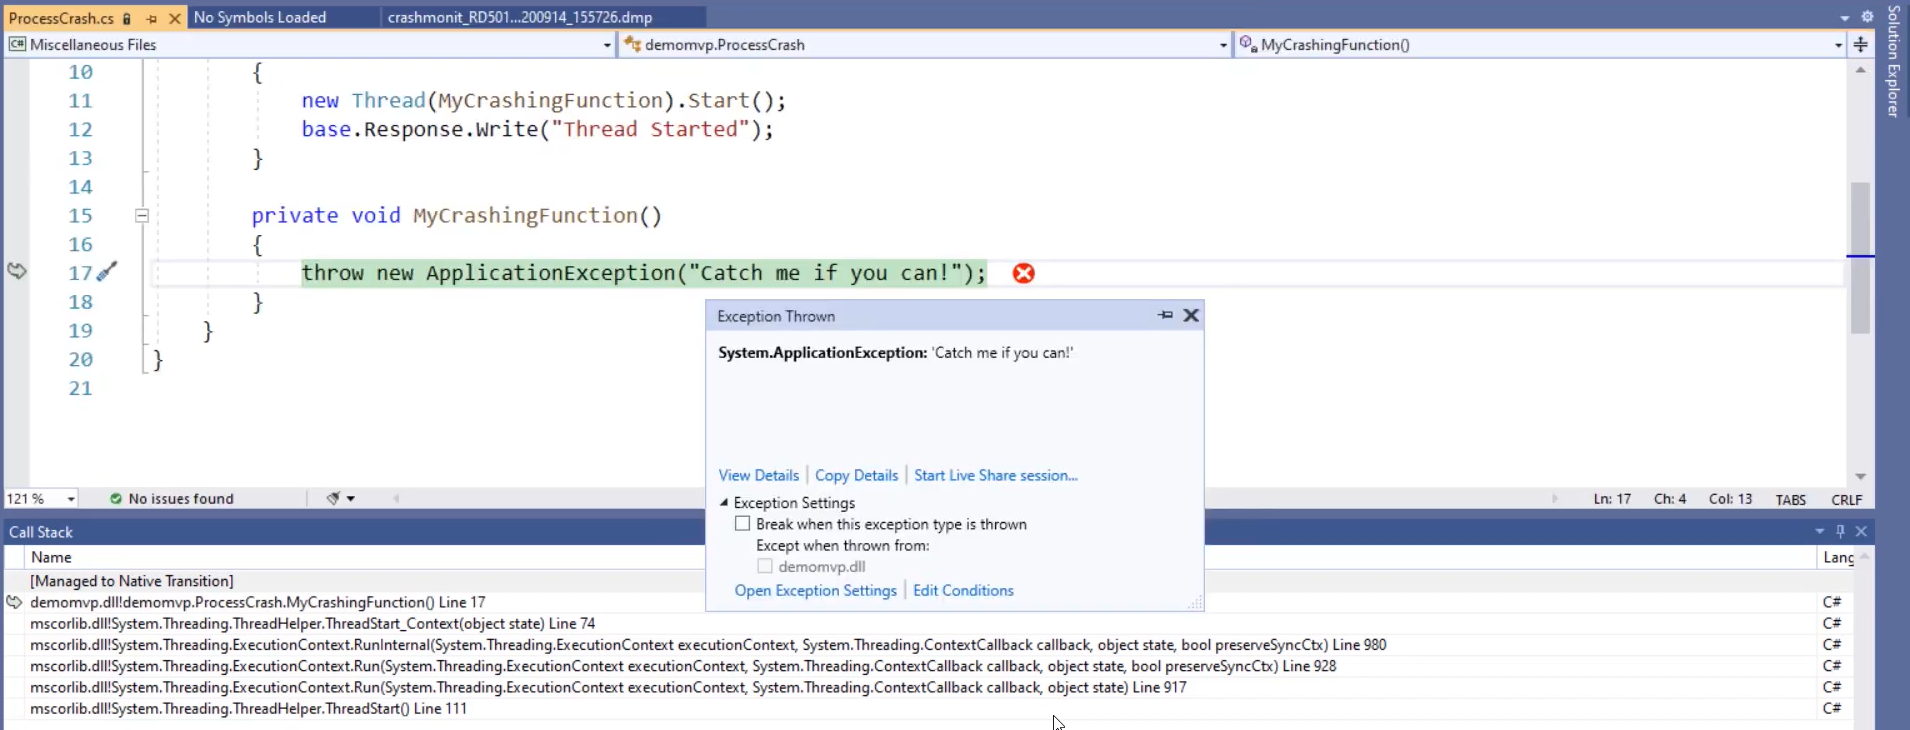
To view the collected information, click on the call stack to view it on the web or download the memory dump and open it in VS Code. When the file loads in VS Code, you can view the exception type and exception message. Click on Debug with Managed Only in the right corner. This attempts to load the PDB files and open the exact source code of the function if VS and symbols are lined up properly. Even if they are not, the Visual Studio Debugger will show exception details as you see in the below image, and you can nail down on the exact line of code where the crash happened. In this scenario, the crash was due to a function started on a new thread. You can easily identify the call stack and exception message directly from the memory dump file via Crash Monitoring. This method can be easily applied to production scenarios as well.
