Lab - Work with reports
Read this first - before you start the lab!
Important
For this lab, you CANNOT sign in with your own credentials. Use the following steps to sign in to your lab environment with the correct credentials.
Ensure that you are signed in to Microsoft Learn.
Select Launch VM mode or Sign in to launch VM mode in this unit.
In the Resources tab on the lab side bar, select the T icon next to Password in the MININT box, to have the administrator password for the Virtual Machine entered for you.
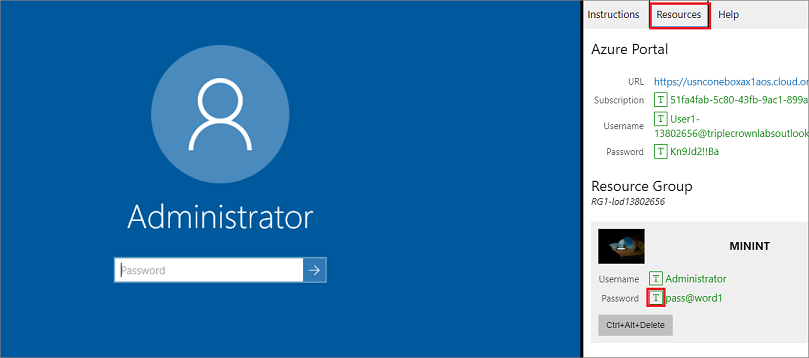
Select Enter.
Microsoft Edge will open. Wait for it to navigate to the Sign in page for finance and operations.
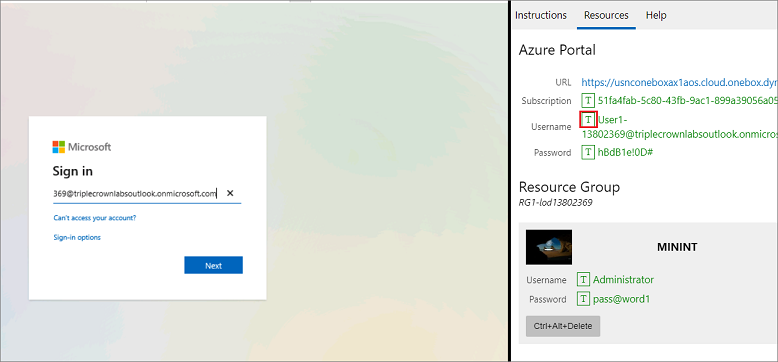
On the Microsoft Sign in page in finance and operations, place your mouse cursor into the Username field.
On the Resources tab of the lab side bar, below the Azure portal heading, select the T icon next to Username, then press Enter.
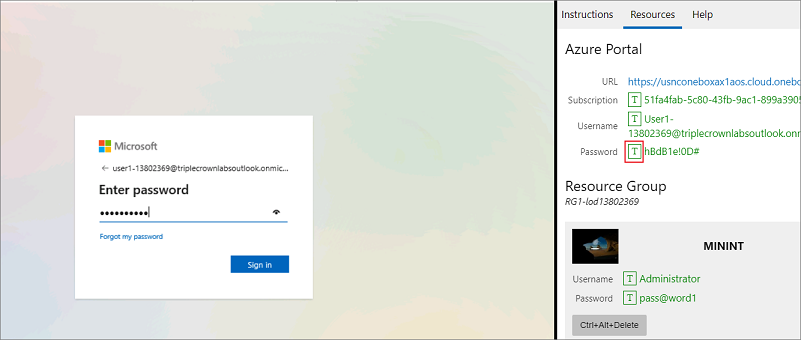
Your mouse cursor will now be in the Password page.
On the Resources tab of the lab side bar, below the Azure portal heading, select the T icon next to select Password, then press Enter.
Don't stay signed in or store the password on the virtual machine.
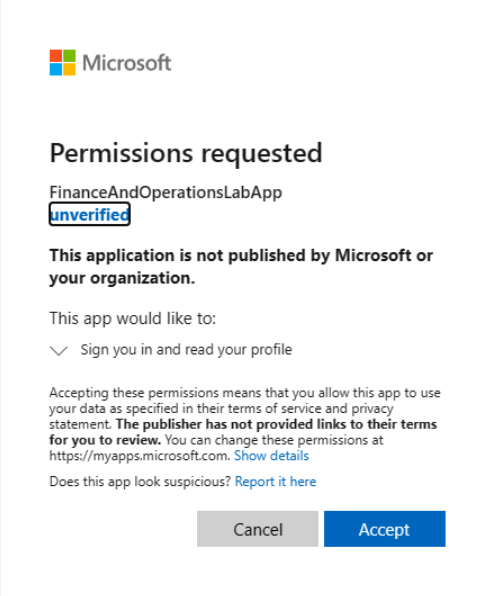
Select Accept in the Permissions requested page.
To see the lab instructions, select the Instructions tab on the lab side bar.
You can now begin your work on this lab.
Scenario - Generate and explore a financial report
You need to generate and explore an existing default financial report. The report includes all accounts and contains account properties (attributes) for the accounts. You'll be drilling into transaction detail, applying a dimension filter, and changing the currency on the report.
Display the order of dimensions for financial reporting
Displaying the order of dimensions for financial reporting lets you select how the dimensions are displayed.
- In the company USMF, go to General ledger > Chart of Accounts > Dimensions > Financial dimension configuration for integrating applications.
- Expand the Financial dimensions FastTab of the Default dimension format.
- Arrange the dimensions so that the MainAccount is first on the list - you will need to select MainAccount from the AVAILABLE list and use the right arrow to move it to the SELECTED list.
- Arrange the dimensions so that the BusinessUnit is second on the list.
- Arrange the dimensions so that the CostCenter is third on the list.
- Arrange the dimensions so that the Department is fourth on the list.
- Select Save and Yes to save the changes.
- Close the page.
Generate a report and explore the data in the report
- Go to General ledger > Inquiries and reports > Financial reports.
- Select the row for the report named Ledger Transaction List – Default.
- Select Edit.
- In the Do you want to open ReportDesigner.application from usnconeboxax1aos.cloud.onebox.dynamics.com? prompt, select Open.
- Select Run in the Microsoft Dynamics 365 Finance: Financial Report Designer box to download the Report designer.
- Use the same credentials to log in, as you used to log in to finance and operations. The log in window may appear behind the finance and operations window. The Report designer will now open.
- Change the Base year to 2016 and select Generate in the top right of the screen.
- Return to the Financial reports list page in finance and operations. You will need to refresh the screen until the report you generated appears.
- Select View
- In the opened report, select All accounts.
- Select Accounts Receivable - Domestic - Home to drill into the account detail for the report.
- At the report transaction level, you can view the properties (attributes) that are included in the design of this report. Depending on the transaction and account, some or all the attributes might be displayed.
- Close the report transaction level.
Within a financial report, you can select to view the data either for a different period and year, or with different attributes and dimensions applied. This is done by using Report options.
- While on All accounts select Report options.
- Select Add a dimension filter, select BusinessUnit and then type 001 in the BusinessUnit is field.
- Select OK. The report now displays only the data for the 001 Business Unit. This is a personalized view of the report and isn't available for others to view.
- Close the filtered report.
Financial reports can be displayed in any currency that has been added to finance and operations apps.
- Select Currency and then select Euro (EUR). The report now displays in Euros. Any currency codes or currency symbols that are included in the report design now display in the applied currency. If no currency symbol is defined for a currency, the currency symbol is not displayed.
- Close the Ledger Transaction List - Default (EUR) report.
Scenario - Add account properties to a report design
You will update a row definition to include all accounts and the column definition to contain account attributes. Once the updates are complete, you'll generate the newly created report and explore the report.
Update a row definition
- In the company USMF, go to General ledger > Inquiries and reports > Financial reports.
- Select the row for the report named Summary Trial Balance – Default.
- Select Edit.
- In the Do you want to open ReportDesigner.application from usnconeboxax1aos.cloud.onebox.dynamics.com? prompt at the bottom of the browser, select Open.
Note
If the report designer does not open, and you are not prompted to run the Microsoft Dynamics 365 Finance: Financial Report Designer and to log in, then restart the Internet browser in the lab environment, log in again, and perform steps 1 to 4 again.
- Select Run in the Microsoft Dynamics 365 Finance: Financial Report Designer box to download the Report designer.
- Use the same credentials to log in, as you used to log in to finance and operations.
- The Summary Trial Balance – Default will now open in the Report designer.
- Select File, then Save As, and then name the report Detailed trial balance with attributes. Anytime a new report is created in the Report designer, the financial reports list is updated in finance and operations apps.
- From the report definition, select the Row definitions icon to open the Trial Balance – Default row definition.
- Save the row definition as Detailed trial balance with attributes.
- With the cursor on row 50, select Edit and then Insert Rows from Dimensions, then you can select which dimensions you'd like to have in your row definition.
- Next, you are going to build the row definition by using Main account.
- Make sure Main account contains all ampersands and select OK. The row definition now contains all the main accounts for legal entity USMF.
- Scroll down to row 11110 and delete row 11110 by right-clicking on the row and selecting Delete row
- If there is any data in rows 11080 and 11140 in Columns B & J, delete the text in those columns
- Delete all rows below 11140.
- In row 11080, in column C, select --- (Underscore amounts) from the drop-down menu.
- In row 11140, enter Total of all accounts in column B.
- In column C, select TOT from the drop-down menu.
- Enter 50:11080 in column D. If 50 is not your first row, change it to whatever the first one is.
- Save the row definition. The row definition now contains all the accounts plus a total row to add all the accounts together.
Update the column definition to include additional account attributes
- From the Detailed trial balance with attributes report definition, select the column definition icon to open the Summary Trial Balance – Default column definition.
- Save the column definition as Detailed trial balance with attributes. The column definition contains financial data columns, a description column, and calculation columns.
- Insert a column to the right after the column labeled Closing balance
- Select the column type ATTR(Attribute) for the new column.
- Add the Journal description attribute columns to the column definition to provide additional detail about the accounts.
- Insert another column to the right of the last column, and select the column type ATTR(Attribute) for the new column.
- Add the Document date attribute column to the column definition.
- Insert another column to the right of the last column, and select the column type ATTR(Attribute) for the new column.
- Add the Journal number attribute column to the column definition.
- Insert another column to the right of the last column, and select the column type ATTR(Attribute) for the new column.
- Add the Created by attribute columns to the column definition.
- Insert another column to the right of the last column, and select the column type ATTR(Attribute) for the new column.
- Add the Last modified by attribute column to the column definition.
- In the Header 2 row, add descriptions for each of the new columns that have been added in the same font as the ones already there.
- Save the column definition. Now that the row definition and column definition have been updated, add them to the report definition.
- From the Detailed trial balance with attributes report definition, select Detailed trial balance with attributes for both the row definition and column definition.
- Change the Base year to 2016.
- Save the report definition and then select Generate. When the report opens, you can explore the report as you did in the first exercise.
- Drill down on different accounts to view how the additional attributes are displayed.
- Close the Detailed trial balance with attributes report.
- Close the Report designer.
Scenario - Create a multidimensional report by using a reporting tree
You need to modify an existing default report.
You will create a reporting tree and add it to a report definition to produce a Cost center/divisional income statement. When the updates are complete, you'll generate the Cost center/divisional income statement, and explore the report by using the reporting tree.
- In company USMF, go to General ledger > Inquiries and reports > Financial reports.
- Select the row for the report named Income Statement – Default.
- Select Edit.
- In the Do you want to open ReportDesigner.application from usnconeboxax1aos.cloud.onebox.dynamics.com? prompt at the bottom of the browser window, select Open.
Note
If the report designer does not open, and you are not prompted to run the Microsoft Dynamics 365 Finance: Financial Report Designer, then restart the Internet browser in the lab environment, log in to finance and operations using the same credentials as before, and perform steps 1 to 4 again.
- Select Run in the Microsoft Dynamics 365 Finance: Financial Report Designer box to download the Report designer, and Run the ReportDesigner.exe file.
- Use the same credentials to log in, as you used to log in to finance and operations. The Report designer will now open (it may open behind the Internet browser window).
- The Income statement – default will open in the Report designer.
- On the File menu, point to New, and then select Reporting tree definition.
- On the Edit menu, select Insert reporting units from dimensions.
- Clear check boxes for all dimensions, except CostCenter under the Include section.
- Select the From dimension field for the CostCenter dimension, type 007.
- In the To dimension field, type 018.
- Select OK.
- From the File menu, Save as the resulting tree with the Name as Cost centers by division.
- Select OK. The Cost centers by division tree definition will now show.
Now that the reporting tree is created, you'll modify the reporting tree to contain three new rollup units: Marketing, Operations, and Retail.
- Select the Trade Shows unit under Summary of all units, and then select Edit, Insert Reporting Unit.
- Double-click the A Company column on the blank row and select USMF.
- Type Marketing in columns B and C.
- Select the Service Operations unit, and right-click.
- Select Insert Reporting Unit.
- Double-click the A Company column on the blank row and select USMF
- Enter Operations in columns B and C.
- Select the Outlet unit, and right-click.
- Select Insert Reporting Unit.
- Select USMF in column A of the blank row, type Retail in columns B and C.
- Notice that the Marketing, Operations, and Retail units display at the same level as the current rollup units.
- Select Save.
- Reporting units are organized through the right-click options, promote and demote. Right-click the Trade Shows unit, then select Demote Reporting Unit. Notice that the unit now displays as a child of Marketing.
- Right-click the Marketing Campaign unit, and then select Demote Reporting Unit.
- Right-click the Service Operations unit, and then select Demote Reporting Unit.
- Right-click and demote the Production, Quality Control, Logistics, Procurement, and Administration units in the same manner as in step 13.
- Make Outlet, Super, Mall, and Online children of Retail by demoting them.
- Save the resulting re-organization. Now that the reporting tree has been created and organized, it can be added to the report definition.
- On the Window menu, select 1 Income statement – Default to open the report definition, or open it via the Report definitions menu button.
- In the Tree type field, select Reporting tree.
- In the Tree field, select Cost centers by division.
- Change the Base year to 2016, Save, and then select Generate. The reporting tree will open, to give you the option of selecting any or all units.
- Select Select all, and then select OK.
- In finance and operations, refresh the page until you see the new report that you created in the Reports section - it can take a couple of minutes.
- Open the new Income statement – Default report.
- Select Reporting tree to view the reporting units. Alternatively, you can drill down on a row of the report to view all the balances for all units of the reporting tree. Due to data in the Virtual Machine, not all reporting units will appear on the reporting tree with data.
- Close the report pages, and the Report designer.
Scenario - Create a consolidated report by using an organization hierarchy
You need to add an organization hierarchy in the report definition to produce a consolidated income statement and balance sheet. When the updates are complete, you'll generate the consolidated report and explore the report by using the reporting tree.
- In the company USMF, go to General ledger > Inquiries and reports > Financial reports.
- Select the row for the report named Balance sheet and Income statement side by side – default.
- Select Edit.
- In the Do you want to open ReportDesigner.application from usnconeboxax1aos.cloud.onebox.dynamics.com? prompt at the bottom of the browser, select Open.
Note
If the report designer does not open, and you are not prompted to run the Microsoft Dynamics 365 Finance: Financial Report Designer and to log in, then restart the Internet browser in the lab environment, log in again, and perform steps 1 to 4 again.
- Select Run in the Microsoft Dynamics 365 Finance: Financial Report Designer box to download the Report designer, and Run the ReportDesigner.exe file.
- Use the same credentials to log in, as you used to log in to finance and operations. The Report designer will now open.
- The Balance sheet and income statement side by side – default report will open in the Report designer.
- Select File > Save as and name the report Consolidated balance sheet and income statement side by side, and select OK.
- Change the Base year to 2016.
- Select the Tree type drop-down arrow and select Organization Hierarchies.
- Select the Tree drop-down arrow and select Contoso Holdings.
- Save the changes and select Generate the report.
- Select all reporting units, and then select OK.
- When the Report Queue Status shows that the report is Complete, return to finance and operations and refresh the page.
- Find the Consolidated balance sheet and income statement side by side report, and open the report that you just generated.
- Select Report options.
- Select Add a dimension filter, select Department, and then type 022 for the Department is field.
- Select OK.
- Close the filtered report.
- Select the Reporting tree drop-down menu to view the reporting units. Alternatively, you can drill down on a row of the report to view all the balances for all units of the reporting tree.
- Close the Consolidated balance sheet and income statement side by side report.
- Close the Report designer.
Scenario - Create a side-by-side departmental report
You need to create a new side-by-side departmental income statement report. You'll use an existing row definition and will create a new report definition and a new column definition that uses dimension filters.
- In the company USMF, go to General ledger > Inquiries and reports > Financial reports.
- Select New.
- In the Do you want to open ReportDesigner.application from usnconeboxax1aos.cloud.onebox.dynamics.com? prompt at the bottom of the browser, select Open.
Note
If the report designer does not open, and you are not prompted to run the Microsoft Dynamics 365 Finance: Financial Report Designer and to log in, then restart the Internet browser in the lab environment, and perform steps 1 to 3 again.
- Select Run in the Microsoft Dynamics 365 Finance: Financial Report Designer box to download the Report designer.
- Use the same credentials to log in, as you used to log in to finance and operations.
- The Report designer will open with a blank report definition open.
- Create a new column definition by selecting File > New > Column Definition.
- In Column A, select DESC for the column type.
- In Column B, select FD for the column type.
- Double-click in the Dimension filter field.
- In the Dimensions window, double-click the Department column.
- In the Individual or Range section of the dialog, select the ellipsis for the From field to display a list of departments.
- Select department 022, Sales & Marketing and then select OK three times.
- Repeat steps from 9 to 13 and in point 9 select Columns as C, D, E respectively for Departments 023-025
- On the Header 2 row for each FD column, type the department descriptions for Column B – Sales and Marketing.
- On the Header 2 row for each FD column, type the department descriptions for Column C – Operations.
- On the Header 2 row for each FD column, type the department descriptions for Column D – Finance.
- On the Header 2 row for each FD column, type the department descriptions for Column E – IT.
- Save the column definition as Side by Side Departments. Because you are using an existing row definition, the report definition can now be modified to use the newly created column definition and the existing row definition.
- On the Window menu, select 1 New report definition to open the report definition.
- Select Summary Income statement – default as the row definition and Side by side departments as the column definition.
- Save the report definition as Side by side departmental income statement.
- Change the Base year to 2016.
- Change the detail level to Financial, Account & Transaction.
- Save your changes and select Generate.
- When the report opens, you can explore it.
Scenario - Print customer account statements
You need to print account statements for customers that display information for a period that you select for the FRSI legal entity that is based in France.
- In the company FRSI, go to Accounts receivable > Inquiries and reports > Customers > Customer account statement report - France.
- In the From date field, enter 1st January 2020.
- In the To date field, enter 1st May 2020.
- Select OK. The report will display on the screen.
- Close the report
Close the lab environment
- Select Done in the Instructions pane in the lab side bar.
- In the Lab is complete window, select Continue, and then select Leave to return to the next unit in the module.