Opening DevTools and the DevTools browser
There are several ways to open the DevTools tab and the Edge DevTools: Browser tab:
| Approach | Description |
|---|---|
Right-click an .html file. |
No launch.json file is used. Opens DevTools in Debug mode. Use this approach if you want to debug, and your web app can run from the file system instead of a web server. |
| Click the Launch Instance button. | No launch.json file is used. Opens DevTools in non-debug mode. Use this approach if you don't want to debug. |
| Click the Launch Project button. | A launch.json file is used. Opens DevTools in Debug mode. Use this approach if you want to debug, and your web app uses APIs that require running it on a web server. |
These approaches are described below. For detailed steps using the Demos repo, see Get started using the DevTools extension for Visual Studio Code.
Opening DevTools by right-clicking an HTML file
This approach opens the DevTools tabs in debug mode and is recommended, unless the webpage requires running on a web server, as with certain APIs.
To open DevTools and the embedded browser, along with the Debug toolbar for an HTML file on your hard drive:
In Visual Studio Code, do any of the following:
- Select Activity Bar > Explorer (
 ) > click the Open Folder button.
 - Select File > Open Folder.
- Select File > Open Recent.
- Select Activity Bar > Explorer (
Open a folder that contains web app source files.
In Visual Studio Code, in Explorer, right-click an
.htmlfile, select Open with Edge, and then select Open Browser with DevTools: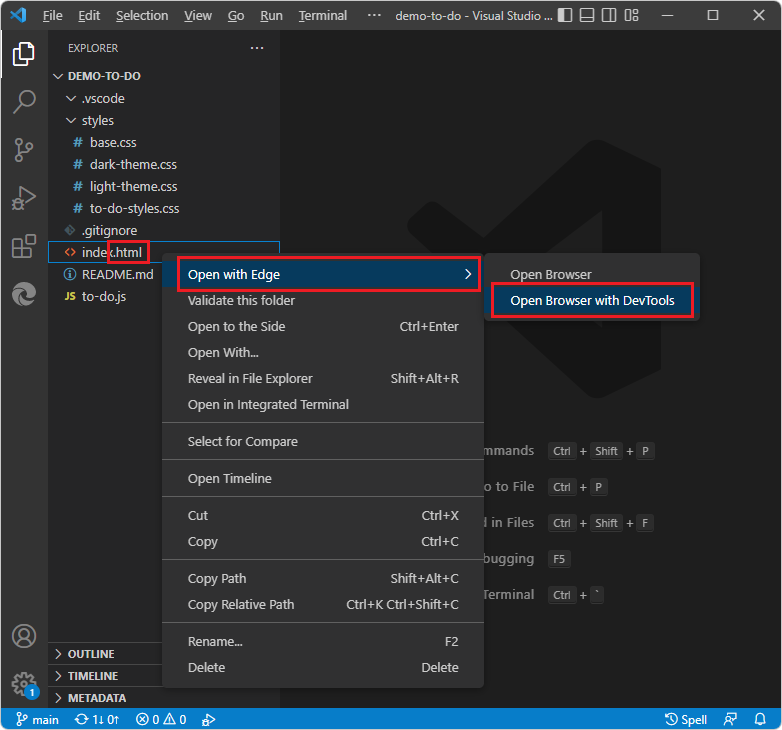
DevTools opens, with Visual Studio Code in debug mode:
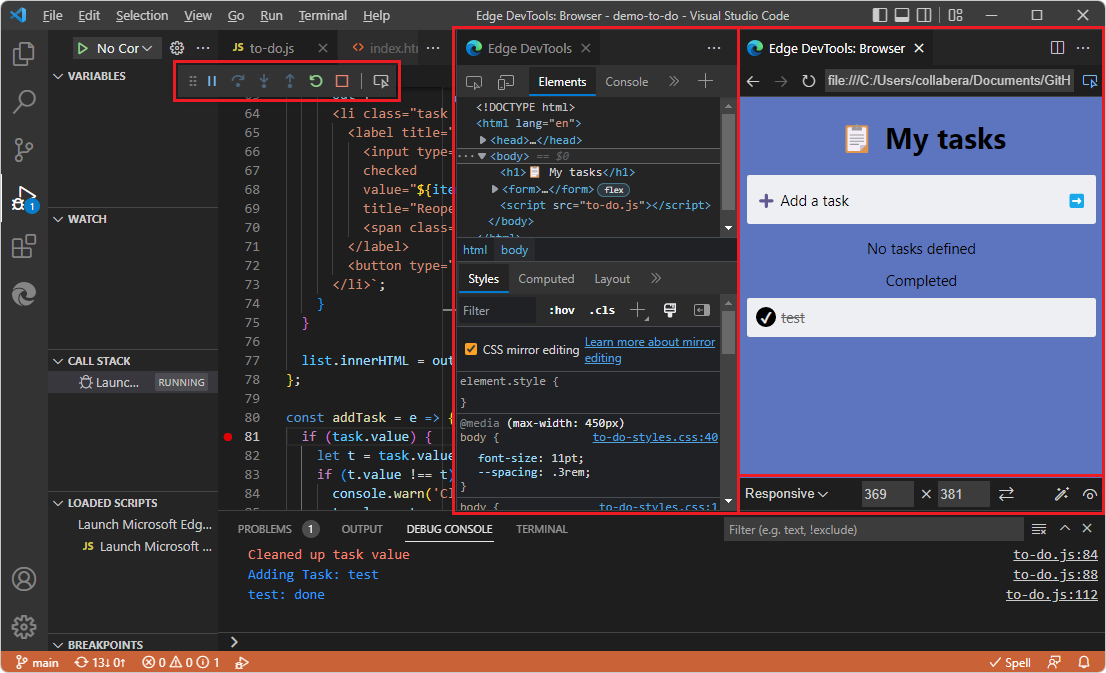
The following components open in Visual Studio Code:
- The Edge DevTools tab, including the Elements tab and other tool tabs.
- The Edge DevTools: Browser tab, including the Device Emulation toolbar on the bottom.
- The Debug toolbar at top, including buttons such as Pause, Step Over, Step Into, Reset, and Stop.
- The Debug Console at bottom.
- The Run and Debug side bar (same as selecting View > Run).
In this approach, an instance is not listed in Activity Bar > Microsoft Edge Tools > Targets.
Use the Explorer Side Bar, from the Activity Bar, to open a .js file during debugging a webpage.
The Edge DevTools: Browser tab includes a Device Emulation toolbar. This tab contains an embedded web browser with DevTools features. This browser is sometimes called a screencast or a headless browser for DevTools.
See also:
Opening DevTools by clicking the Launch Instance button
This approach opens the DevTools tabs in non-debug mode and is useful when you don't want the Debug toolbar.
These steps assume that initially, no folder is open in Visual Studio Code, and the folder you are opening doesn't have a launch.json file.
In Visual Studio Code, do any of the following:
- Select Activity Bar > Explorer () > click the Open Folder button.
- Select File > Open Folder.
- Select File > Open Recent.
To use all the DevTools features, including CSS mirror editing of your local source file when you edit CSS in DevTools, open a folder that contains source files that match the webpage that you want to display in DevTools.
- Select Activity Bar > Explorer (
In the Activity Bar, click the Microsoft Edge Tools (
 ) button, and then click the Launch Instance button:
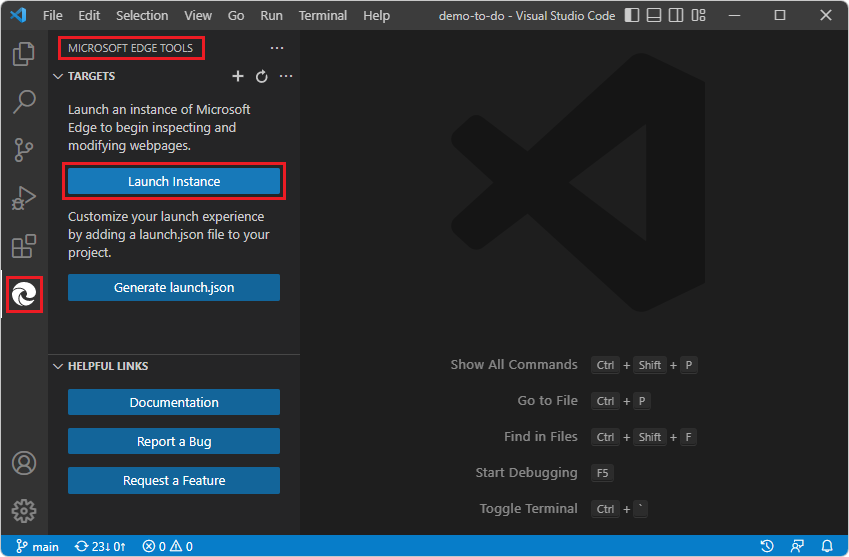
If there's a Launch Project button rather than a Launch Instance button, that indicates that the folder contains a
launch.jsonfile. Inspect what URL is specified in thelaunch.jsonfile and consider clicking Launch Project, as described in Opening DevTools by clicking the Launch Project button. Or, if you want to explore how the Launch Instance button works, you can delete thelaunch.jsonfile and generate a newlaunch.jsonfile later.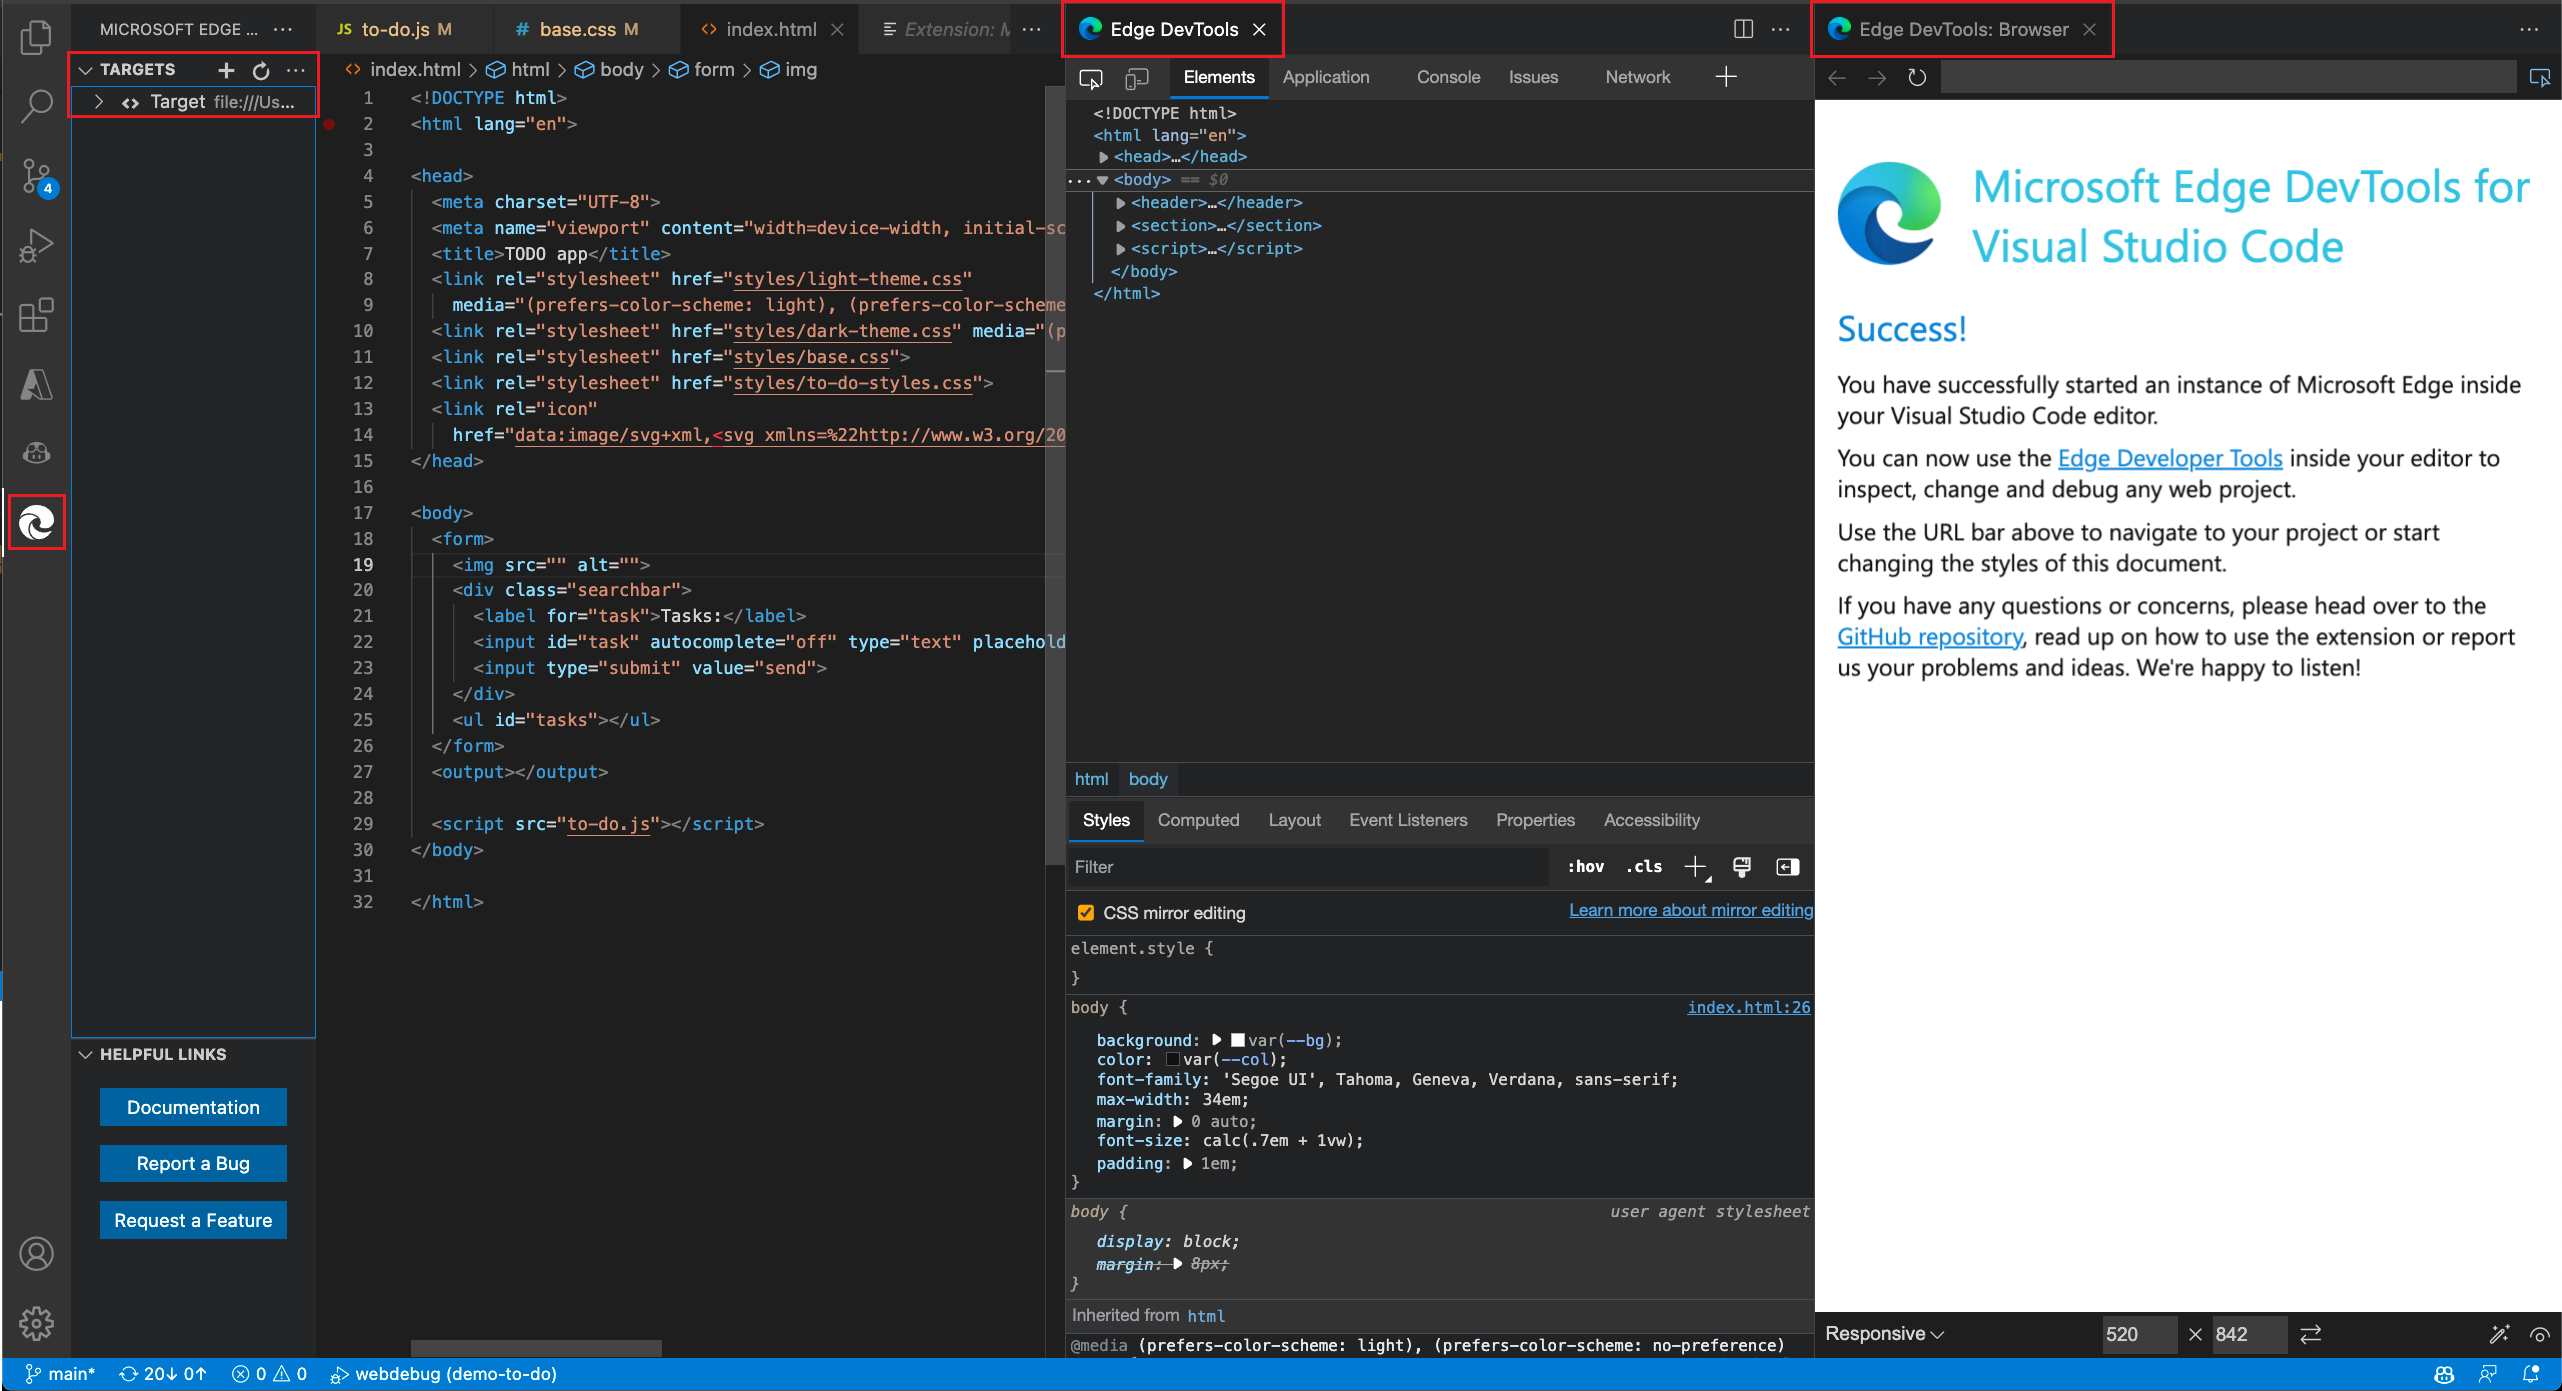
- The Edge DevTools tab opens, initially containing information about the Success page, such as
C:\Users\username\.vscode\extensions\ms-edgedevtools.vscode-edge-devtools-2.1.1\out\startpage\index.html. - The Edge DevTools: Browser tab (the embedded browser) opens, initially showing the Success page.
- The Debug toolbar and debug UI of Visual Studio Code doesn't open.
- In the Microsoft Edge Tools pane, the Targets section opens, listing a target, and the Launch Instance button is removed.
- The Edge DevTools tab opens, initially containing information about the Success page, such as
In the Edge DevTools: Browser tab, in the address bar, paste a file path or a URL, that matches the folder that's open in Visual Studio Code.
If you want to obtain a file path: in Visual Studio Code > Activity Bar > Explorer (
) > right-click an .htmlfile > Copy Path.If you want to paste a URL, examples are:
http://localhost:8080http://127.0.0.1:8080http://10.0.1.8:8080
Similar URLs are shown on the command line when you enter (for example)
npx http-serverto run a web server locally.The webpage you specified is displayed in the Edge DevTools: Browser tab (the embedded browser). The Edge DevTools tab displays information about the webpage.
See also:
Opening DevTools by clicking the Launch Project button
This approach opens the DevTools tabs in debug mode, and is recommended if the webpage requires running on a web server as with certain APIs.
Summary:
- Open a local folder containing web app source files.
- Click the Generate launch.json button.
- Add a localhost URL in the
.jsonfile. - Click the Launch Project button.
These steps assume you are running a localhost web server, as described in Step 6: Set up a localhost server in Installing the DevTools extension for Visual Studio Code.
To open DevTools by clicking the Launch Project button, do the following steps.
Open a local folder containing web app source files
In Visual Studio Code, do any of the following:
- Select Activity Bar > Explorer () > click the Open Folder button.
- Select File > Open Folder.
- Select File > Open Recent.
Select a directory that contains webpage source files. For example,
C:\Users\username\Documents\GitHub\Demos\demo-to-do\.- Select Activity Bar > Explorer (
In the Activity Bar, click Microsoft Edge Tools (
). The Microsoft Edge Tools pane opens.If the folder doesn't already contain a
.vscodedirectory that contains alaunch.json file, the Microsoft Edge Tools Side Bar contains a Launch Instance button and a Generate launch.json button.If the folder already contains a
.vscodedirectory that contains alaunch.jsonfile, the Microsoft Edge Tools Side Bar contains a Launch Project button and not a Generate launch.json button. In this case, you may want to inspect or change theurlstring in the existinglaunch.jsonfile, as described below.
Continue below.
Click the "Generate launch.json" button
Click the Generate launch.json button:
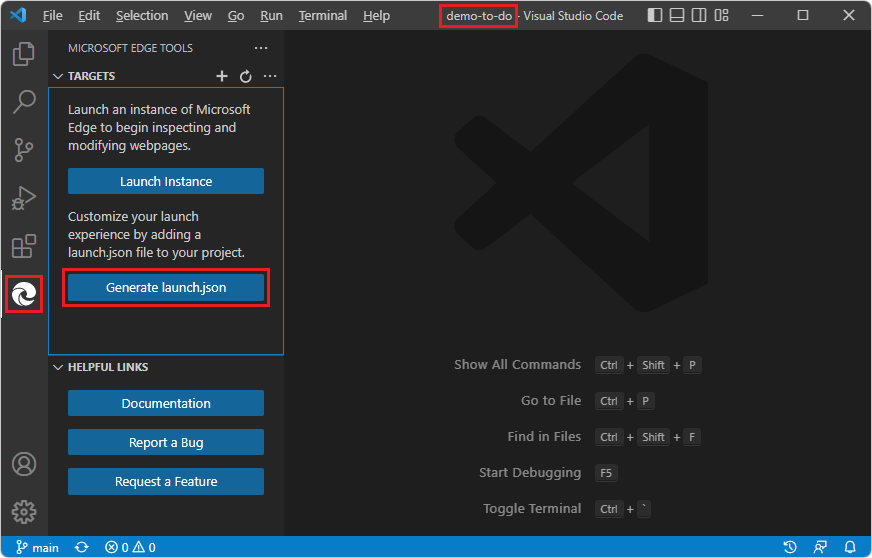
The new
launch.jsonfile opens.
Continue below.
Add a localhost URL in the .json file
In several places in the
launch.jsonfile, on each of the"url"lines, scroll to the right, and note the comment, "Provide your project's url to finish configuring":"url": "c:\\Users\\username\\.vscode\\extensions\\ms-edgedevtools.vscode-edge-devtools-2.1.1\\out\\startpage\\index.html", // Provide your project's url to finish configuringTypical examples:
http://localhost:8080http://127.0.0.1:8080http://10.0.1.8:8080
Similar URLs are shown on the command line when you start a server by entering
npx http-server.Paste the path inside the quoted path string in one of the
"url"strings. For example:"url": "http://localhost:8080", // Provide your project's url to finish configuringThe URL string can be a local file path, although in that case, you don't need a
launch.jsonfile; to start DevTools, you can simply right-click an.htmlfile in Visual Studio Code's Explorer instead.(If you keep the URL as-is, the default, Success page is displayed, and you can paste a localhost URL or a file path into the address bar of the Edge DevTools: Browser tab.)
Copy and paste the modified URL line to the other places in the
launch.jsonfile. To modify all instances at the same time, you can copy an updated URL string, then select an instance of the initial URL string, press Ctrl+Shift+L to select all instances, and then paste the updated string.Save the
launch.jsonfile.
Continue below.
Click the Launch Project button
In Visual Studio Code, in the Activity Bar, click the Microsoft Edge Tools (
) button. The Microsoft Edge Tools pane opens, now containing a Launch Project button (instead of a Launch Instance button), and no longer contains a Generate launch.json file button: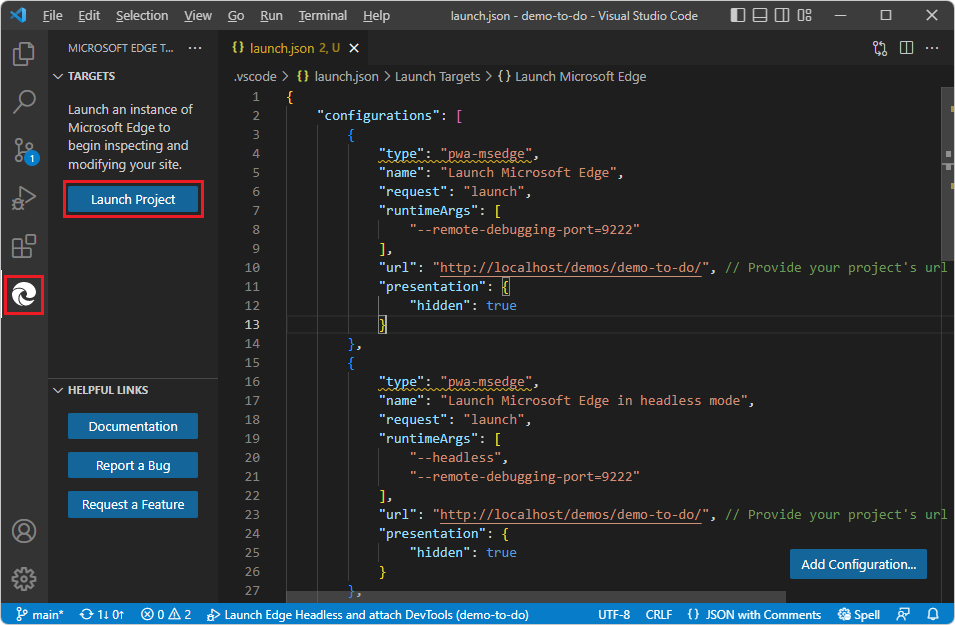
Click the Launch Project button.
The Edge DevTools tab and the Edge DevTools: Browser tab open in separate panes, showing the web app URL that's specified in
launch.json: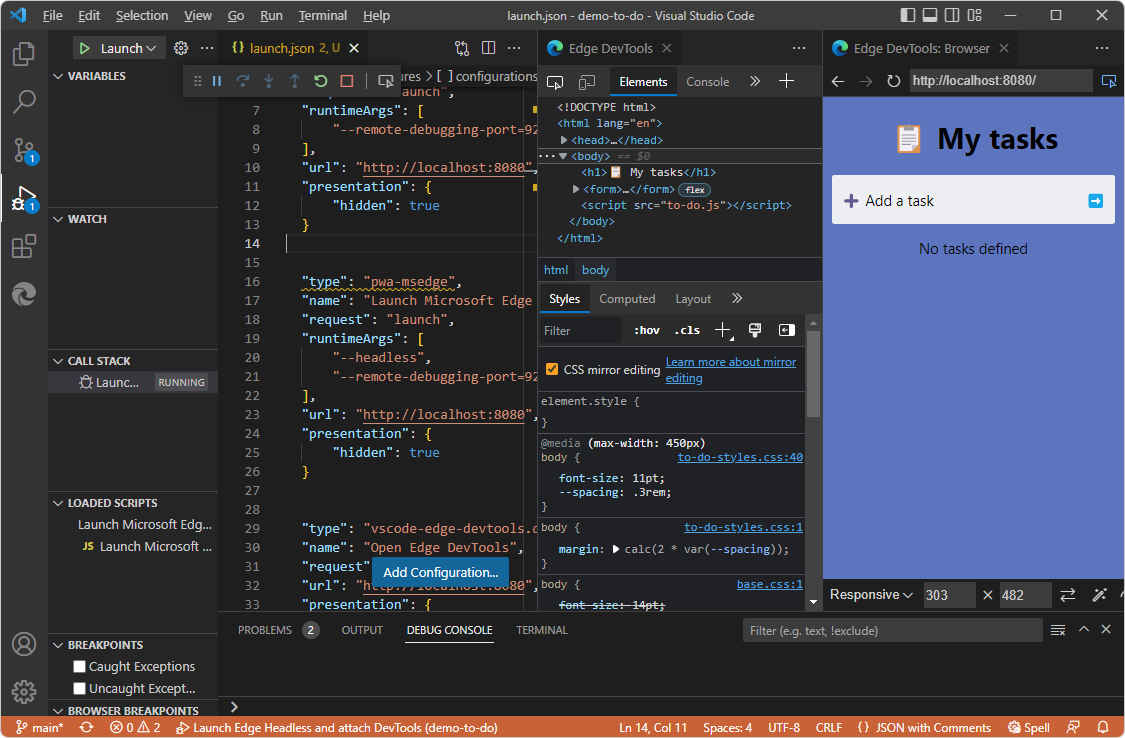
See also:
Mapping URL files to the opened folder
If DevTools is able to correlate and establish the workspace mapping between the files downloaded from the server and the files in the folder that you opened, DevTools provides its full functionality, including CSS mirror editing of your local source files when you change CSS in DevTools.
If DevTools can't map the files in the Edge DevTools: Browser tab to the files in the folder that you opened in Visual Studio Code's Explorer, you can inspect webpages, and you can change them, such as changing CSS values in the Sources tab of the Elements tool in the Edge DevTools tab. In this case, though, you can't use CSS mirror editing though, to have DevTools automatically edit your source files. Options include:
Clear the CSS mirror editing checkbox in Styles tab and continue experimenting with CSS changes.
Open a folder that contains source files that match the web page.
Grant trust to a folder by opening it in Visual Studio Code.
For example:
Open a folder that's in your local copy of the Demos repo, such as
C:\Users\username\Documents\GitHub\Demos\demo-to-do\, as described in Get started using the DevTools extension for Visual Studio Code.Open DevTools, as described above.
In the Edge DevTools: Browser tab, in the address bar, paste a remote
github.ioURL, such as https://microsoftedge.github.io/Demos/demo-to-do/.The files at that address actually reside as source files at GitHub at https://github.com/MicrosoftEdge/Demos/tree/main/demo-to-do, not on your drive.
You are now able to change CSS values in the Elements tool, because in Visual Studio Code's Explorer, a folder is open that contains source files that DevTools is able to map to the downloaded resource files constituting the webpage:
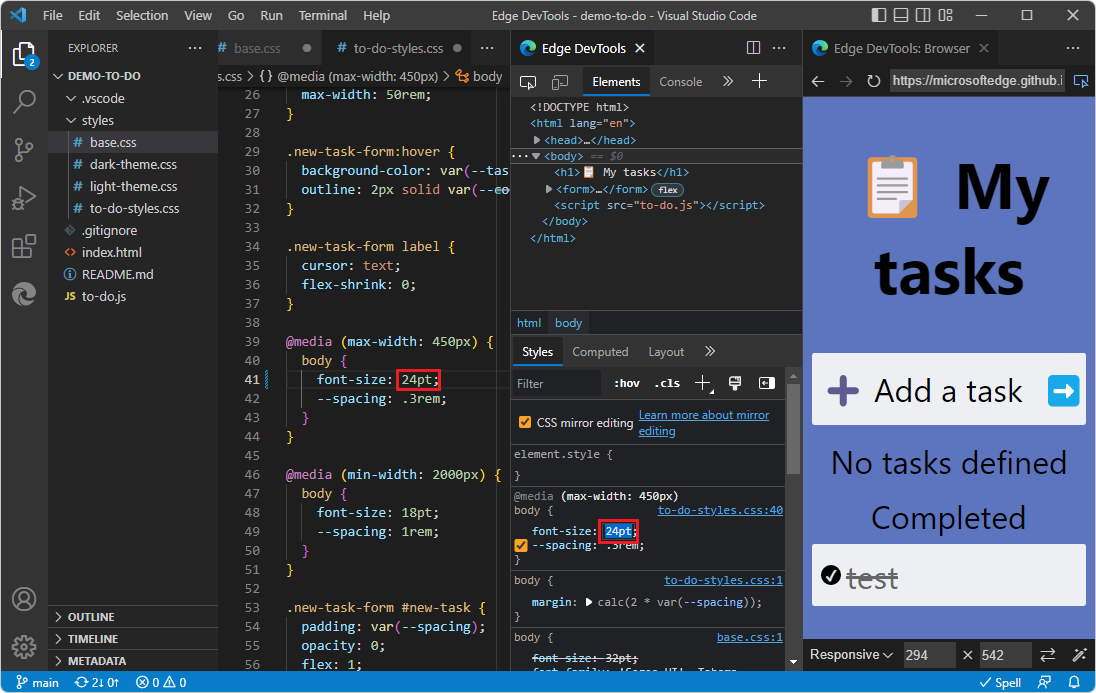
The above image shows using the Styles tab with CSS mirror editing checkbox selected, used to enlarge the body text to 24pt. The Edge DevTools: Browser tab renders the page as you change the value. The tab's address bar contains a URL rather than a file path. Because CSS mirror editing checkbox selected and the corresponding
.cssfile is found in a writeable local folder, the.cssfile on the local drive is automatically edited to24pt;.
Avoiding error messages about mirroring or mapping
Next, try changing CSS without a matching folder opened:
Select File > Close Folder.
Start DevTools by clicking the Launch Instance button, as described above.
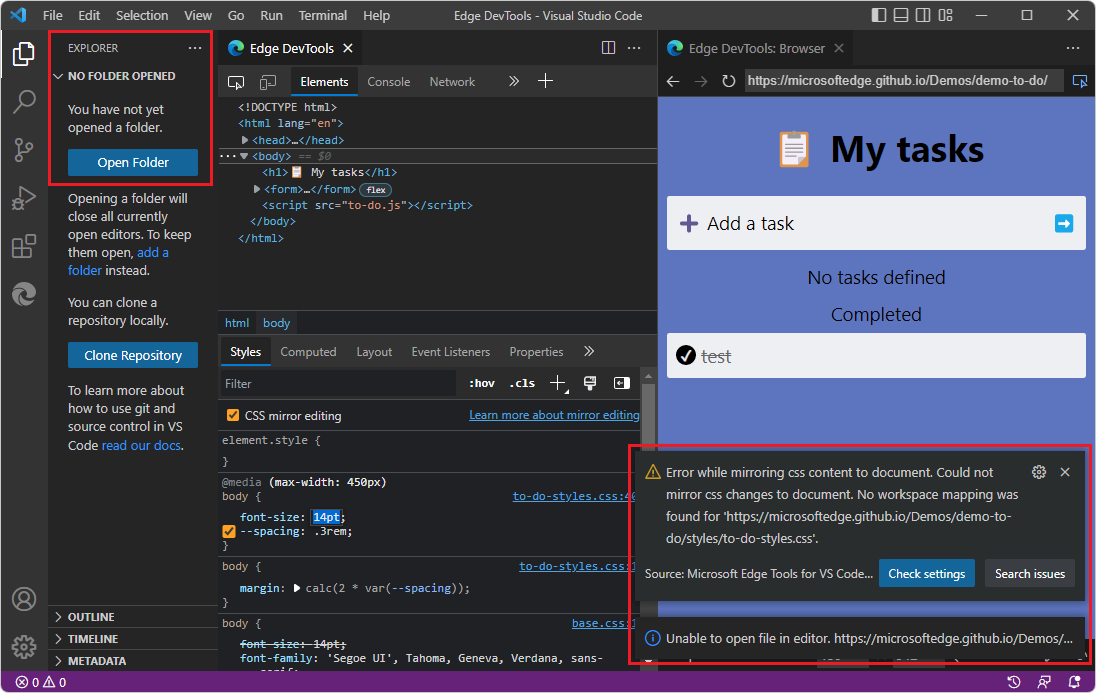
In the Edge DevTools: Browser tab, in the address bar, paste a remote
github.ioURL, such as https://microsoftedge.github.io/Demos/demo-to-do/.Now that the folder containing source files is closed, if you try to change CSS values in the Elements tool, you get a DevTools error message. You can inspect webpages, but not edit them. You can interact with the page and see it in different devices and rendering states by using the Device Emulation toolbar at the bottom of the Edge DevTools: Browser tab.
You can also inspect the CSS and HTML. But if you try to change the page, you get an error, such as Error while mirroring:
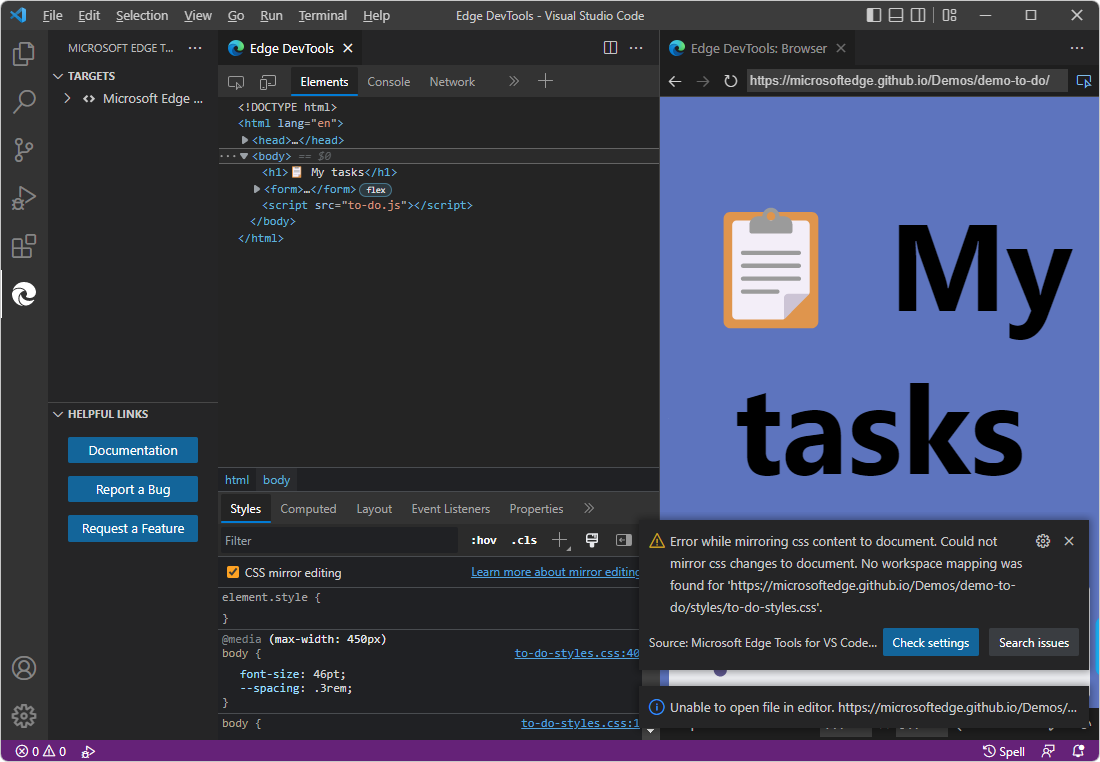
As another perspective on that scenario, here is the Microsoft Edge Tools Side Bar when the Launch Instance button was clicked, when viewing a URL and a folder isn't open that contains source files that match the URL's webpage resources:
Options in this case include:
Clear the CSS mirror editing checkbox in Styles tab and continue experimenting with CSS changes (without automatic editing of CSS in source files). This prevents further error messages about mapping to source files for CSS mirror editing.
Open a folder that contains source files that match the web page, to have automatic editing of CSS in source files.
Grant trust to a folder by opening it in Visual Studio Code, in case DevTools is attempting to edit a source file but Visual Studio Code hasn't granted trust to the containing folder.
See also:
URLs, file paths, and opening a matching folder
In some cases, behavior of DevTools is different for file paths than for URLs.
If you enter a file path in the address bar of the DevTools browser, and you edit the CSS in DevTools, the browser knows where to find the source files. You might need to open that folder to grant trust to it, to be able to use CSS mirror editing. Or, clear the CSS mirror editing checkbox.
If you enter a URL in the address bar of the DevTools browser, the browser knows where to find the downloaded copy of the source files, if you are only inspecting webpages and experimenting with CSS. If you want to use CSS mirror editing (to have DevTools edit CSS in source files), the CSS mirror editing checkbox must be selected and you must open a folder in Visual Studio Code containing source files that match the webpage.
Closing DevTools
Close instances of DevTools by using any of the following approaches:
If Visual Studio Code is in Debug mode, click the Stop button in the Debug toolbar, or select Run > Stop Debugging:
The Edge DevTools and Edge DevTools: Browser tabs close.
If the Edge DevTools tab is open, click Close (x) on the tab.
If the Edge DevTools: Browser tab is open, click Close (x) on the tab.
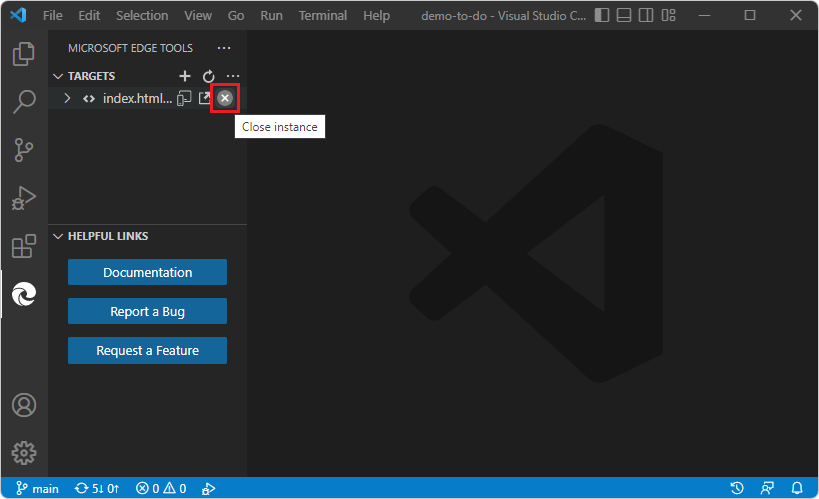
Select Activity Bar > Microsoft Edge Tools. If the Targets section lists any targets, hover on the right side of the target instance and then click Close instance (x):
The Launch Instance or Launch Project button is then displayed.
Select File > Close Folder.
Close the Visual Studio Code window.
If an external, automation-controlled browser was opened by the DevTools extension, close the external browser window.
See also
Feedback
Coming soon: Throughout 2024 we will be phasing out GitHub Issues as the feedback mechanism for content and replacing it with a new feedback system. For more information see: https://aka.ms/ContentUserFeedback.
Submit and view feedback for