What's new in Power BI Report Server
Learn about what's new in the latest versions of Power BI Report Server and Power BI Desktop for Power BI Report Server. This article covers the major feature areas and is updated with each new release. For more about what's new in Power BI Report Server, see the Change log for Power BI Report Server.
Download Power BI Report Server and Power BI Desktop for Power BI Report Server.
February 2024
A focus of this release is on accessibility. Power BI customers will notice a continuation in the work done in the previous year. We continue to provide more inclusivity for both creators and consumers in 2024.
We've made it easier for report consumers with visual impairments to get tabular data for all visuals on a page with one selection. We're displaying the data in ways that best meet their needs with show visuals as tables, an added menu item. We promised better looking reports. We're delivering extended data labels and more styling options that improve aesthetics for column and bar charts. These changes are an added benefit for neurodivergent individuals with cognitive disabilities.
Reporting
Show visuals as tables
Leveraging previous accessibility improvements to table and matrix, we're introducing a new view mode called Show visuals as tables. It displays report visuals in a tabular format with a single action. Users might prefer to consume data in a text-based or tabular format depending on their learning styles and use of assistive technologies. This supplemental format for visuals allows users to display the data in the way that best meets their needs.
This new view mode is similar to how Show as a table displays underlying data for individual visuals today. Show visuals as tables displays the underlying data for visuals for all pages in the current report, with the added functionality of interaction and cross-filtering capabilities.
To activate this view mode, navigate to the View dropdown menu and select Show visuals as tables.
Use the keyboard shortcut Ctrl+Shift+F11 to toggle between the two views.
More styling options for column and bar charts
This month brings new formatting enhancements for column and bar charts in Power BI. These additions can improve your data visualization, enabling more impactful analysis and storytelling capabilities. Here's a list of the new features available now.

Key Enhancements
- Apply Settings to All or Series: Enjoy the versatility of applying formatting options globally across all categories or tailor them for each unique individual series, effortlessly and efficiently.
- Transparency Control: You can now adjust the fill color transparency to achieve the perfect balance of visibility and design.
- Border Customization: Gaining superior control, you can now introduce borders with unmatched precision, choosing a distinct color, or match it to the column’s fill, and define both the border’s width and transparency for a polished look.
- Layout: We’ve renamed the Spacing card to be the new Layout card, relocated the familiar Reverse Order toggle that allows you to invert series, and introduced Sort by Value, Space between categories, and Space between series. And, with clustered columns and bar charts, you now have the option to Erode or Explode the stacked series.
- Advanced ribbon settings: Highlight a series or create visual continuity with an array of options including matching series color or choosing a color selection, transparency, border color matching or color selection, border width, and border spacing.
These features aim to provide you with greater flexibility and creative freedom in presenting your data, ensuring that your insights stand out with clarity and style. Enjoy exploring these new capabilities and crafting compelling narratives with your data in Power BI. For comprehensive information, see this blog post about new features for column and bar charts.
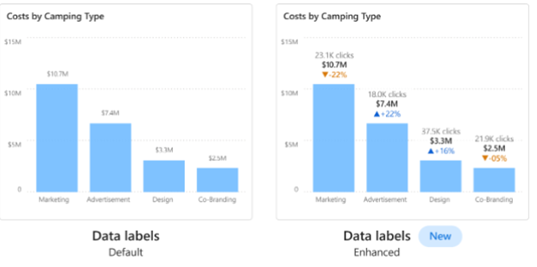
Extended customization for data labels
Data labels have more options, too. Discover new enhanced capabilities for data labels that give you extended customization choices to seamlessly match your reporting needs. They bring integration of additional metrics, dramatically improving your data analysis experience. Here are this month’s highlights.
Key Enhancements
Explore these new features of data labels to increase the data density in your charts. These advancements are available for column, bar, line, and ribbon charts.
- Title: The new Title card feature enables the display of legend fields on your data labels, offering the option to omit the legend for a cleaner look. It also allows customized data label titles using different data fields, adjustable font style, color, and transparency.
- Value: Easily spot the active field for your data label in the field well. Modifying it to another field is quick and easy, with customization options like font, color, transparency, and more, plus a new feature for blank value display.
- Detail: Our new Detail card feature unlocks new potential by allowing the inclusion of a secondary metric to your data labels. Choose any field to add an extra value, with the full range of formatting options at your disposal.
- Visual label layout: A new feature that lets you choose between a sleek single-line data label or a multi-line data label, where desired.
For more detailed information, see the blog post about these new data label features.
Remember that the Power BI Report Server release cadence is September, January, and May.
September 2023
Welcome to the September 2023 Power BI Report Server release. This release focuses on new features that enhance viewing, like the Report Server mobile view port improvements, full screen for PBIX and RDL report viewing, and mobile layout switcher. We're excited to support Power BI Desktop Developer mode for developers, and bubble range scaling for reporting. These features have been inclusively designed with better UX for report viewing and sharing. Read on for the details.
Power BI Report Server
Full-screen view
You've asked for the ability to allow your report consumers to present reports in full-screen mode. We're excited to share that we've fulfilled this request. The full-screen viewing option has been added to the View menu for Power BI (.pbix) reports and to the toolbar for paginated (.rdl) reports.
In a Power BI report: To change the view, on the View menu item, select Full screen as shown in the following image.
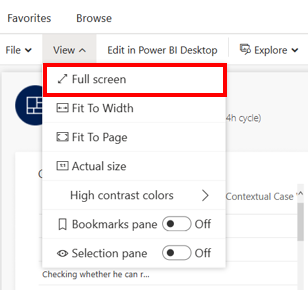
Full-screen view in a Power BI report
In a paginated (.rdl) report: We added full-screen view to the toolbar. It's located on the far right side of the pagination toolbar, as shown in the following image.

Full-screen view in paginated (.rdl) report

Responsive view navigation
Customers log in to Power BI Report Server with varying devices. We've enhanced the view port for smaller screens to make viewing reports more accessible. Users no longer need to scroll across to locate menu items. The view port has a responsive design enabled for smaller viewers. Additional menu items are collapsed to accommodate the smaller screen size.
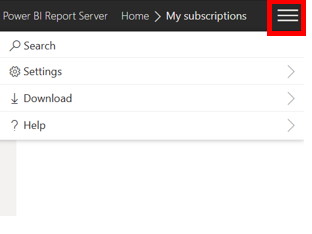
Collapsed menu items
Reporting
New layout switcher
We’ve added new buttons in Power BI Desktop that make it easy to switch quickly between web and mobile layouts while you’re developing reports. The new switcher buttons are in the lower-left corner of the screen, next to the page navigator.

New layout switcher from web to mobile layout
Mobile layout interactive canvas
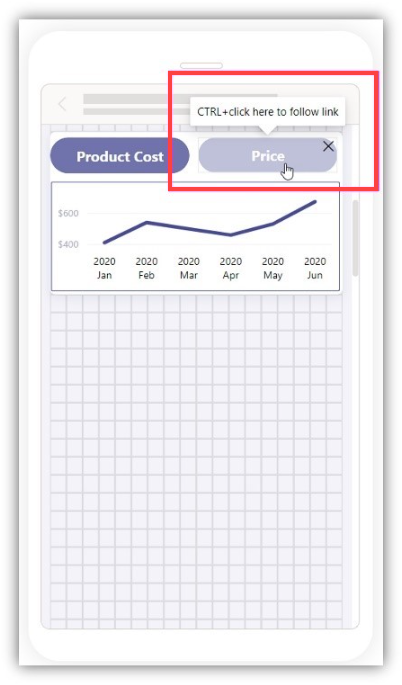
In this latest update, we've made the mobile canvas interactive.
With this new capability, you can test how buttons, slicers, and visuals behave in the app before you publish the report.
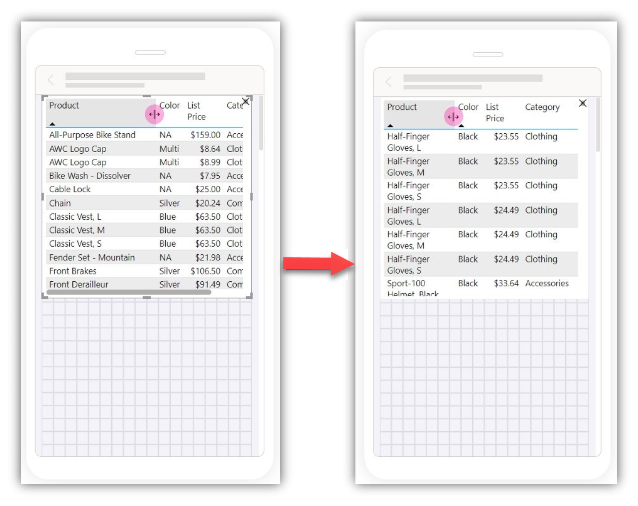
This canvas interactivity means that your report users can now interact with visuals directly. They can adjust table and matrix column headers to make them fit perfectly in mobile screens.
New bubble range scaling setting
We're introducing the new bubble range scaling setting for scatter chart and map visuals. This setting gives report creators more control over how the bubble (marker) sizes respond to the data, making it more accurate or distinctive, based on preference.
With the magnitude option, the bubble areas closely follow the data proportions. With the data-range option, the bubble size limits are mapped to data minimum and maximum. The auto option is the default setting for new reports. It selects the appropriate option based on data characteristics. For more information, see Scatter charts, bubble charts, and dot plot charts in Power BI
You can adjust this setting in the Format pane in Power BI Desktop.
- For scatter charts, under Markers, select Shape and Range scaling.
- For maps, select Bubbles > Size > Range scaling.
For reports authored in earlier Power BI versions, these settings default to (Deprecated) for scatter charts, which differs in handling negative values, and Data range for maps.
Azure Maps will also include this feature in a coming product update.
In the following figure, the size of each country represents Urban Population, which is also shown on the y-axis.

Want to get involved?
- To be a part of our customer research for paginated reports, and provide product feedback, prototype assessment, and staying abreast with what’s new, join the Paginated Operational Reports Feedback Panel.
- Or join our Reporting Services - Migration to Power BI user group. Join the fun and tune in to our monthly events.
May 2023
This release has a number of new features like the Report Server accessibility tagging for screen-reader report consumers, new accessibility for matrix navigation and selection, and updates to existing features for modeling and reporting. See the Power BI Report Server May 2023 blog for all the details.
Report Server
Accessibility options for row properties
Accessibility options are new features for report authors. You can enable them from the Power BI Report Builder authoring tool. Accessibility options for row properties allow report authors to tag rows for headers and data cells within a paginated report.
Accessibility options for text box properties
Text box properties work similarly to row properties. They allow report authors to tag heading elements to text boxes within a paginated report. To enable text box properties, right-click a text box to select the Accessibility menu and determine which structure type you wish to overwrite.
Power BI Desktop for Power BI Report Server
Reporting
See the Power BI Report Server May 2023 blog for details about these feature updates.
Format image dimensions individually in tables and matrixes.
Decide which report pages are visible in the Page navigator visual.
-
- Turn on a subtitle that can be used to add extra context to your visuals.
- Add a divider line to visually separate the visual header from its contents.
- Control the space below each component.
Apply all slicers button, Clear all slicers button, and Optimization presets update
Accessibility improvements
- New accessible report themes provide good contrast across their colors.
- Matrix accessibility improvements.
- Improved keyboard navigation and new keyboard shortcuts.
- A two-toned focus outline.
- New support for screen reader announcements.
- Added screen reader support for conditional formatting icons and data bars.
- Removed browser (default) tooltips.
- Overall performance improvements for scrolling and rendering.
Modeling
New DAX functions LINEST and LINESTX. These functions are especially useful in predicting unknown values (Y) given known values (X).
New DAX functions RANK and ROWNUMBER. These functions return a number indicating the rank for the current context within the specified partition, sorted by the specified order.
January 2023
This release has updates for the Report Server web portal, modeling, and reporting. See the Power BI Report Server January 2023 blog for all the details.
Report Server
- Accent color update
- .rdl and .pbix file migration tool
- New .rdl report community: Join the on-premises .rdl migration user group.
Power BI Report Server accent color update
In November 2022, Power BI announced the upcoming change in color accent to teal. This change was made to ensure our product is more accessible for users with disabilities. The new color improves contrast and increases visibility of the user interface in Power BI, making the experience easier to use and more inclusive. To align the on-premises Power BI Report Server with Power BI, the accent color for Power BI Report Server is now also teal in this latest release.
The Power BI brand color and icon logo remain yellow.
Publish .rdl &.pbix files to Power BI from Power BI Report Server
- Power BI Pro licenses now support paginated reports.
- Power BI Report Server has a new tool to migrate .rdl reports to the Power BI service. The new migration tool is available in the January 2023 release.
You can migrate reports without Report Server downtime or disruption to your report users. You don’t need to remove any data or reports. You can keep your current environment in place until you’re ready to retire it.
For sovereign clouds, you can update the Power BI endpoints by changing the site settings in the web portal.
Power BI Desktop for Power BI Report Server
Reporting
See the Power BI Report Server blog post for January 2023 for details about these feature updates.
Query performance improvements
- Indexing imported string columns on the fly
- Pushing Top N filter to DirectQuery sources
Unshared and unsynchronized axes for small multiples charts
Slicer type formatting moved to Format Pane.
Modeling
DAX formula bar is now available in Desktop model view.
New DAX function: EVALUATEANDLOG
Making it easier to do comparison calculations:
September 2022
This release introduces Power BI Report Server for SQL Server 2022. We continue to innovate, create, and design to give everyone the ability to achieve more. Designing for inclusion reflects how people adapt to the world around them. In this new release of Power BI Report Server, we've done a lot of accessibility work to make sure we're empowering everyone. The release includes:
- Enhanced Windows Narrator support for the new Windows Operating Systems (OS) and Windows Server
- Security enhancements
- Browser performance improvements with Angular
- Accessibility bug fixes
- Support for SQL Server 2022 (16.x) preview instances report server catalog and feature updates.
Report Server
Refreshed portal
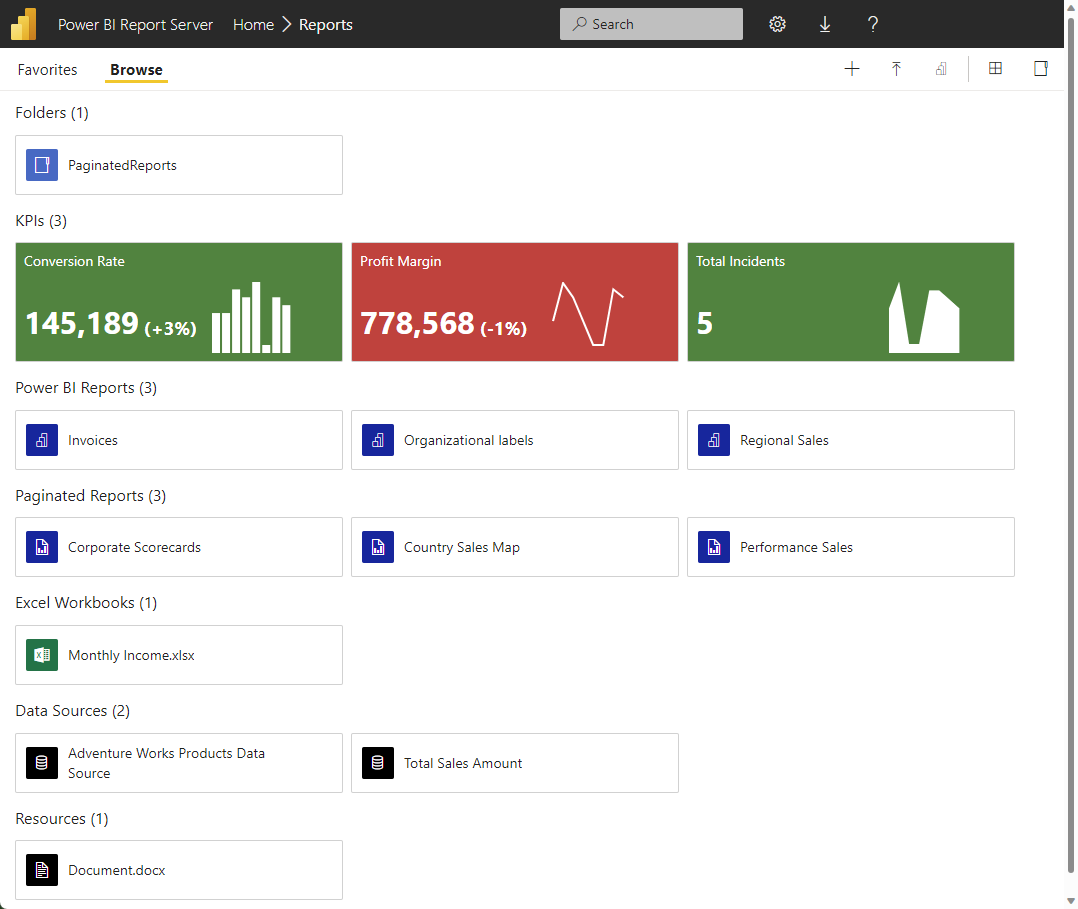
We've improved the Power BI Report Server portal to provide a more inclusive modern graphical interface, making it easier to deliver meaningful reporting on your data from a web-based experience. In the portal, you can view Power BI reports, paginated reports, Excel files, and KPIs, and navigate through the elements in your report server instance. You can also use the web portal to administer a single report server instance.
New report server properties
Report Server 2022 has a number of new options for setting system properties on the report server. The article Server Properties Advanced Page - Power BI Report Server & Reporting Services explains how to set them in SQL Server Management Studio. Each of the links in this section takes you to that option in the article.
Branding options to add a custom hyperlink, CustomUrlLabel and CustomUrlValue:
- CustomUrlLabel: default Empty value - defines what string will be shown as URL label in the top left of subnavbar.
- CustomUrlValue: default Empty value - defines the URL.
Exclude/included Client IP Address when INFO Logging in Enabled:
- LogClientIPAddress: default False value - defines if client IP will be logged.
List view by default option in catalog:
- TileViewByDefault: default True value - defines if Tiles or List view is selected for all users by default.
Power BI Desktop for Power BI Report Server
Reporting
See the Reporting section of the Power BI Report Server September 2022 blog for details about these features.
- New Format pane
- Table navigation improvements
- Error bars
- Bold/Italics/Underline for text inside the header tooltip
- Conditional formatting for data labels
- Hierarchical axis by default
- Improved display name for summarized fields
Modeling
See the Modeling section of the Power BI Report Server September 2022 blog for details about this new DAX function.
- New DAX function: NETWORKDAYS
Other
See the Other section of the Power BI Report Server September 2022 blog for details about these features.
- Data hub improvements – data preview and export
- Power BI Desktop infrastructure update (WebView2)
- Licensing API
May 2022
The May 2022 update of Power BI Report Server brings many new enhancements, including dynamic format strings support, bookmark navigators, and updated slicer defaults. Here’s a list of new and updated features with links to each. Or read the whole Power BI Report Server blog post for May 2022.
Power BI Desktop for Power BI Report Server
Reporting
- Dynamic format strings now supported for all chart elements
- Bookmark navigator now shows the last selected bookmark per group
- Data point rectangle select
- Updated slicer defaults for accessibility improvements
Other
January 2022
Here’s a list of new and updated features. For details, see the Power BI Report Server blog post for January 2022.
Power BI Desktop for Power BI Report Server
Reporting
- Page and bookmark Navigators
- Sort legend
- New formatting options for text
- Pie and donut chart rotation
Modeling
- SWITCH performance optimization
- Bitwise functions in DAX
Other
- WebView2
September 2021
Here’s a list of new and updated features. For details, see the Power BI Report Server blog post for September 2021.
Power BI Desktop for Power BI Report Server
Reporting
- Area chart transparency sliders
- Inner padding for continuous axes
- Small multiples new feature
- Conditional formatting for assorted visuals
- Customize shape formatting
- Line chart improvements
- X-axis constant line improvements
- Line chart series labels
- New formatting options for buttons
- Toggle total columns in waterfall charts
Modeling
- New Model View
- New way of expressing Date and DateTime values
- Shortcut expression for CALCULATE now supports aggregation functions
- New parameter for XIRR function
- Making it easier to format based on a user’s locale
- Evaluation configuration settings
Paginated reports in Power BI Report Builder
- New version of Power BI Report Builder
Other
- New Power BI visuals store experience
May 2021
Here’s a list of new and updated features. For details, see the Power BI Report Server blog post for May 2021.
Power BI Desktop for Power BI Report Server
Highlighted new features
Here are highlights of the new features in Power BI Desktop for Power BI Report Server.
- Smart guides for aligning objects are now available in the mobile layout view.
- Invert axis and continuous axis sorting.
- CALCULATE filters are easier to use.
- Performance improvements to IF and SWITCH functions.
- Text/CSV by example.
Other new and updated features
Reporting
- New and improved shapes
- New field list
- Search bar
- Updated color picker
- New filter operations: “is empty” and “is not empty”
Analytics
- X axis constant line for line charts.
Modeling
- IF.EAGER
- CROSSFILTER supports many-to-many relationships.
Other
- Certificate revocation check controls now available in Desktop interface.
- Simplifying collection of diagnostic information.
January 2021
What follows is a list of new and updated features. For details, see the Power BI Report Server blog post for January 2021.
Power BI Desktop for Power BI Report Server
Here are some highlights of new features.
Power BI reports
- Apply all filters is now generally available
- Visual Zoom Slider
- Certificate revocation check for web connections
- Selection pane in the mobile layout view
- ArcGIS for Power BI support
Data connectivity
- Hive LLAP connector generally available
- New connectors: Actian, Anaplan, Starburst Presto
New connection metadata format (preview)
We've updated the way that connection metadata is stored in the .pbix file format in October. This update is part of a long-term journey to make .pbix files more programmatically accessible and editable. We've already enabled the change in the version of Power BI Desktop that releases monthly in line with the Power BI service. We're previewing the changes in this release of Power BI Desktop for Report Server, starting this month.
Starting with this release you'll see the following notification prompting you to turn on the preview and upgrade to the enhanced format:
"Coming soon--turn on the enhanced metadata format preview to get better performance and security updates in Power BI."
Note the following:
- Existing datasets will continue to work, even without upgrading. They get upgraded when the enhanced format is made generally available.
- Power BI Desktop for Report Server will automatically upgrade an existing dataset to the enhanced format for you. We recommend not overwriting existing reports on Report Server with this upgraded version, in case you want to revert back to the previous format.
- Joining this preview is optional, although we encourage you to try it out and give us your feedback. We aim to make the enhanced format generally available as the only option in the next release of Report Server.
As an administrator, you can disable this preview, force V3 off, and hide the preview feature check box. Set the following DWORD value to 0 in the registry: AllowV3Models in either:
[HKEY_LOCAL_MACHINE\SOFTWARE\Policies\Microsoft\Microsoft Power BI Desktop SSRS]
"AllowV3Models"=dword:00000000
or
[HKEY_CURRENT_USER\SOFTWARE\Policies\Microsoft\Microsoft Power BI Desktop SSRS]
"AllowV3Models"=dword:00000000
See Using enhanced dataset metadata for more information.
Power BI Report Server
Browser support deprecation
If you're using Edge Legacy or Internet Explorer 11, it's time to upgrade your browser. Support for the Microsoft Edge Legacy browser stopped beginning March 9, 2021, and Microsoft Internet Explorer 11 support for Microsoft Internet Explorer 11 will stop beginning August 17, 2021.
You'll see a warning in the Power BI Report Server web portal that Internet Explorer 11 is being deprecated. Time to upgrade. See Browser support for Power BI Report Server for details.
New product icon
Power BI Report Server has a new product icon, in keeping with the new icons rolling out across all Microsoft products.
![]()
October 2020
What follows is a complete list of new and updated features. For details, see the Power BI Report Server blog post for October 2020.
Power BI Desktop for Power BI Report Server
Here are some highlights of new features.
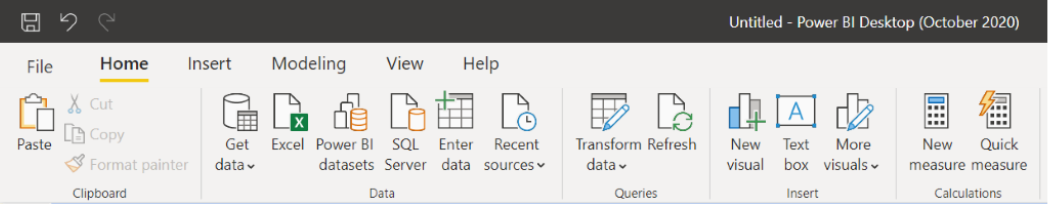
Modern ribbon
The modern ribbon has come to Power BI Desktop for Power BI Report Server. We'll continue to make additions and add more features to the ribbon. See Use the updated ribbon in Power BI Desktop to learn more about its changes and benefits.
Hierarchy slicers
You can build what's called a hierarchy slicer to filter multiple related fields in a single slicer. Now that it's generally available, it benefits from added functionality:
- New options for expand/collapse icons.
- Icons now scale with font size.
- Customizable indentation for child items.
- Further customization for slicer header text.
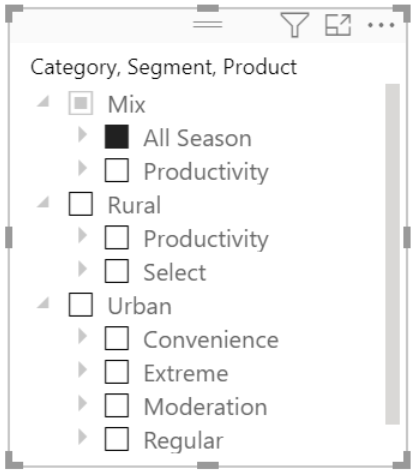
See Slicers in Power BI in the documentation for details.
Mobile authoring enhancements
In this release we're introducing an improved mobile layout authoring experience and more mobile layout capabilities. As more organizations have adopted the Power BI mobile apps, we've received feedback asking for more capabilities and improvements for the mobile authoring experience. The enhancements in this release will help you more easily build compelling, interactive reports optimized for mobile devices.
Here are the new experiences and capabilities for building mobile-optimized reports:
- New phone emulator
- Updated visualization pane
- Support for overlaid visuals
- Bookmarks available in the mobile layout view
- Turn off gridlines and snap to grid
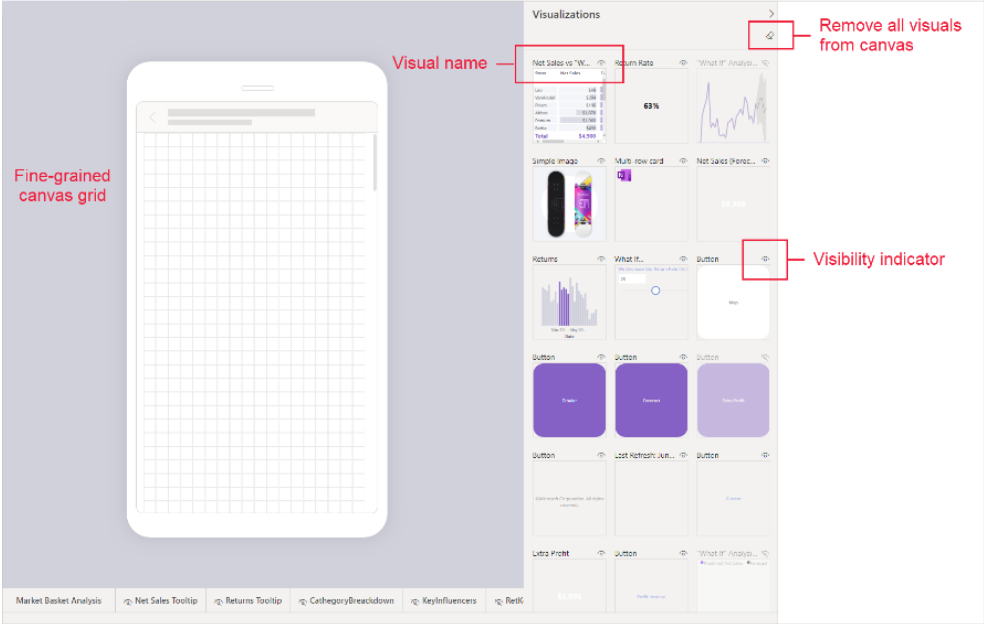
See this blog post, Enhancements to mobile authoring, for details.
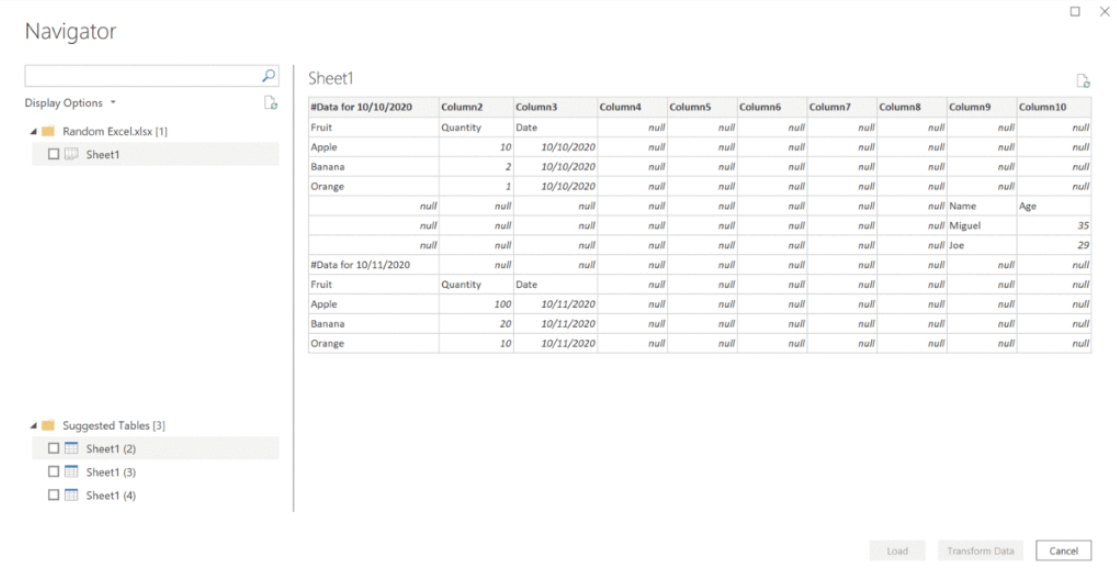
Data Preparation: Automatic table detection from Excel files
This new feature of the Excel connector automatically identifies sections of each Excel spreadsheet to extract into a table. It shows them under a “Suggested Tables” group in the Navigator. Previously, data had to be formatted as a table or named range in Excel. Otherwise you had to scrape the relevant rows/columns with specific transforms, such as skip rows and remove columns, from worksheet objects, as in Sheet1 in the following example. To use this feature, you need to enable it in the Settings dialog box.
Modeling: Enhanced Dataset Metadata
In the past, only loadable queries generated in Power Query were mapped to the data model. Now all queries are mapped to objects in the data model. The queries are regenerated based off the data model when you open that .pbix file.
This backend update has unlocked future feature improvements and will continue to do so.
For example:
- With the addition of external tools in Power BI Desktop (currently in preview), tables you add through these external tools now appear as queries when you reopen your report.
- If you've tried to export a .pbit file and unzip the file, you now see the model in JSON and no longer get errors about corrupted files.
If you have an older .pbix that can't automatically update, for reasons such as unapplied changes, you need to successfully upgrade your model before you can make any other modeling changes.
Support for Windows 7 ends
After 10 years, support for Windows 7 ended on January 14, 2020. In line with this change, we stopped support for Power BI Desktop on Windows 7 on January 31, 2021. Power BI Desktop is only supported on Windows 8 and newer. The January 2021 release of Power BI Desktop optimized for Report Server will be supported according to the Modern Lifecycle Policy. In other words, it's fully supported until the next release (currently scheduled for May 2021). After May 2021, it will only receive security updates until January 2022. All support will stop after January 2022. See the Power BI Report Server support timeline for details.
Complete list of updates
Here’s a complete list of the updates in the October edition of Power BI Desktop for Power BI Report Server.
Reporting
Modern ribbon
Canvas watermarks
Total labels for stacked visuals
Added general visual option to maintain layer order
Gradient legend
Relative time filter
Ability to further customize slicer header text
Hierarchical slicer improvements
- New options for expand/collapse icons
- Icons now scale with font size
- Ability to customize indentation for child items
Mobile authoring enhancements
- New phone emulator
- Updated visualization pane
- Support for overlaid visuals
- Bookmark available in the Mobile layout view
- Turn off gridlines and snap to grid
Visualizations
- Line chart dot formatting options
Modeling
- Enhanced Dataset Metadata
- Performance improvements to IF and SWITCH functions
- Support for Excel financial functions
- Model view enabled for live connect
- Updates to Model view
Data preparation
- Global option to disable automatic type detection
Other
- Export data source to PBIDS in Power BI Desktop
- Desktop splash screen dismiss
Power BI Report Server
Change data source connection strings in Power BI reports with PowerShell
In the October release of Power BI Report Server, we're enabling the ability to update connections for Power BI reports for DirectQuery and Refresh. This ability is also a breaking change in how you could set it up in previous releases. To learn more, see Change data source connection strings in Power BI reports with PowerShell - Power BI Report Server.
May 2020
Power BI Desktop for Power BI Report Server
Among the highlights of this update are the hierarchical slicer and decomposition tree visuals, and query diagnostics. What follows is a complete list of new and updated features. For details, see the Power BI Report Server blog post for May 2020.
Reporting
Hierarchical slicer
New action types for buttons:
- Page navigation
- Drillthrough
Buttons now support fill images
Multi-column sort for tables
Dual axis for line charts
Rectangle selection for visuals
Conditional formatting for totals and subtotals in tables and matrices
Customize theme dialog
Conditional formatting discoverability
Decomposition tree
Filter pane updates:
- New filter pane experience
- Filter pane search
Modeling
New DAX functions:
- FirstNonBlankValue
- LastNonBlankValue
- Coalesce
Standard DAX separators
Visualizations
- New visualization icons
- Visual drop shadows
Data Preparation
- Query diagnostics
Other
- Using default system credentials for web proxy
Power BI Report Server
Power BI visuals API
The API version shipped with this release is 3.2.
January 2020
See the Power BI Report Server January 2020 blog post for more details.
Power BI Desktop for Power BI Report Server
This release brings many new features, such as conditional formatting for buttons, data profiling enhancements, and more formatting settings for KPIs and table visuals. Here's a summarized list of updates:
Reporting
- Setting a table column or matrix value as a custom URL
- KPI visual formatting settings
- Filter pane experience updates
Analytics
- Conditionally format buttons
- Load more for Analyze insights
- New DAX function: Quarter
Data preparation
- Data profiling enhancements
Other
- New file format: .pbids
- Performance improvements for modeling operations
Reporting
Set a table column or matrix value as a custom URL
You can set a table column or matrix value as a custom URL. You find this new option under the conditional formatting card in the formatting pane.
KPI visual formatting settings
With this month's release, KPIs have new formatting options:
- Indicator text formatting (font family, color, and alignment)
- Trend axis transparency
- Goal and distance text formatting (label text, font family, color, and size)
- Distance text formatting (label text, positive direction, font family, color, and size)
- Adding a date label with formatting (font family, color, and size)
You can conditionally format some of these new formatting options:
- Indicator font color
- Goal font color and Goal Distance font color
- The good/bad/neutral status colors
- Date font color
Filter pane experience updates
As part of the general availability of the new filter experience from the last release, we have streamlined the process to transition current reports to the new pane. When you open Power BI Report Server for the first time, you see a filter pane auto-update dialog. These updates also include banners in Report Server when reports need to be migrated to the new experience.
Analytics
Conditional formatting for buttons
These conditional formatting updates are all button related. You can now dynamically set formatting for the following properties:
- Button text font color
- Button text
- Icon line color
- Outline color
- Fill Color
- Button tooltip (under the action card)
Load more for Analyze insights
When running the Analyze feature to find insights in your data, such as Explain the increase, we only run the machine-learning models for a set period of time to show you insights in a timely manner. If there's a lot of data to analyze, you can now choose to continue to run the analysis after the initial timeout.
New DAX function: Quarter
This month, we have a new DAX function, Quarter. The Quarter function returns the quarter corresponding to a specified date.
Data preparation
Data profiling enhancements
This month we're introducing a couple of significant enhancements to our Data Profiling capabilities within the Power Query Editor, including:
- Multiple Grouping options for the Column Profile pane value distribution visual, specific by column type, in addition to the existing "By Value" criteria.
- Text: By Text Length (number of characters).
- Number: By Sign (positive/negative) and Parity (even/odd).
- Date/DateTime: By Year, Month, Day, Week of Year, Day of Week, AM/PM Time, and Hour within a day.
- And more for other data types, for example Logical True/False.
Filter options
You could already leverage several type-specific grouping criteria within the Column Profiles distribution pane. Now, you can also filter from within the callouts for each of the values in the distribution chart when grouping criteria is applied. For example, from the Data Profiles pane for a Date/DateTime column, you can exclude all values that fall in a given Month.
Other
New file format: .pbids
This month we're releasing a new file format: .pbids, to streamline the "Get Data" experience for report creators in your organization. We recommend that admins create these files for commonly used connections.
When a report creator opens a .pbids file, Power BI Desktop prompts for authentication to connect to the data source specified in the file. Then the user selects the tables to load into the model. They may also need to select the database if one was not specified in the file. From there, the report creator can start building visualizations.
Find details and examples in the Using .pbids files to get data section of the "Data sources in Power BI Desktop" article.
Performance improvements for modeling operations
We have made a performance improvement in the Analysis Services engine to speed up modeling operations such as adding measures or calculated columns and creating relationships. The amount of improvement you see depends on the model, but we have seen 20x performance improvement for some customers for actions like opening a file and adding a measure.
That's all for the January 2020 release of Power BI Report Server. Continue sending feedback, and don't forget to vote for features that you'd like to see in the Power BI.
Power BI Report Server
Export to Excel from Power BI reports
Exporting to Excel from a Power BI report in Power BI Report Server now works the same as exporting to Excel from a Power BI report in the Power BI service. You can export directly to the Excel .xlsx format, and the export limit is 150 K rows.
Azure SQL Managed Instance support
You can now host a database catalog used for Power BI Report Server in an Azure SQL Managed Instance (MI) that's hosted either in a VM or in your data center. Support is limited to using database credentials for the connection to SQL MI.
Power BI Premium dataset support
You can connect to Power BI datasets using either Microsoft Report Builder or SQL Server Data Tools (SSDT). Then you can publish those reports to Power BI Report Server using SQL Server Analysis Services connectivity. Users need to use a stored Windows user name and password to enable the scenario.
AltText (alternative text) support for report elements
When authoring reports, you can use tooltips to specify text for each element on the report. Screen reader technologies will use these tooltips.
Azure Active Directory Application Proxy support
With Azure Active Directory Application Proxy, you no longer need to manage your own web application proxy in order to allow secure access via the web or mobile apps. See Remote access to on-premises applications through Azure Active Directory's Application Proxy for more information.
Custom headers
Sets header values for all URLs matching the specified regex pattern. Users can update the custom header value with valid XML to set header values for selected request URLs. Admins can add any number of headers in the XML. See CustomHeaders in the Reporting Services Server Properties Advanced Page article for details.
Transparent Database Encryption
Power BI Report Server now supports Transparent Database Encryption for the Power BI Report Server catalog database for Enterprise and Standard editions.
Power BI visuals API
The API version shipped with this release is 2.6.0.
Microsoft Report Builder update
The newly released version of Report Builder is fully compatible with the 2016, 2017, and 2019 versions of Reporting Services. It's also compatible with all released and supported versions of Power BI Report Server.
September 2019
See the Power BI Report Server September 2019 blog post for details about all the new features.
The September 2019 update of Power BI Report Server is packed with lots of Power BI report features. Here are some of the highlights:
- Visual-level filters for slicers You can add a visual-level filter to slicers. It works like any other visual-level filter, just filtering the slicer itself and no other visuals. This filter is for useful for filtering out blanks or if you want to use measure filters.
- Icon sets for table and matrix With KPI icons, you can set up rules for showing different sets of icons in your table and matrix, similar to icon sets in Excel.
- Grouping visuals Now you can you group visuals, shapes, text boxes, images, and buttons together on a report page just like in PowerPoint. When you group objects together, you can move and resize them all together. Grouping makes it easier to work in a report with lots of objects layered on each page.
- New default themes To go along with the new theme JSON options, we're updating the themes available for reports, and changing the default theme for new reports. The new default theme both aligns better with Microsoft's design language and follows best design practices for visuals.
- Updated pane design We've refreshed much of our interface. We've updated all the panes, the footer, and view switcher to be a lighter color, updated spacing, and introduced new icons. The new design is the first step to refreshing the entire interface.
Here's the complete list of features.
Reporting
- Updated pane design
- Visual level filters for slicers
- Sorting for the performance analyzer pane
- Visual header tooltips
- Table & matrix total label customization
- Sync slicer support for hierarchy slicer
- Consistent font sizes across visuals
- Icon sets for table and matrix
- Percent support for conditional formatting by rules
- New filter pane is now generally available
- Data colors support when using play axis on scatter charts
- Performance improves when using relative date and dropdown slicers
- Grouping visuals
- Color and text classes in themes
- New default themes
Analytics
Custom format strings
Conditional formatting updates for formatting options
- Visual background and title colors
- Card colors
- Gauge fill and colors
- Alt text
- Border color
Conditional formatting warnings
Drillthrough discoverability improvement
New DAX expressions: REMOVEFILTERS and CONVERT
New DAX comparison operator: ==
Data preparation
- Improvements to M Intellisense
- New Transform: Split column by positions
- Copy to clipboard from data profiling
May 2019
Power BI Desktop for Power BI Report Server
See the Power BI Report Server May 2019 blog post for details about all the new features.
Here are some of the highlights of the release:
Performance analyzer
If your report runs slower than you expect, try the Performance Analyzer in Power BI Desktop. When you start it, it creates a log file with information about every action you take in the report. Read more about the Performance Analyzer.
New modeling view
In the new Modeling view in Power BI Desktop, you can view and work with complex datasets that contain many tables. Highlights include multiple diagram layouts and bulk editing of columns, measures, and tables. Read more about Modeling view.
Accessible visual interaction
You can now access data points on many of the built-in visuals using keyboard navigation. Read more about accessibility in Power BI reports.
Conditional formatting titles and web URL actions
Power BI reports are interactive. It makes sense that titles in a report would be dynamic, to reflect the current state of the report. You can use the same expression-bound formatting to make the URLs of your buttons, shapes, and images dynamic. Read more about expression-based titles.
Cross-highlight by axis labels
Select the axis category labels in a visual to cross-highlight the other elements on a page, just as you would select the data points in a visual. Read more about cross-highlighting.
All the new features
Here's the list of all the new features:
Reporting
- Cross-highlight on a single point in line charts
- Word wrap on titles
- Update default visual interaction to cross-filter ¬
- Rounded corners for visual borders
- Single select slicer
- Heat map support for Bing maps
- Cross-highlight by axis labels
- Default tooltip formatting
- Static web URL support for buttons, shapes & images
- Page alignment options
- Selection pane improvements
- Accessible visual interaction
- Conditional formatting for visual titles
- Conditional formatting for web URL actions for buttons, shapes, and images
- Performance analyzer pane
- Table and matrix keyboard navigation
- Line data label position control
- KPI visual Indicator text size control
Analytics
- Show dates as a hierarchy now generally available
Modeling
- New modeling view now generally available
- New DAX functions
- Update to the ALLSELECTED DAX function
- Disable autodate tables for new reports
Power BI Report Server
Support for trusted visuals
We've added support for Trusted Visuals to Power BI Report Server. Currently we support Mapbox and PowerOn visuals. ESRI, Visio, and PowerApps aren't supported for this release.)
Improved security features
RestrictedResourceMimeTypeForUpload, which admins can use to specify a comma-separated list of banned mime types, for example text/html.
January 2019
Support for these features in Power BI reports:
Row-level security Setting up row-level security (RLS) with Power BI Report Server can restrict data access for given users. Filters restrict data access at the row level, and you can define filters within roles.
Expand and collapse on matrix row headers We've added the ability to expand and collapse individual row headers, one of the most requested visual features.
Copy and paste between .pbix files You can copy visuals between .pbix files, either from the visual’s context menu or with the standard Ctrl+C keyboard shortcut, and paste it into another report with Ctrl+V.
Smart alignment guides You see smart alignment guides when moving objects on your report page, like you see in PowerPoint, to help you align everything on your page. You see the smart guides anytime you drag or resize something on your page. When you move an object near another one, it snaps into a position aligned with the other object.
Accessibility features Too many accessibility features to list: for example, fields list pane accessibility support. The fields list pane is fully accessible. You can navigate around the pane using just your keyboard and a screen reader and use the context menu to add fields to your report page.
Power BI visuals
- The API version shipped with this release is 2.3.0.
Administrator settings
Administrators can set the following properties in SSMS Advanced Properties for the server farm:
AllowedResourceExtensionsForUpload Set extensions of resources that can be uploaded to the report server. Extensions for built-in file types like *.rdl and *.pbix are not required to be included. Default is “*, *.xml, *.xsd, *.xsl, *.png, *.gif, *.jpg, *.tif, *.jpeg, *.tiff, *.bmp, *.pdf, *.svg, *.rtf, *.txt, *.doc, *.docx, *.pps, *.ppt, *.pptx”.
SupportedHyperlinkSchemes Sets a comma-separated list of the URI schemes allowed to be defined on Hyperlink actions that are allowed to be rendered or “*” to enable all hyperlink schemes. For example, setting “http, https” would allow hyperlinks to “https://www. contoso.com”, but would remove hyperlinks to “mailto:bill@contoso.com” or “javascript:window.open(‘www.contoso.com’, ‘_blank’)”. Default is “*”.
August 2018
August 2018 sees many new features added to the version of Power BI Desktop for Power BI Report Server. Here they are, broken out by area:
Highlights of the August 2018 release
Out of the whole long list of new features, these features stand out as especially interesting. For more information, see our blog post.
Report theming
Report theming is available in Power BI Report Server, which allows you to quickly color your entire report to match a theme or corporate branding. When you import a theme, all your charts automatically update to use the theme colors, and you can have access to the theme colors from the color palette. You can upload a theme file using the Import Theme option under the Switch Theme button.
A theme file is a JSON file that includes all the colors you want us to use in your report along with any default formatting you want to apply to visuals. Here is a simple sample JSON theme that just updates the default colors of the report:
{
"name": "waveform",
"dataColors": [ "#31B6FD", "#4584D3", "#5BD078", "#A5D028", "#F5C040", "#05E0DB", "#3153FD", "#4C45D3", "#5BD0B0", "#54D028", "#D0F540", "#057BE0" ],
"background":"#FFFFFF",
"foreground": "#F2F2F2",
"tableAccent":"#5BD078"
}
Conditional formatting by a different field
The ability to format a column by a different field in your model is one of the significant improvements to conditional formatting.
Conditional formatting by values
Another new conditional formatting type is the Format by field value. The Format by field value lets you use a measure or column that specifies a color, either through a hex code or name, and applies that color to the background or font color.
Report page tooltips
The report page tooltips feature is included in the August 2018 update of Power BI Report Server. This feature lets you design a report page to be used as a custom tooltip for other visuals in your report.
Log axis improvements
We’ve greatly improved log axis in your cartesian charts. You should now be able to select log scale for the numeric axis of any cartesian chart, including combo chart, when you have data that is completely positive or completely negative.
SAP HANA SSO Direct Query
SAP HANA SSO Direct Query support with Kerberos is now available for Power BI Reports.
Note
This scenario is supported only when SAP HANA is treated as a relational data source with reports you’ve created in Power BI desktop. To enable this in Power BI Desktop, in the DirectQuery menu under Options, check the “Treat SAP HANA as a relational source” and click OK.
Power BI visuals
The API version shipped with this release is 1.13.0.
Now Power BI visuals can fall back to a previous version compatible with the current version of the server API (if available).
Reporting
- Report Theming
- Buttons to trigger actions
- Combo chart line styles
- Improved default sort for visuals
- Numeric slicer
- Advanced slicer syncing
- Log axis improvements
- Data label options for funnel chart
- Set line stroke width to zero
- High contrast support for reports
- Donut radius control
- Pie and donut detail labels position control
- Format data labels separately for each measure in a combo chart
- New visual header with more flexibility and formatting
- Wallpaper formatting
- Tooltips for table & matrix
- Turn off tooltips for visuals
- Slicer accessibility
- Formatting pane improvements
- Stepped line support for line and combo charts
- Sorting experience improvement
- Print reports through Export to PDF (in Power BI Desktop)
- Create bookmark groups
- Slicer restatement
- Report page tooltips
Analytics
- New DAX function: COMBINEVALUES()
- Measure drillthrough
- Conditional formatting by a different field
- Conditional formatting by values
Modeling
- Filtering and sorting in data view
- Improved locale formatting
- Data categories for measures
- Statistical DAX functions
May 2018
Configure Power BI iOS mobile apps for report servers remotely
As an IT admin, you can now use your organization's MDM tool to remotely configure Power BI iOS mobile app access to a report server. See Configure Power BI iOS mobile app access to a report server remotely for details.
March 2018
March 2018 sees many, many new features added to the version of Power BI Desktop for Power BI Report Server. Here they are, broken out by area:
Highlights of the March 2018 release
Out of the whole long list of new features, these features stand out as especially interesting.
Rule-based conditional formatting for table and matrix
Create rules to conditionally color the background or font color of a column based on specific business logic in your table or matrix.
Show and hide pages
You want readers to have access to your report, but some of the pages aren't finished. Now you can hide them until they're ready. Or you can hide pages from normal navigation, and readers can get to the page by bookmarks or drillthrough.
Bookmarking
Speaking of bookmarking, create bookmarks to tell a story with the data in your report.
- Cross-highlighting for bookmarks: Bookmarks maintain and display the cross-highlighted state of the report page at the time you created the bookmark.
- More bookmark flexibility: Bookmarks reflect the properties you set in your report, and affect only the visuals you choose.
Multi-select data points across multiple charts
Select multiple data points in multiple charts and have the cross-filtering apply to the entire page.
Sync slicers across multiple pages of your report
A slicer can apply to one, two, or more pages in a report.
Quick measures
Create new measures based on existing measures and numerical columns in a table.
Drilling down filters other visuals
When you drill down in a given category in one visual, you can have it filter all the visuals on the page by that same category.
Visuals updates
- Cell alignment for table and matrix
- Display units and precision control for table & matrix columns
- Overflow data labels for bar and column charts
- Control data label background color for Cartesian and maps visuals
- Bar/column padding control
- Increase area used for axis labels in charts
- Scatter visual from x- & y-axis groupings
- High density sampling for maps based on latitude and longitude
- Responsive slicers
- Add an anchor date for relative date slicer
Reporting
- Turn off the visual header in reading mode for a report
- Report options for slow data sources
- Improved default visual placement
- Control visual ordering through the selection pane
- Lock objects on your report
- Search the formatting and analytics pane
- Field properties pane and field descriptions
Analytics
- UTCNOW() and UTCTODAY()
- Mark custom date table
- Drill filters other visuals
- Cell-level formatting for multidimensional AS models for multi-row card
Performance
- Filtering performance improvements
- DirectQuery performance improvements
- Open and save performance improvements
- “Show items with no data” improvements
Report server
Export to accessible PDF
When you export a paginated (RDL) report to PDF, you can now get an accessible/tagged PDF file. It's larger in size but easier for screen readers and other assistive technologies to read and navigate. You enable accessible PDF by setting the AccessiblePDF device information setting to True. See PDF Device Information Settings and Changing Device Information Settings.
Other improvements
- Add Column From Examples improvements
- Consulting Services quick link
- Improved error reporting
- View previous errors you’ve encountered
October 2017
Power BI report data sources
Power BI reports in Power BI Report Server can connect to a variety of data sources. You can import data and schedule data refresh, or query it directly using DirectQuery or a live connection to SQL Server Analysis Services. See the list of data sources that support scheduled refresh and those that support DirectQuery in "Power BI report data sources in Power BI Report Server".
Scheduled data refresh for imported data
In Power BI Report Server, you can set up scheduled data refresh to keep data up-to-date in Power BI reports with an embedded model rather than a live connection or DirectQuery. With an embedded model, you import the data, so it's disconnected from the original data source. It needs to be updated to keep the data fresh, and scheduled refresh is the way to do that. Read more about "scheduled refresh for Power BI reports in Power BI Report Server".
Editing Power BI reports from the server
You can open and edit Power BI report (.pbix) files from the server, but you get back the original file you uploaded. If the data has been refreshed by the server, the data won’t be refreshed when you first open the file. You need to manually refresh it locally to see the change.
Large file upload/download
You can upload files up to 2 GB in size, though by default this limit is set to 1 GB in the Report Server settings in SQL Server Management Studio (SSMS). These files are stored in the database just as they are for SharePoint, and no special configuration for the SQL Server catalog is required.
Accessing shared datasets as OData feeds
You can access shared datasets from Power BI Desktop with an OData feed. For more information, see Accessing shared datasets as OData feeds in Power BI Report Server.
Scale-out
This release supports scale-out. Use a load-balancer and set server affinity for the best experience. The scenario is not yet optimized for scale-out, so you see models potentially replicated across multiple nodes. The scenario will work without the Network Load Balancer and sticky sessions. However, you not only see an over-use of memory across nodes as the model is loaded N times, but performance will slow in between connections as the model is streamed as it hits a new node in between requests.
Administrator settings
Administrators can set the following properties in SSMS Advanced Properties for the server farm:
- EnableCustomVisuals: True/False
- EnablePowerBIReportEmbeddedModels: True/False
- EnablePowerBIReportExportData: True/False
- MaxFileSizeMb: Default is now 1000
- ModelCleanupCycleMinutes: How often it checks to evict models from memory
- ModelExpirationMinutes: How long until model expires and is evicted, based on last time used
- ScheduleRefreshTimeoutMinutes: How long data refresh can take for a model. The default is two hours. There is no hard upper limit.
Config file rsreportserver.config
<Configuration>
  <Service>
    <PollingInterval>10</PollingInterval>
    <IsDataModelRefreshService>false</IsDataModelRefreshService>
    <MaxQueueThreads>0</MaxQueueThreads>
  </Service>
</Configuration>
Developer API
The developer API (REST API) introduced for SSRS 2017 has been extended for Power BI Report Server to work with both Excel files and .pbix files. One potential use case is to programmatically download files from the server, refresh them, and then republish them. This is the only way to refresh Excel workbooks with PowerPivot models, for example.
There is a new separate API for large files, which will be updated in the Power BI Report Server version of Swagger.
SQL Server Analysis Services (SSAS) and the Power BI Report Server memory footprint
Power BI Report Server now hosts SQL Server Analysis Services (SSAS) internally. This isn't specific to scheduled refresh. Hosting SSAS can greatly expand the report server memory footprint. The AS.ini configuration file is available on the server nodes, so if you're familiar with SSAS, you may want to update the settings, including maximum memory limit and disk caching etc. See Server properties in Analysis Services for details.
Viewing and interacting with Excel workbooks
Excel and Power BI contain a portfolio of tools that is unique in the industry. Together, they enable business analysts to more easily gather, shape, analyze, and visually explore their data. In addition to viewing Power BI reports in the web portal, business users can now do the same with Excel workbooks in Power BI Report Server, giving them a single location to publish and view their self-service Microsoft BI content.
We’ve published a walkthrough of how to add Office Online Server (OOS) to your Power BI Report Server preview environment. Customers with a Volume Licensing account can download OOS from the Volume License Servicing Center at no cost and will have view-only functionality. Once configured, users can view and interact with Excel workbooks that:
- Have no external data source dependencies
- Have a live connection to an external SQL Server Analysis Services data source
- Have a PowerPivot data model
Support for new table and matrix visuals
Power BI Report Server now supports the new Power BI table and matrix visuals. For the latest version of Power BI Desktop, on the Power BI Report Server download page, select Advanced download options.
June 2017
- Power BI Report Server made generally available (GA).
May 2017
- Power BI Report Server Preview made available
- Ability to publish Power BI reports on-premises
- support for Power BI visuals
- Support for **Analysis Services live connections*- only with more data sources to come.
- Power BI Mobile app updated to display Power BI reports hosted in Power BI Report Server
- Enhanced collaboration in reports with comments
Related content
Check these sources to keep up-to-date on new features in Power BI Report Server.
More questions? Try asking the Power BI Community
Feedback
Coming soon: Throughout 2024 we will be phasing out GitHub Issues as the feedback mechanism for content and replacing it with a new feedback system. For more information see: https://aka.ms/ContentUserFeedback.
Submit and view feedback for