Create Shape Map visualizations in Power BI Desktop (preview)
APPLIES TO: ![]() Power BI Desktop
Power BI Desktop ![]() Power BI service
Power BI service
Note
The Azure Maps visual is now generally available. When you open a report with an existing map visual, if Azure Maps is enabled for your organization, you see a message encouraging you to upgrade your maps and filled maps to Azure Maps. In a future release, Power BI plans to deprecate older map visuals and migrate existing reports to Azure Maps. You can convert maps and filled maps to Azure Maps visuals now.
Create a Shape map visual to compare regions on a map using color. Unlike the Map visual, Shape map doesn't show precise geographical locations of data points on a map. Instead, its main purpose is to compare regions on a map by coloring them differently.

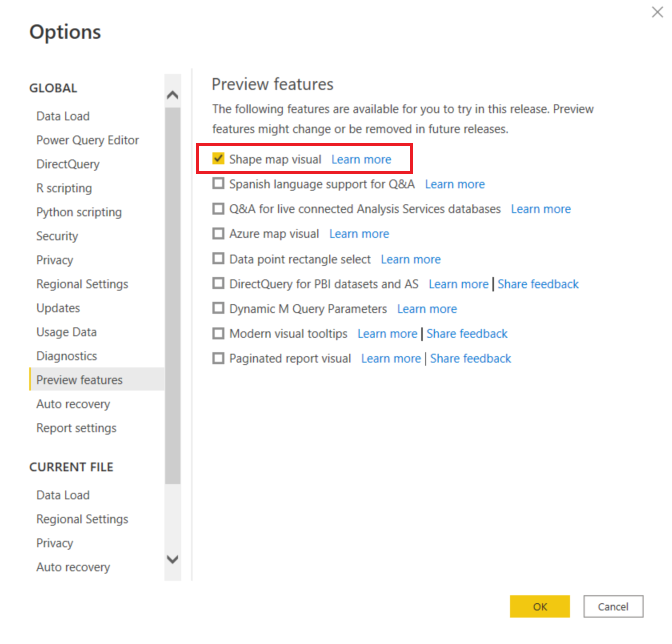
The Shape map visual is only available in Power BI Desktop and not in Power BI service or mobile. Since it is in preview, it must be enabled before you can use it. To enable Shape map, select File > Options and Settings > Options > Preview Features, then select the Shape map visual checkbox. You'll need to restart Power BI Desktop after you make the selection.
Note
Sharing your report with a Power BI colleague requires that you both have individual Power BI paid licenses or that the report is saved in Premium capacity.
Create a Shape map
You can test the Shape map control with the maps that ship with this Preview release, or you can use your own custom map as long as it meets the requirements outlined in the following section called Use custom maps. Shape map visuals are based on maps that you can find on the Internet, create yourself, or convert to the TopoJSON format. See the section below to learn more. Examples of custom maps are: geographical, seating arrangements, floor plans, and others.
In Power BI Desktop, after Shape map visual is enabled, select the Shape map icon from the Visualizations pane.

Power BI Desktop creates an empty Shape map visual design canvas.

Take the following steps to create a Shape map:
Note
In the Region keys section at the end of this article, there are tables of map region keys you can use to follow these steps.
In the Fields pane, drag a data field that has geography names (or abbreviations) onto the Location bucket, and a data measure field into the Color saturation bucket.

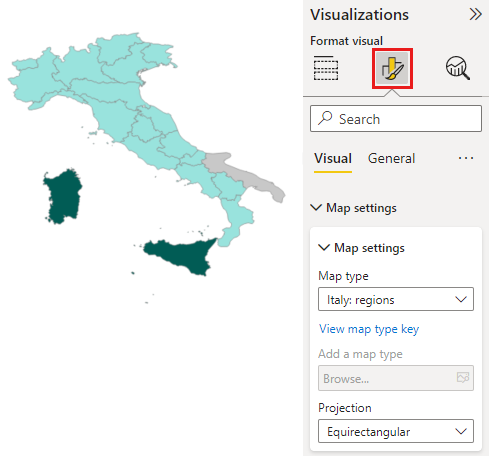
In the Format pane, expand Map settings, and change the Map type. In this example, we've selected Italy, and the rendering appears, as shown in the following image.
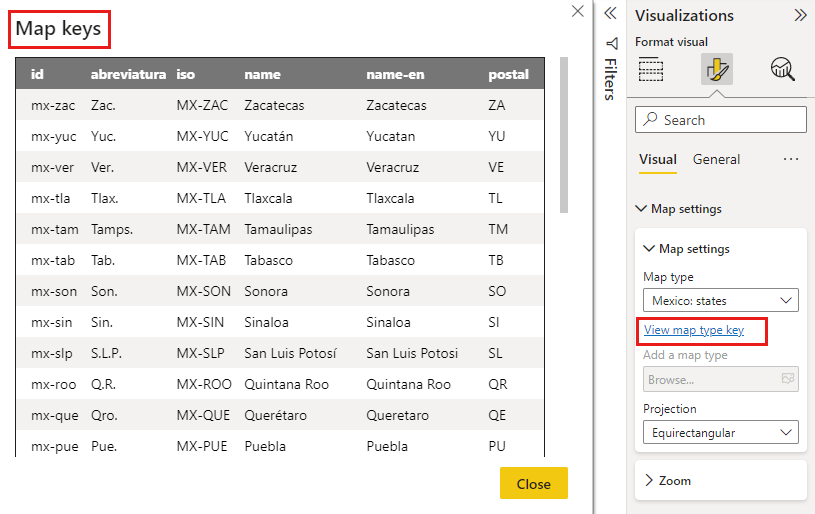
To display the map keys of the currently selected map, select View map type key. In this example, we're using a map of Mexico and the Map keys displays the values being used to build the map.
Choose which way to display a three-dimensional object (the earth) as a two-dimensional map using the Projection dropdown.
- Equirectangular: cylindrical projection that converts the globe into a grid with each rectangular cell having the same size, shape, and area.
- Mercator: cylindrical projection with the equator depicted as the line of tangency. Polar areas are more distorted than Equirectangular projections.
- Orthographic: a projection from an infinite point, as if from deep space. It gives the illusion of a three-dimensional globe
For more detailed information, see ESRI's map projections article
You can then modify the map using the Formatting options such as Default color, Zoom, and more. And, you can also add a category data column to the Legend bucket, and classify the map regions based on categories.
Use custom maps
You can use custom maps with Shape map as long as they are in the TopoJSON format. If your map is in another format, you can use online tools such as Map Shaper to convert your shapefiles or your GeoJSON maps into the TopoJSON format.
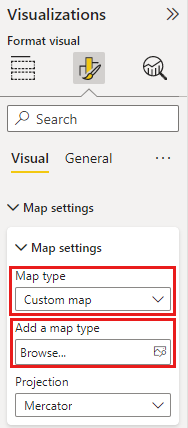
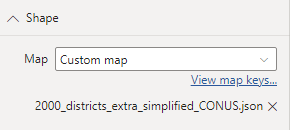
To use a TopoJSON map file, add a Shape map visual to your report. Under Map settings in the Format pane, select Custom map from the dropdown, then choose Add a map type.
Sample custom map
The Offices of the United States Attorneys release an annual fiscal report on their litigation and caseload data. We've converted some of their district data into .json files and added them to this sample PBIX.
Custom shape map demo .PBIX file
If you'd like to experiment with custom maps, download this PBIX file and follow along.
From Power BI Desktop, select File > Open report.
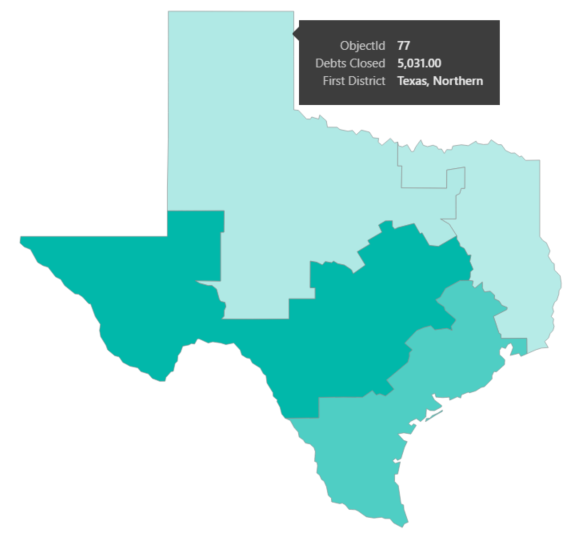
Since states can be divided into multiple districts, we have to use a custom shape map for districts. By importing the TopoJSON map of the U.S. judicial districts into Power BI Desktop, we can then visualize the annual fiscal district attorney data. The image below uses a custom map named 2000_districts_extra_simplified_CONUS.json file.

You can do interesting things with the individual state maps as well, and show more detail based on the districts it contains.
Getting map data
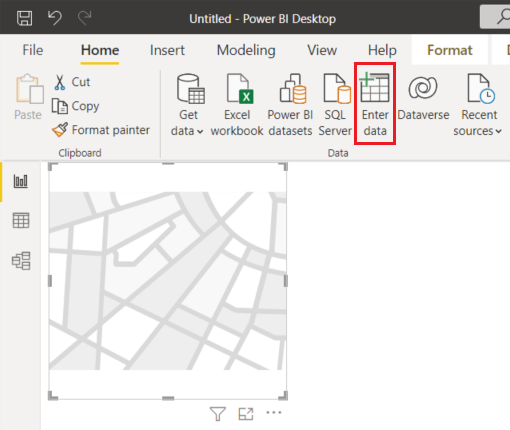
To quickly get data into a model to test Shape map, you can copy one of the tables at the end of this article, then select Enter data from the Home ribbon.
In this example, we've selected the data for Mexico and pasted it into Desktop using Enter data. The top row is automatically identified as a header.
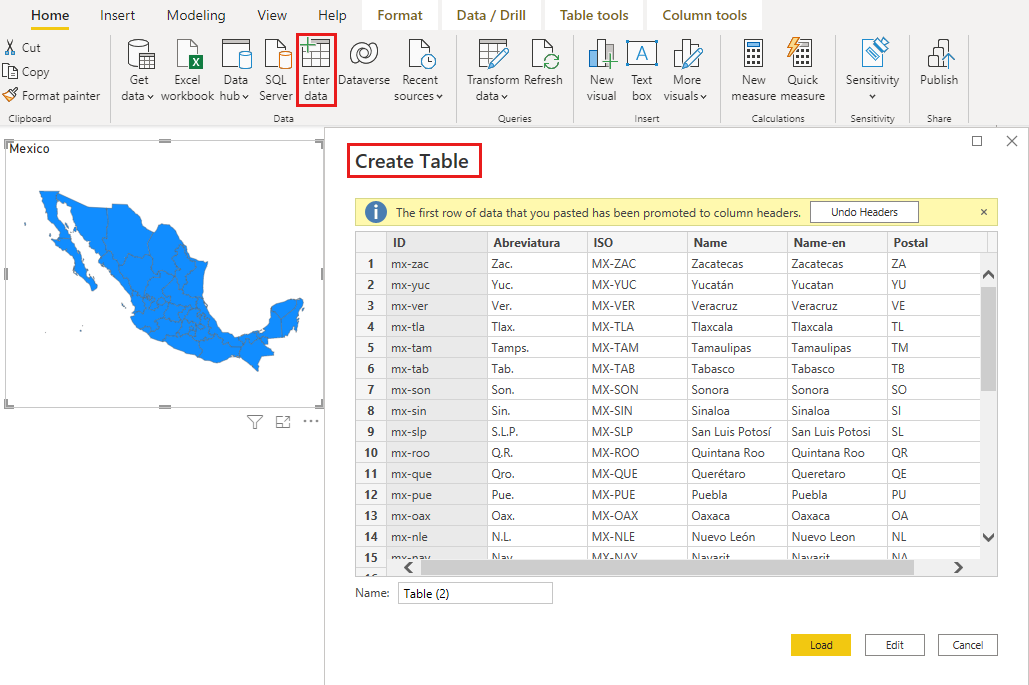
You can enter a new column simply by typing a new column name (in the blank column to the right), then add values in each cell, just like you can do in Excel. When finished, select Load and the table is added to the data model for Power BI Desktop.
Note
When working with countries or regions, use the three-letter abbreviation to ensure that geocoding works properly in map visualizations. Do not use two-letter abbreviations, as some countries or regions may not be properly recognized.
If you only have two-letter abbreviations, check out this external blog post for steps on how to associate your two-letter country/region abbreviations with three-letter country/region abbreviations.
Preview behavior and requirements
There are a few considerations and requirements for this Preview release of Shape Map:
- The Shape map visual is in Preview, and must be enabled in Power BI Desktop. To enable Shape map, select File > Options and Settings > Options > Preview Features, then select the Shape map visual checkbox.
- Currently, you must also have the Color saturation bucket set in order for the Legend classification to work properly.
- The Shape map visual will plot up to a maximum of 1,500 data points.
Region keys
Use the following Region keys in this Preview release to test Shape map.
Australia: States
| ID | Abbr | ISO | Name | Postal |
|---|---|---|---|---|
| au-wa | WA | AU-WA | Western Australia | WA |
| au-vic | Vic | AU-VIC | Victoria | VIC |
| au-tas | Tas | AU-TAS | Tasmania | TAS |
| au-sa | SA | AU-SA | South Australia | SA |
| au-qld | Qld | AU-QLD | Queensland | QLD |
| au-nt | NT | AU-NT | Northern Territory | NT |
| au-nsw | NSW | AU-NSW | New South Wales | NSW |
| au-act | ACT | AU-ACT | Australian Capital Territory | ACT |
Austria: States
| ID | ISO | Name | Name-en | Postal |
|---|---|---|---|---|
| at-wi | AT-9 | Wien | Vienna | WI |
| at-vo | AT-8 | Vorarlberg | Vorarlberg | VO |
| at-tr | AT-7 | Tirol | Tyrol | TR |
| at-st | AT-6 | Steiermark | Styria | ST |
| at-sz | AT-5 | Salzburg | Salzburg | SZ |
| at-oo | AT-4 | Oberösterreich | Upper Austria | OO |
| at-no | AT-3 | Niederösterreich | Lower Austria | NO |
| at-ka | AT-2 | Kärnten | Carinthia | KA |
| at-bu | AT-1 | Burgenland | Burgenland | BU |
Brazil: States
| ID |
|---|
| Tocantins |
| Pernambuco |
| Goias |
| Sergipe |
| Sao Paulo |
| Santa Catarina |
| Roraima |
| Rondonia |
| Rio Grande do Sul |
| Rio Grande do Norte |
| Rio de Janeiro |
| Piaui |
| Parana |
| Paraiba |
| Para |
| Minas Gerais |
| Mato Grosso |
| Maranhao |
| Mato Grosso do Sul |
| Distrito Federal |
| Ceara |
| Espirito Santo |
| Bahia |
| Amazonas |
| Amapa |
| Alagoas |
| Acre |
| Litigated Zone 1 |
| Litigated Zone 2 |
| Litigated Zone 3 |
| Litigated Zone 4 |
Canada: Provinces
| ID | ISO | Name | Postal |
|---|---|---|---|
| ca-nu | CA-NU | Nunavut | NU |
| ca-nt | CA-NT | Northwest Territories | NT |
| ca-yt | CA-YT | Yukon | YT |
| ca-sk | CA-SK | Saskatchewan | SK |
| ca-qc | CA-QC | Quebec | QC |
| ca-pe | CA-PE | Prince Edward Island | PE |
| ca-on | CA-ON | Ontario | ON |
| ca-ns | CA-NS | Nova Scotia | NS |
| ca-nl | CA-NL | Newfoundland and Labrador | NL |
| ca-nb | CA-NB | New Brunswick | NB |
| ca-mb | CA-MB | Manitoba | MB |
| ca-bc | CA-BC | British Columbia | BC |
| ca-ab | CA-AB | Alberta | AB |
France: Regions
| ID | Name | Name-en |
|---|---|---|
| Auvergne-Rhone-Alpes | ||
| Bourgogne-Franche-Comte | ||
| Bretagne | Bretagne | |
| Centre-Val de Loire | Centre-Val de Loire | Centre-Val de Loire |
| Corse | Corse | Corsica |
| Grand Est | ||
| Guadeloupe | ||
| Hauts-de-France | ||
| Ile-de-France | Île-de-France | Ile-de-France |
| La Reunion | ||
| Mayotte | ||
| Normandie | Normandie | |
| Nouvelle-Aquitaine | ||
| Occitanie | ||
| Pays de la Loire | Pays de la Loire | Pays de la Loire |
| Provence-Alpes-Cote d'Azur | Provence-Alpes-Côte d'Azur | Provence-Alpes-Cote d'Azur |
Germany: States
| ID | ISO | Name | Name-en | Postal |
|---|---|---|---|---|
| de-be | DE-BE | Berlin | Berlin | BE |
| de-th | DE-TH | Thüringen | Thuringia | TH |
| de-st | DE-ST | Sachsen-Anhalt | Saxony-Anhalt | ST |
| de-sn | DE-SN | Sachsen | Saxony | SN |
| de-mv | DE-MV | Mecklenburg-Vorpommern | Mecklenburg-Vorpommern | MV |
| de-bb | DE-BB | Brandenburg | Brandenburg | BB |
| de-sh | DE-SH | Schleswig-Holstein | Schleswig-Holstein | SH |
| de-sl | DE-SL | Saarland | Saarland | SL |
| de-rp | DE-RP | Rheinland-Pfalz | Rhineland-Palatinate | RP |
| de-nw | DE-NW | Nordrhein-Westfalen | North Rhine-Westphalia | NW |
| de-ni | DE-NI | Niedersachsen | Lower Saxony | NI |
| de-he | DE-HE | Hessen | Hesse | HE |
| de-hh | DE-HH | Hamburg | Hamburg | HH |
| de-hb | DE-HB | Bremen | Bremen | HB |
| de-by | DE-BY | Bayern | Bavaria | BY |
| de-bw | DE-BW | Baden-Württemberg | Baden-Wurttemberg | BW |
Ireland: Counties
| ID |
|---|
| Wicklow |
| Wexford |
| Westmeath |
| Waterford |
| Sligo |
| Tipperary |
| Roscommon |
| Offaly |
| Monaghan |
| Meath |
| Mayo |
| Louth |
| Longford |
| Limerick |
| Leitrim |
| Laoighis |
| Kilkenny |
| Kildare |
| Kerry |
| Galway |
| Dublin |
| Donegal |
| Cork |
| Clare |
| Cavan |
| Carlow |
Italy: Regions
| ID | ISO | Name | Name-en | Postal |
|---|---|---|---|---|
| it-vn | IT-34 | Veneto | Veneto | VN |
| it-vd | IT-23 | Valle d'Aosta | Aosta Valley | VD |
| it-um | IT-55 | Umbria | Umbria | UM |
| it-tt | IT-32 | Trentino-Alto Adige | Trentino-South Tyrol | TT |
| it-tc | IT-52 | Toscana | Tuscany | TC |
| it-sc | IT-82 | Sicilia | Sicily | SC |
| it-sd | IT-88 | Sardegna | Sardinia | SD |
| it-pm | IT-21 | Piemonte | Piedmont | PM |
| it-ml | IT-67 | Molise | Molise | ML |
| it-mh | IT-57 | Marche | Marche | MH |
| it-lm | IT-25 | Lombardia | Lombardy | LM |
| it-lg | IT-42 | Liguria | Liguria | LG |
| it-lz | IT-62 | Lazio | Lazio | LZ |
| it-fv | IT-36 | Friuli-Venezia Giulia | Friuli-Venezia Giulia | FV |
| it-er | IT-45 | Emilia-Romagna | Emilia-Romagna | ER |
| it-cm | IT-72 | Campania | Campania | CM |
| it-lb | IT-78 | Calabria | Calabria | LB |
| it-bc | IT-77 | Basilicata | Basilicata | BC |
| it-pu | IT-75 | Apulia | Puglia | PU |
| it-ab | IT-65 | Abruzzo | Abruzzo | AB |
Mexico: States
| ID | Abreviatura | ISO | Name | Name-en | Postal |
|---|---|---|---|---|---|
| mx-zac | Zac. | MX-ZAC | Zacatecas | Zacatecas | ZA |
| mx-yuc | Yuc. | MX-YUC | Yucatán | Yucatan | YU |
| mx-ver | Ver. | MX-VER | Veracruz | Veracruz | VE |
| mx-tla | Tlax. | MX-TLA | Tlaxcala | Tlaxcala | TL |
| mx-tam | Tamps. | MX-TAM | Tamaulipas | Tamaulipas | TM |
| mx-tab | Tab. | MX-TAB | Tabasco | Tabasco | TB |
| mx-son | Son. | MX-SON | Sonora | Sonora | SO |
| mx-sin | Sin. | MX-SIN | Sinaloa | Sinaloa | SI |
| mx-slp | S.L.P. | MX-SLP | San Luis Potosí | San Luis Potosi | SL |
| mx-roo | Q.R. | MX-ROO | Quintana Roo | Quintana Roo | QR |
| mx-que | Qro. | MX-QUE | Querétaro | Queretaro | QE |
| mx-pue | Pue. | MX-PUE | Puebla | Puebla | PU |
| mx-oax | Oax. | MX-OAX | Oaxaca | Oaxaca | OA |
| mx-nle | N.L. | MX-NLE | Nuevo León | Nuevo Leon | NL |
| mx-nay | Nay. | MX-NAY | Nayarit | Nayarit | NA |
| mx-mor | Mor. | MX-MOR | Morelos | Morelos | MR |
| mx-mic | Mich. | MX-MIC | Michoacán | Michoacan | MC |
| mx-mex | Méx. | MX-MEX | Estado de México | Mexico State | MX |
| mx-jal | Jal. | MX-JAL | Jalisco | Jalisco | JA |
| mx-hid | Hgo. | MX-HID | Hidalgo | Hidalgo | HI |
| mx-gro | Gro. | MX-GRO | Guerrero | Guerrero | GR |
| mx-gua | Gto. | MX-GUA | Guanajuato | Guanajuato | GT |
| mx-dur | Dgo. | MX-DUR | Durango | Durango | DU |
| mx-dif | CDMX. | MX-DIF | Ciudad de México | Mexico City | DF |
| mx-col | Col. | MX-COL | Colima | Colima | CL |
| mx-coa | Coah. | MX-COA | Coahuila | Coahuila | CA |
| mx-chh | Chih. | MX-CHH | Chihuahua | Chihuahua | CH |
| mx-chp | Chis. | MX-CHP | Chiapas | Chiapas | CP |
| mx-cam | Camp. | MX-CAM | Campeche | Campeche | CM |
| mx-bcs | B.C.S. | MX-BCS | Baja California Sur | Baja California Sur | BS |
| mx-bcn | B.C. | MX-BCN | Baja California | Baja California | BN |
| mx-agu | Ags. | MX-AGU | Aguascalientes | Aguascalientes | AG |
Netherlands: Provinces
| ID | ISO | Name | Name-en |
|---|---|---|---|
| nl-zh | NL-ZH | Zuid-Holland | South Holland |
| nl-ze | NL-ZE | Zeeland | Zeeland |
| nl-ut | NL-UT | Utrecht | Utrecht |
| nl-ov | NL-OV | Overijssel | Overijssel |
| nl-nh | NL-NH | Noord-Holland | North Holland |
| nl-nb | NL-NB | Noord-Brabant | North Brabant |
| nl-li | NL-LI | Limburg | Limburg |
| nl-gr | NL-GR | Groningen | Groningen |
| nl-ge | NL-GE | Gelderland | Gelderland |
| nl-fr | NL-FR | Fryslân | Friesland |
| nl-fl | NL-FL | Flevoland | Flevoland |
| nl-dr | NL-DR | Drenthe | Drenthe |
UK: Countries/Regions
| ID | ISO | Name |
|---|---|---|
| gb-wls | GB-WLS | Wales |
| gb-sct | GB-SCT | Scotland |
| gb-nir | GB-NIR | Northern Ireland |
| gb-eng | GB-ENG | England |
USA: States
| ID | Name | Postal |
|---|---|---|
| us-mi | Michigan | MI |
| us-ak | Alaska | AK |
| us-hi | Hawaii | HI |
| us-fl | Florida | FL |
| us-la | Louisiana | LA |
| us-ar | Arkansas | AR |
| us-sc | South Carolina | SC |
| us-ga | Georgia | GA |
| us-ms | Mississippi | MS |
| us-al | Alabama | AL |
| us-nm | New Mexico | NM |
| us-tx | Texas | TX |
| us-tn | Tennessee | TN |
| us-nc | North Carolina | NC |
| us-ok | Oklahoma | OK |
| us-az | Arizona | AZ |
| us-mo | Missouri | MO |
| us-va | Virginia | VA |
| us-ks | Kansas | KS |
| us-ky | Kentucky | KY |
| us-co | Colorado | CO |
| us-md | Maryland | MD |
| us-wv | West Virginia | WV |
| us-de | Delaware | DE |
| us-dc | District of Columbia | DC |
| us-il | Illinois | IL |
| us-oh | Ohio | OH |
| us-ca | California | CA |
| us-ut | Utah | UT |
| us-nv | Nevada | NV |
| us-in | Indiana | IN |
| us-nj | New Jersey | NJ |
| us-ri | Rhode Island | RI |
| us-ct | Connecticut | CT |
| us-pa | Pennsylvania | PA |
| us-ny | New York | NY |
| us-ne | Nebraska | NE |
| us-ma | Massachusetts | MA |
| us-ia | Iowa | IA |
| us-nh | New Hampshire | NH |
| us-or | Oregon | OR |
| us-mn | Minnesota | MN |
| us-vt | Vermont | VT |
| us-id | Idaho | ID |
| us-wi | Wisconsin | WI |
| us-wy | Wyoming | WY |
| us-sd | South Dakota | SD |
| us-nd | North Dakota | ND |
| us-me | Maine | ME |
| us-mt | Montana | MT |
| us-wa | Washington | WA |
Related content
Feedback
Coming soon: Throughout 2024 we will be phasing out GitHub Issues as the feedback mechanism for content and replacing it with a new feedback system. For more information see: https://aka.ms/ContentUserFeedback.
Submit and view feedback for