Display a visualization's underlying data
APPLIES TO: ![]() Power BI Desktop
Power BI Desktop ![]() Power BI service
Power BI service
Show data as a table
A Power BI visualization is constructed using data from your semantic models. If you're interested in seeing behind-the-scenes, Power BI lets you display the data that is being used to create the visual. When you select Show as a table, Power BI displays the data as a table below (or next to) the visualization.
You can also export the data that is being used to create the visualization as an .xlsx or .csv file and view it in Excel. For more information, see Export data from Power BI visualizations.
Note
Show as a table and Export Data are both available in Power BI Desktop and the Power BI service. However, Power BI Desktop provides one additional layer of detail; Show Records displays the actual rows from the semantic model.
Using Show as a table
To follow this tutorial in Power BI Desktop, download the Opportunity Analysis Sample PBIX file. If you'd like to use the Power BI service, download the Opportunity Analysis PBIX file, and then upload it to a workspace in the Power BI service.
Select a visualization to make it active.
Select More actions (...) and choose Show as a table.
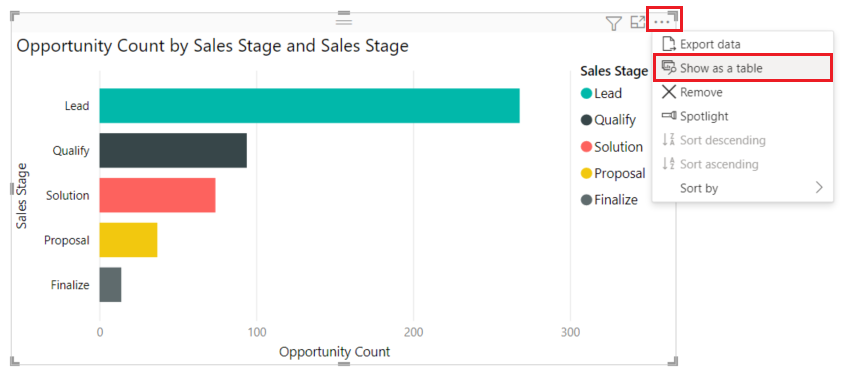
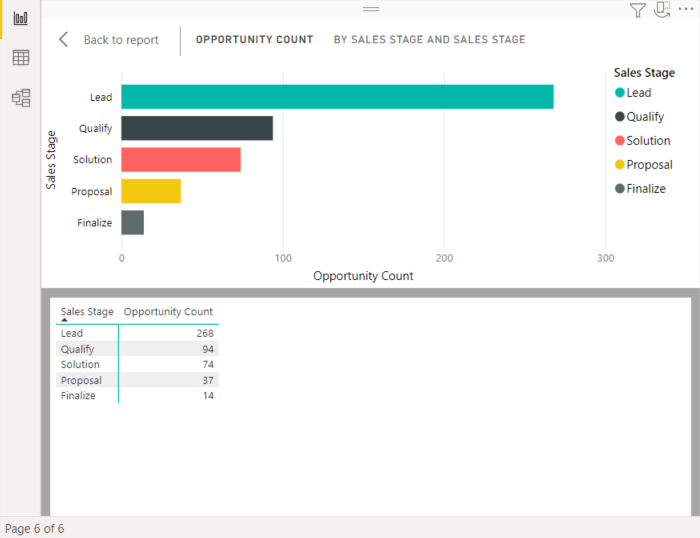
By default, the data displays below the visual.
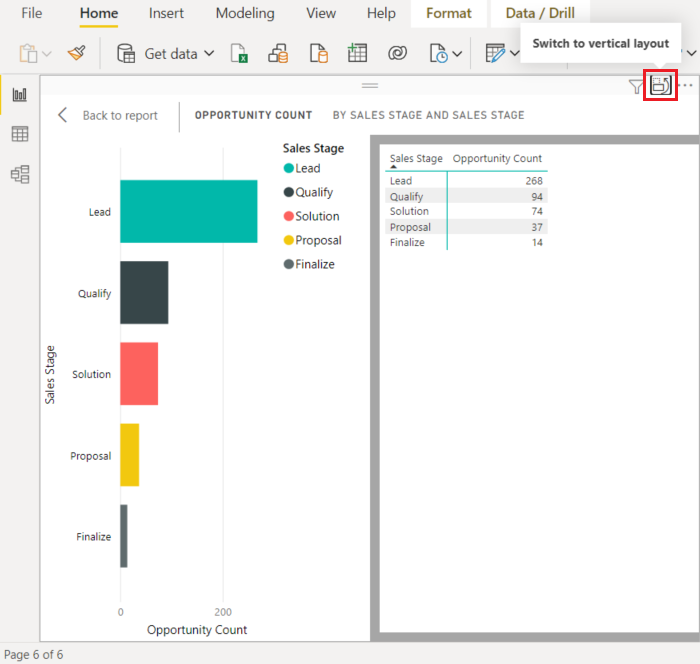
To change the orientation, select the Switch to vertical layout icon in the top-right corner of the visualization.
To export the data to a .csv file, select the ellipses and choose Export data.
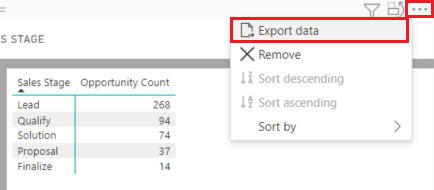
For more information on exporting the data to Excel, see Export data from Power BI visualizations.
Select Back to report to return to the canvas.
Using Show records
You can also focus on one data record in a visualization, and drill into the details behind it. For more information, see Use Visual table and Data point table in Power BI.
Considerations and troubleshooting
- If the Data point table button in the ribbon is disabled and grayed-out, it means the selected visualization doesn't support it.
Related content
More questions? Try the Power BI Community
Feedback
Coming soon: Throughout 2024 we will be phasing out GitHub Issues as the feedback mechanism for content and replacing it with a new feedback system. For more information see: https://aka.ms/ContentUserFeedback.
Submit and view feedback for