View analytics for cloud flows
Environment admins can access analytics for Power Automate in the Microsoft Power Platform admin center. The reports provide insights into runs, usage, errors, types of flows created, shared flows, and details on connectors associated with all the different flow types like automated flows, button flows, scheduled flows, approval flows, business process flows. These reports do not offer insights for desktop flows. To access these reports:
- Go to the navigation bar on the left side.
- Select Analytics.
- Select Microsoft Power Automate.
- View the reports on the right side.
Who can view these reports?
Admins with the following roles and a license can view the reports in Power Automate analytics:
- Environment Admin - can view reports for the environments that the admin has access to.
- Power Platform admin – can view reports for all environments.
- Dynamics 365 admin - can view reports for all environments.
- Microsoft 365 Global admin – can view reports for all environments.
For more information on the different roles for managing your tenant across the platform, see Use service admin roles to manage your tenant.
Data storage
When a user creates an environment in a region, the environment is hosted in that region. All data for that environment resides within that region for a maximum period of 28 days.
The data refresh cycle is about 24 hours and you can find the last refresh time at the top right corner of the page.
What are the available reports?
The following tenant-level reports are available for tenant and environment admins. The reports within the Runs, Usage, Created, and Errors tabs provide insights for Cloud flows and Desktop flows. By default, you see reports for the last viewed environment.
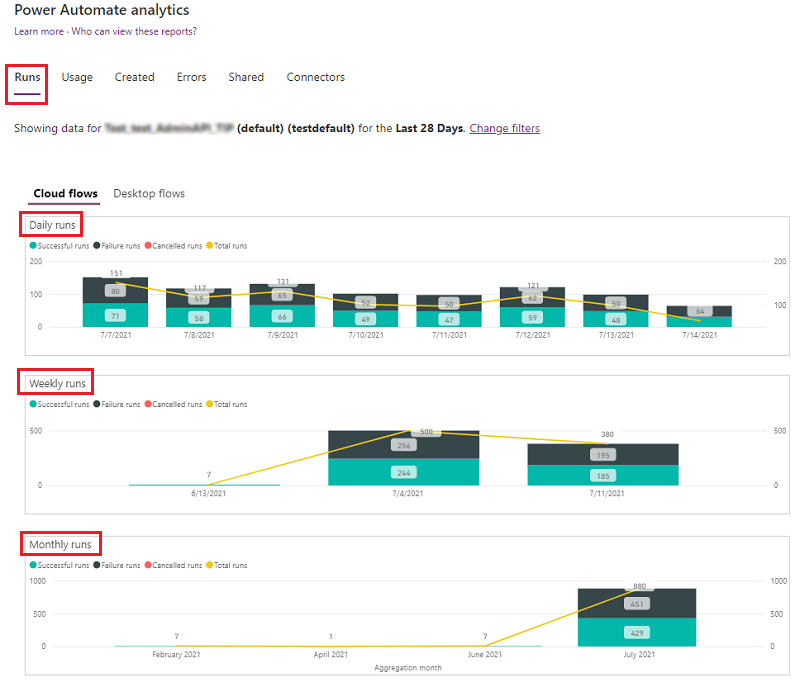
Runs report
By default, you see the Runs report. It provides a view into the daily, weekly, and monthly run data of all flows in an environment.
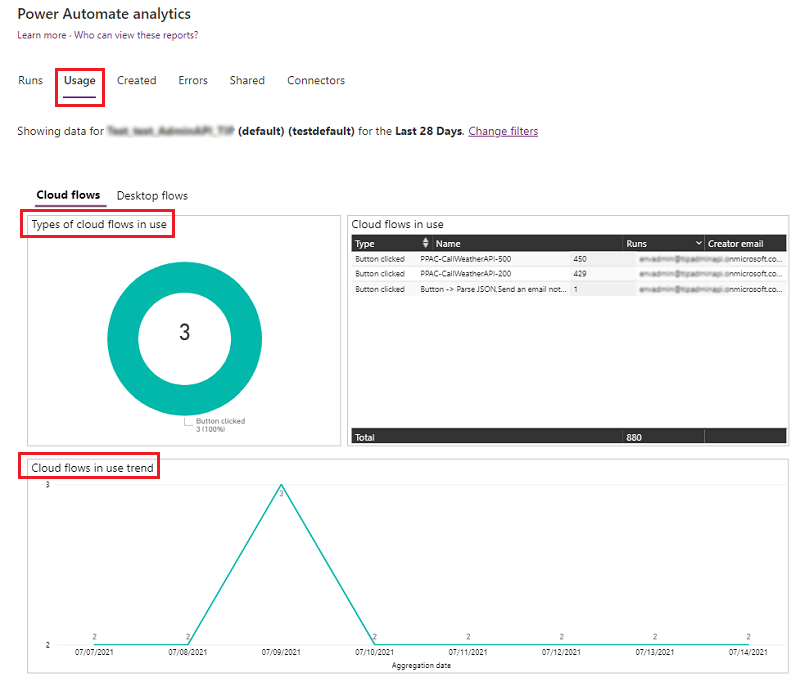
Usage report
This report provides insights into the different types of flows in use, the trends, and the flow creator's names.
Created report
This report provides insights into the types of flows created, trends, and details like the created date and the creator's email address.

Error report
This report provides insights into recurring error types and details like the error count, creator's email address, last occurred time, and the creator's email address for each flow.

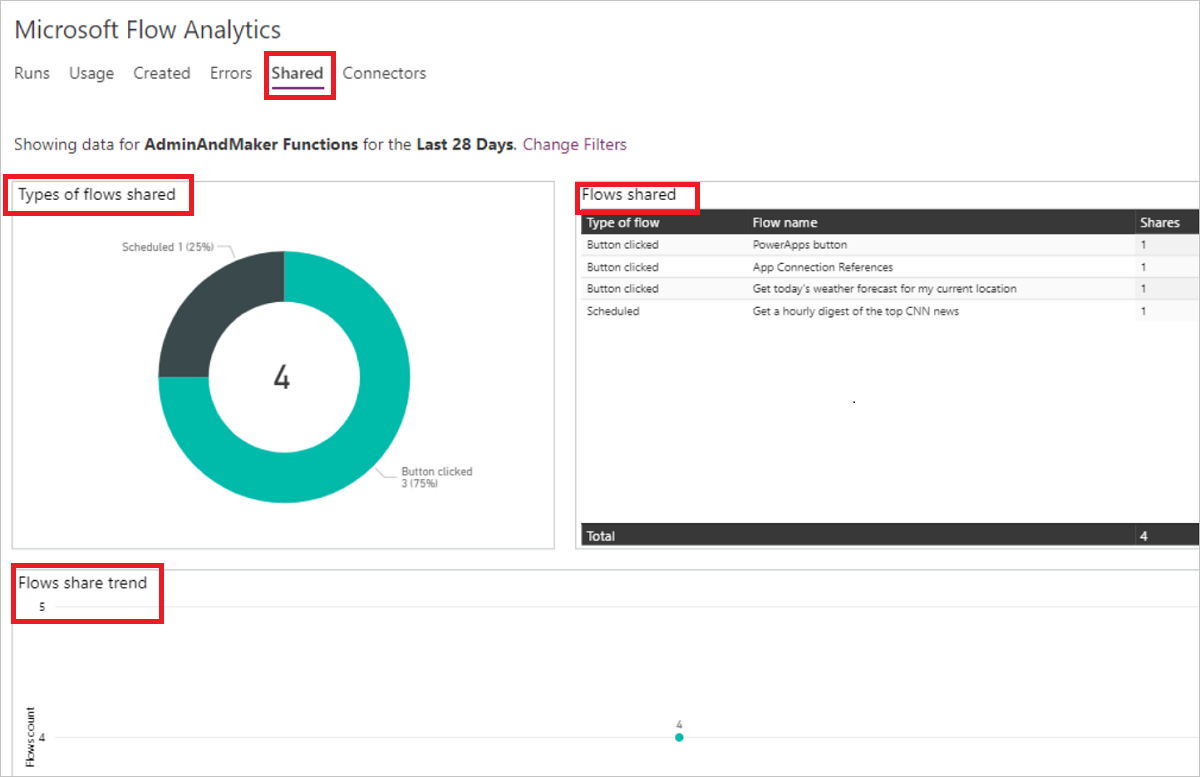
Shared report
This report provides details on the flows shared and trends in the environment.
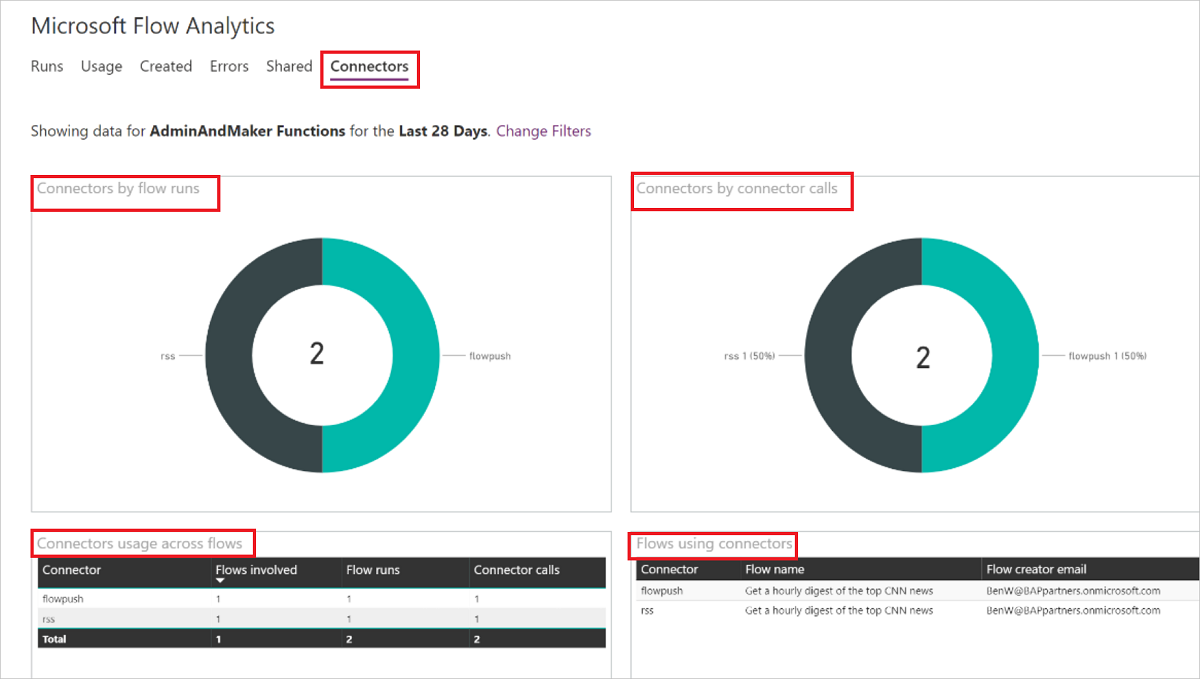
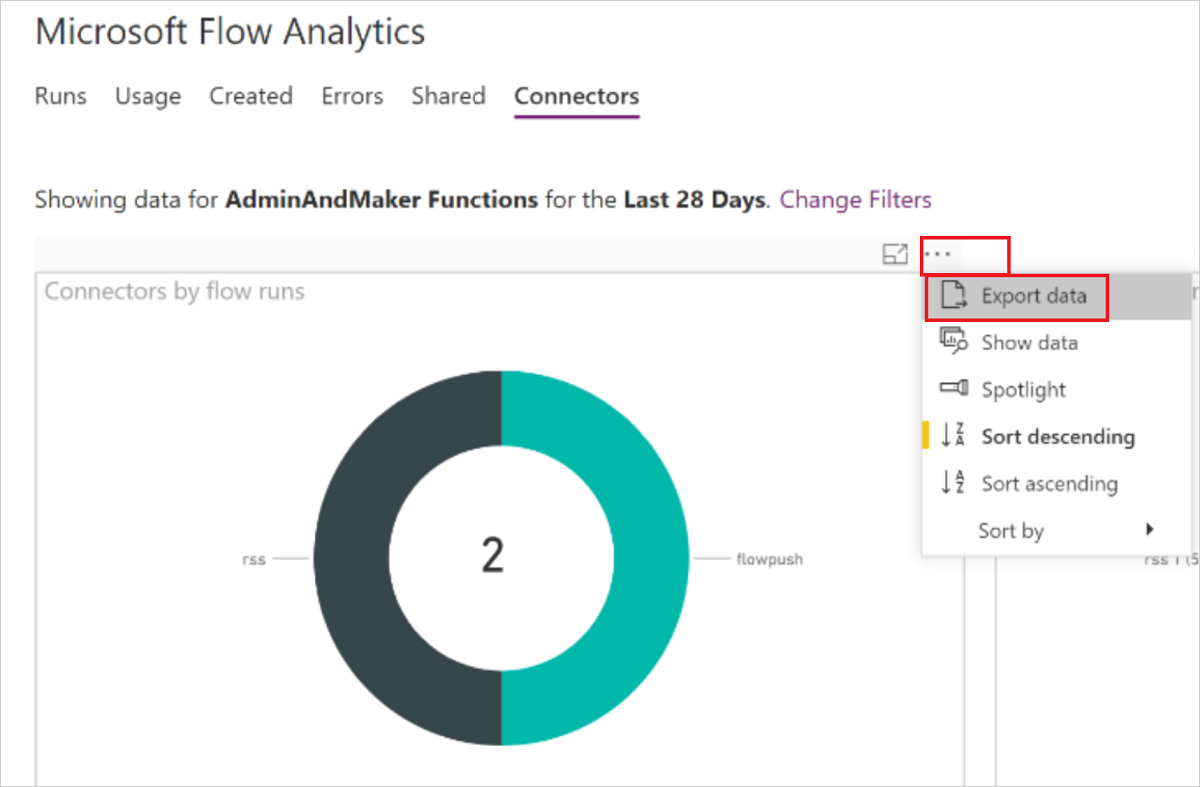
Connectors report
This report provides details on connectors and their associated flows. Metrics like the number of calls from each flow per connector, flow runs, and the flow creator's email address are available for both standard and custom connectors.
Download reports
The reports are built with Power BI. Users can select the ellipsis (…) for a KPI and then select Export data.
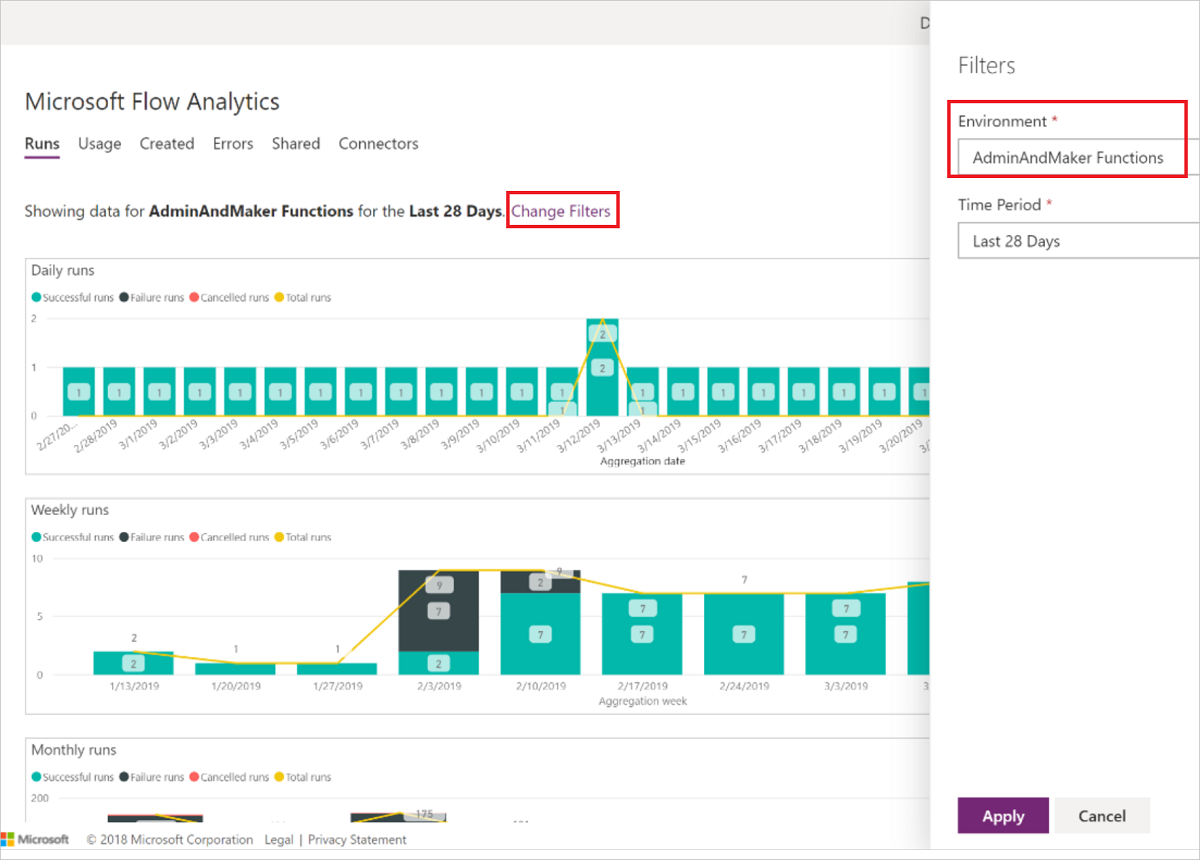
View reports in other environments
To view reports in another environment:
- Select Change Filters.
- Select the new environment from the Environment list and optionally, select a Time Period.
- Select Apply.
Feedback
Coming soon: Throughout 2024 we will be phasing out GitHub Issues as the feedback mechanism for content and replacing it with a new feedback system. For more information see: https://aka.ms/ContentUserFeedback.
Submit and view feedback for