Describe Azure Monitor
Azure Monitor is a platform for collecting data on your resources, analyzing that data, visualizing the information, and even acting on the results. Azure Monitor can monitor Azure resources, your on-premises resources, and even multi-cloud resources like virtual machines hosted with a different cloud provider.
The following diagram illustrates just how comprehensive Azure Monitor is:

On the left is a list of the sources of logging and metric data that can be collected at every layer in your application architecture, from application to operating system and network.
In the center, the logging and metric data are stored in central repositories.
On the right, the data is used in several ways. You can view real-time and historical performance across each layer of your architecture or aggregated and detailed information. The data is displayed at different levels for different audiences. You can view high-level reports on the Azure Monitor Dashboard or create custom views by using Power BI and Kusto queries.
Additionally, you can use the data to help you react to critical events in real time, through alerts delivered to teams via SMS, email, and so on. Or you can use thresholds to trigger autoscaling functionality to scale to meet the demand.
Azure Log Analytics
Azure Log Analytics is the tool in the Azure portal where you’ll write and run log queries on the data gathered by Azure Monitor. Log Analytics is a robust tool that supports both simple, complex queries, and data analysis. You can write a simple query that returns a set of records and then use features of Log Analytics to sort, filter, and analyze the records. You can write an advanced query to perform statistical analysis and visualize the results in a chart to identify a particular trend. Whether you work with the results of your queries interactively or use them with other Azure Monitor features such as log query alerts or workbooks, Log Analytics is the tool that you're going to use to write and test those queries.
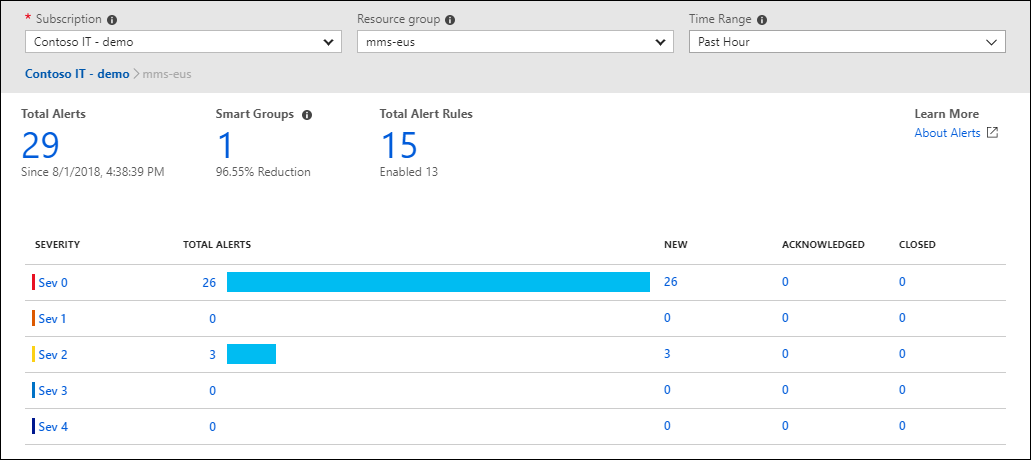
Azure Monitor Alerts
Azure Monitor Alerts are an automated way to stay informed when Azure Monitor detects a threshold being crossed. You set the alert conditions, the notification actions, and then Azure Monitor Alerts notifies when an alert is triggered. Depending on your configuration, Azure Monitor Alerts can also attempt corrective action.
Alerts can be set up to monitor the logs and trigger on certain log events, or they can be set to monitor metrics and trigger when certain metrics are crossed. For example, you could set a metric-based alert up to notify you when the CPU usage on a virtual machine exceeded 80%. Alert rules based on metrics provide near real time alerts based on numeric values. Rules based on logs allow for complex logic across data from multiple sources.
Azure Monitor Alerts use action groups to configure who to notify and what action to take. An action group is simply a collection of notification and action preferences that you associate with one or multiple alerts. Azure Monitor, Service Health, and Azure Advisor all use actions groups to notify you when an alert has been triggered.
Application Insights
Application Insights, an Azure Monitor feature, monitors your web applications. Application Insights is capable of monitoring applications that are running in Azure, on-premises, or in a different cloud environment.
There are two ways to configure Application Insights to help monitor your application. You can either install an SDK in your application, or you can use the Application Insights agent. The Application Insights agent is supported in C#.NET, VB.NET, Java, JavaScript, Node.js, and Python.
Once Application Insights is up and running, you can use it to monitor a broad array of information, such as:
- Request rates, response times, and failure rates
- Dependency rates, response times, and failure rates, to show whether external services are slowing down performance
- Page views and load performance reported by users' browsers
- AJAX calls from web pages, including rates, response times, and failure rates
- User and session counts
- Performance counters from Windows or Linux server machines, such as CPU, memory, and network usage
Not only does Application Insights help you monitor the performance of your application, but you can also configure it to periodically send synthetic requests to your application, allowing you to check the status and monitor your application even during periods of low activity.