Use coordinator metadata tables and views to understand data distribution
Woodgrove Bank has asked you to review and optimize query execution for the distributed tables in their Azure Cosmos DB for PostgreSQL database. You can query Metadata tables residing on the coordinator node to view detailed information about the nodes and shards in your distributed database. You can use these tables to gain insights into your database's structure, node utilization, data distribution, and performance.
The coordinator maintains these tables and uses them to track statistics and information about the health and location of shards across nodes. These tables, prefixed with pg_dist_*, contain diverse metadata about your distributed database and the coordinator uses them when building query execution plans across the worker nodes.
This unit highlights a few of the tables below, but you can view the complete list of metadata tables, learn more about them, and view their schemas by reading the System tables and views documentation.
Find the distribution column for a distributed table
Each distributed table has a distribution column. When you're ingesting data and writing queries against your database, it's essential to know which column it is. For instance, when you're joining or filtering tables, you may see error messages with hints like "add a filter to the distribution column."
You can use the distributed tables view, named citus_tables, on the coordinator node to view the distribution column name, along with other details about each distributed table in your database.
Here's an example using the payment_events table from Woodgrove Bank's contactless-payment app:
SELECT table_name, distribution_column, table_size FROM citus_tables WHERE table_name = 'payment_events'::regclass;
   table_name   | distribution_column | table_size
----------------+---------------------+------------
 payment_events | user_id             | 5256 kB
This citus_tables view also provides other helpful information, such as the shard count, size, and type of each distributed table.
Discover information about the nodes in your cluster
Information about worker nodes in the cluster is contained in the worker node table, pg_dist_node. To view information about the nodes in Woodgrove Bank's cluster, you can run the following command:
-- Turn on extended display to pivot results of wide tables
\x
The \x command pivots wide query results to avoid horizontal scrolling and poorly formatted output.
-- Retrieve node information
SELECT * FROM pg_dist_node;
-[ RECORD 1 ]----+-----------------------------------------------------------------
nodeid           | 2
groupid          | 2
nodename         | private-w1.learn-cosmosdb-postgresql.postgres.database.azure.com
nodeport         | 5432
noderack         | default
hasmetadata      | t
isactive         | t
noderole         | primary
nodecluster      | default
metadatasynced   | t
shouldhaveshards | t
-[ RECORD 2 ]----+-----------------------------------------------------------------
nodeid           | 3
groupid          | 3
nodename         | private-w0.learn-cosmosdb-postgresql.postgres.database.azure.com
nodeport         | 5432
noderack         | default
hasmetadata      | t
isactive         | t
noderole         | primary
nodecluster      | default
metadatasynced   | t
shouldhaveshards | t
-[ RECORD 3 ]----+-----------------------------------------------------------------
nodeid           | 4
groupid          | 0
nodename         | private-c.learn-cosmosdb-postgresql.postgres.database.azure.com
nodeport         | 5432
noderack         | default
hasmetadata      | t
isactive         | t
noderole         | primary
nodecluster      | default
metadatasynced   | t
shouldhaveshards | f
Reviewing the query output reveals details, including the ID, name, and port associated with each node. In addition, you can see if the node is active and should contain shards, among other bits of information. You can use node names and port numbers for connecting directly to workers, which is a common practice when tuning query performance.
Inspect data skew to understand node utilization
The team at Woodgrove is concerned that over time the distribution of data in their database will become skewed, resulting in decreased query performance. They've asked you to provide them with a query that will allow them to quickly assess data skew, and a way to address it when identified.
Data skew refers to how evenly data is distributed across your worker nodes. Proper selection of distribution columns should result in relatively consistent utilization of storage and compute resources across worker nodes. Clusters run most efficiently when data is placed evenly across nodes and related data are colocated on the same workers. You can use the citus_shards view to query the data size on each shard. This query provides insight into how evenly data is distributed across shards.
Of the distributed tables associated with Woodgrove Bank's contactless payment app, the most likely to become skewed over time is the payment_events table. The merchants and users tables are distributed on their primary keys, so those tables will always have one row per distribution column. They should remain evenly distributed as new records are added. On the other hand, the events table could potentially see an uneven number of rows entered for each user_id, which is the distribution column you selected. If some users submit many more events than others, it will result in some shards containing larger amounts of data than others. When shard data sizes are different, it indicates you have data skew.
To view the data sizes in each shard of the payment_events table, you can use the following query:
SELECT shardid, shard_name, shard_size
FROM citus_shards
WHERE table_name = 'payment_events'::regclass
LIMIT 10;
 shardid |      shard_name       | shard_size
---------+-----------------------+------------
  102232 | payment_events_102232 |     770048
  102233 | payment_events_102233 |     614400
  102234 | payment_events_102234 |     647168
  102235 | payment_events_102235 |     622592
  102236 | payment_events_102236 |     638976
  102237 | payment_events_102237 |     638976
  102238 | payment_events_102238 |     598016
  102239 | payment_events_102239 |     622592
  102240 | payment_events_102240 |     729088
  102241 | payment_events_102241 |     630784
The query's output lets you compare the size of each shard. When shards are of approximately equal size, as in the output for the previous payment_events table, you can infer that the worker nodes hold a roughly equal number of rows.
To minimize data skew, the distribution column you select should:
- Possess many distinct values greater than or equal to the number of shards (32 by default).
- Have a similar number of rows associated with each unique value.
Any table and distribution column choice where either property fails to meet these criteria will result in data skew. When you have data skew, it can result in less performant queries, as some worker nodes will have to perform more work than others, and parallelized queries won't operate as efficiently.
Fix data skew with the Shard rebalancer
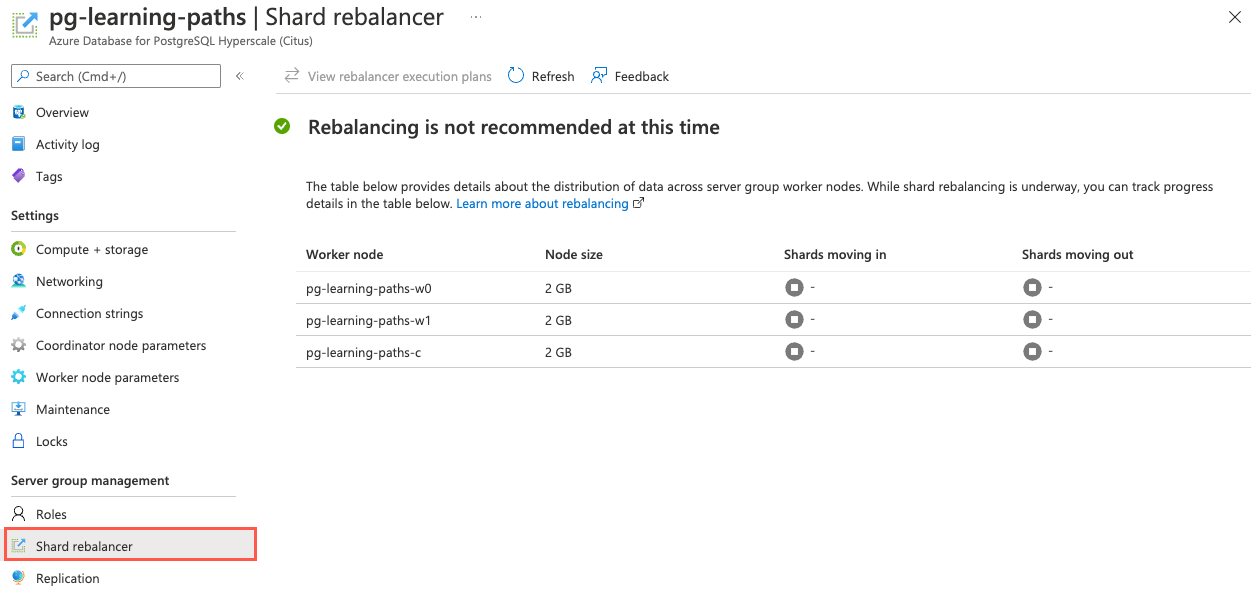
To provide a code-free method of assessing data skew to Woodgrove Bank, you can recommend they use the Azure portal to see whether data is distributed equally between worker nodes in the cluster. In the Azure portal, select the Shard rebalancer item from the left-hand navigation menu.
If data is skewed between workers, you'll see the message Rebalancing is recommended and a list of the size of each node. Otherwise, you'll see the message Rebalancing is not recommended at this time.
If data skew is found, you can start the Shard rebalancer by connecting to the coordinator node of the cluster and running the rebalance_table_shards SQL function on distributed tables.
The function rebalances all tables in the colocation group of the table named in its argument. You don't have to call the function for every distributed table. Instead, call it on a representative table from each colocation group.
For example, running the following against the payment_events table will also rebalance the payment_users table, as they're colocated.
SELECT rebalance_table_shards('payment_events');
You can then monitor the progress of the rebalancer from the Azure portal, where you'll see a message that Rebalancing is underway, along with details about the number of shards moving into or out of a node and progress per database table.
Identify shard placements
Azure Cosmos DB for PostgreSQL assigns each row to a shard based on the value of the distribution column you specified. Every row will be in precisely one shard, and every shard can contain multiple rows. You can use the pg_dist_placement table to view details of shard placements.
The shard placement table tracks the location of shard replicas on worker nodes. Each replica of a shard assigned to a specific node is called a shard placement. This table also stores information about the health and location of each shard placement. Determining which worker node has the rows for a specific distribution column can be helpful in many cases.
Suppose Woodgrove Bank has asked you to find which worker node holds the data for user_id 5 in the contactless payment application. In other words, you want to identify the placement of the shard containing rows whose distribution column has a value of 5:
SELECT shardid, nodename, placementid
FROM pg_dist_placement AS p,
     pg_dist_node AS n
WHERE p.groupid = n.groupid
AND n.noderole = 'primary'
AND shardid = (
  SELECT get_shard_id_for_distribution_column('payment_users', 5)
);
The query returns the shardid containing the data for the user_id with a value of 5.
 shardid |                         nodename                                 | placementid
---------+------------------------------------------------------------------+-------------
  102014 | private-w0.learn-cosmosdb-postgresql.postgres.database.azure.com |           7
Useful diagnostic queries
In addition to the metadata tables and views, there are many useful diagnostic queries that are beneficial for understanding how your database is performing and troubleshooting issues.
Active queries
The citus_stat_activity view shows which queries are currently executing. You can filter to find the actively executing ones, along with the process ID of their backend:
SELECT pid, query, state
FROM citus_stat_activity
WHERE state != 'idle';
Learn why queries are waiting
You can also query the most common reasons non-idle queries are waiting. To explain the reasons, check the PostgreSQL documentation.
SELECT wait_event || ':' || wait_event_type AS type, count(*) AS number_of_occurrences
FROM pg_stat_activity
WHERE state != 'idle'
GROUP BY wait_event, wait_event_type
ORDER BY number_of_occurrences DESC;
View distributed query activity
The Microsoft docs provide many examples of how metadata views can be used to watch queries and locks throughout the cluster. Read the Distributed query activity documentation to learn more about how you can use these views to better understand distributed queries in your database.