Exercise - Query coordinator metadata tables to understand data distribution
In this exercise, you use the Azure portal and metadata tables on the coordinator node to examine how tables are distributed across worker nodes in the cluster.
Important
This exercise relies on the Azure Cosmos DB for PostgreSQL database and distributed tables created in Unit 3 of this module.
Connect to the database using psql in the Azure Cloud Shell
Navigate to your Azure Cosmos DB for PostgreSQL resource in the Azure portal.
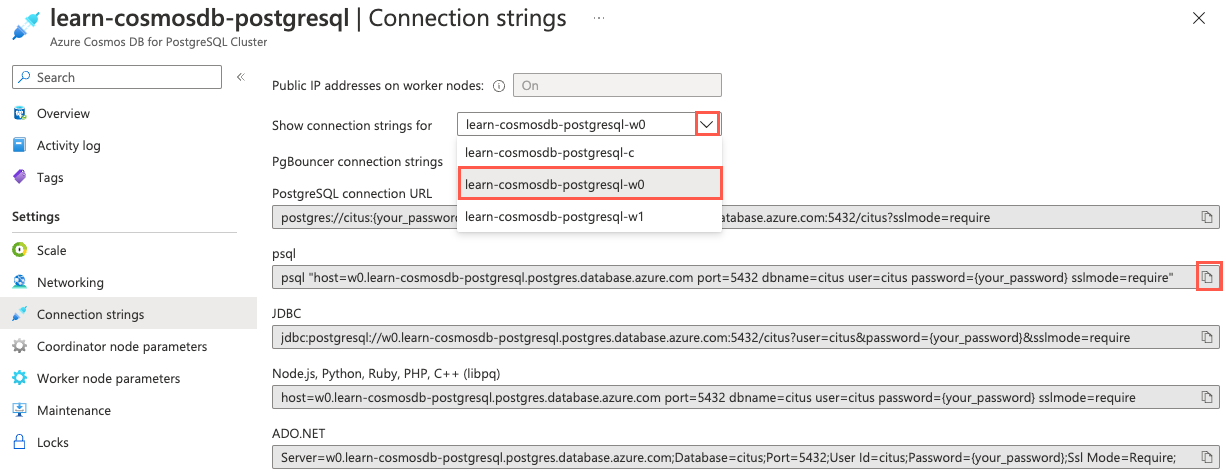
From the left-hand navigation menu, select Connection strings under Settings and copy the connection string labeled psql.
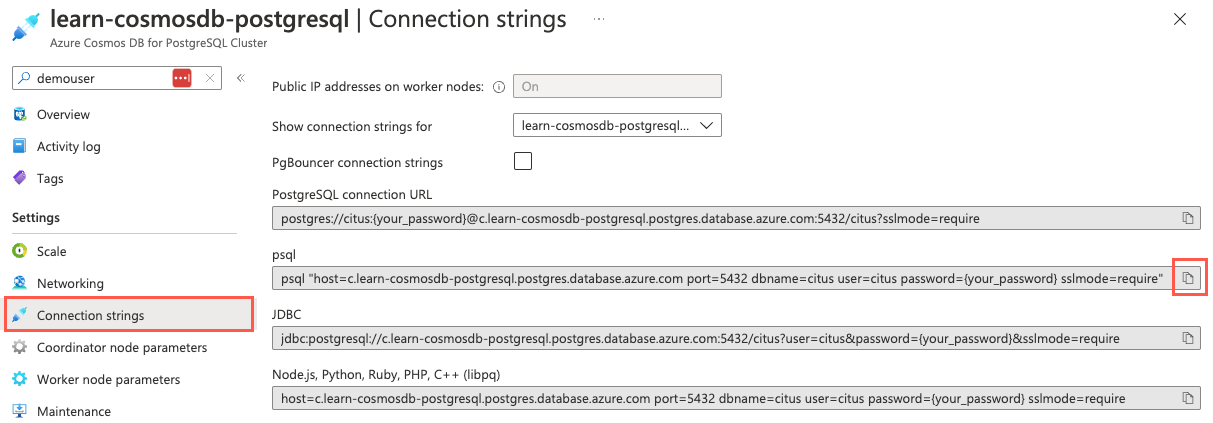
Paste the connection string into a text editor, such as Notepad.exe, and replace the
{your_password}token with the password you assigned to thecitususer when creating your cluster. Copy the updated connection string for use below.From the Connection strings page in the Azure portal, open an Azure Cloud Shell dialog by selecting the Cloud Shell icon on the toolbar in the Azure portal.
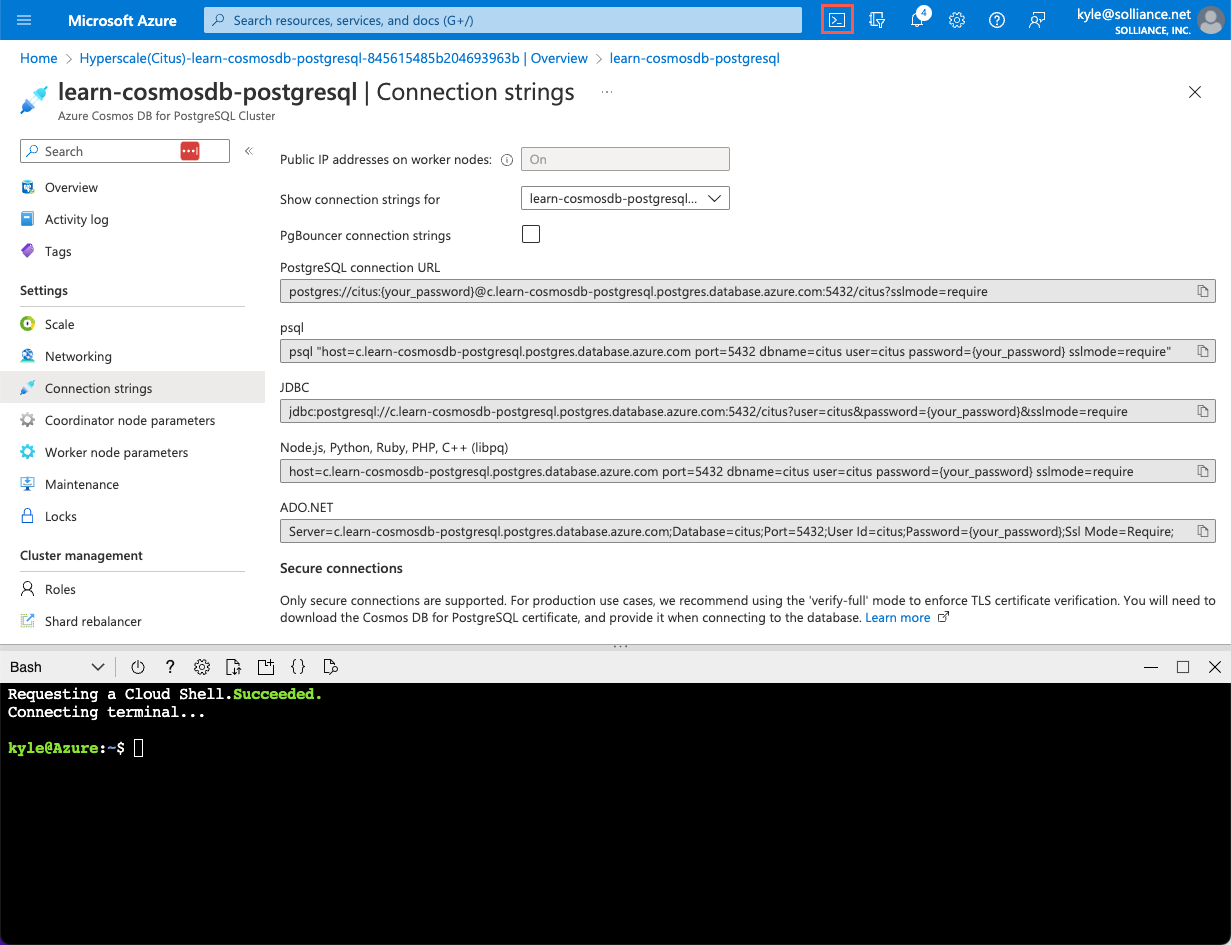
The Cloud Shell will open as an embedded panel at the bottom of your browser window.
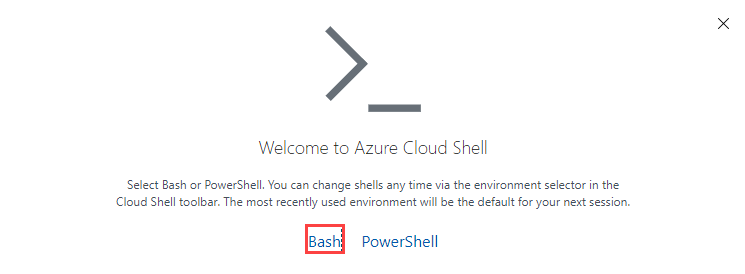
If necessary, select Bash as the environment in the Cloud Shell window.
Now, use the
psqlcommand-line utility to connect to your database. Paste your updated connection string (the one containing your correct password) at the prompt in the Cloud Shell, and then run the command, which should look similar to the following command:psql "host=c.learn-cosmosdb-postgresql.postgres.database.azure.com port=5432 dbname=citus user=citus password=P@ssword.123! sslmode=require"
Examine the nodes in your cluster
While provisioning the database in Unit 3, you instructed Azure to create a cluster with two worker nodes and a coordinator node. You can use a few methods to view details about the nodes in the cluster.
First, you can use the Azure portal. In the Azure portal panel of your browser window, select Overview from the left-hand navigation menu.
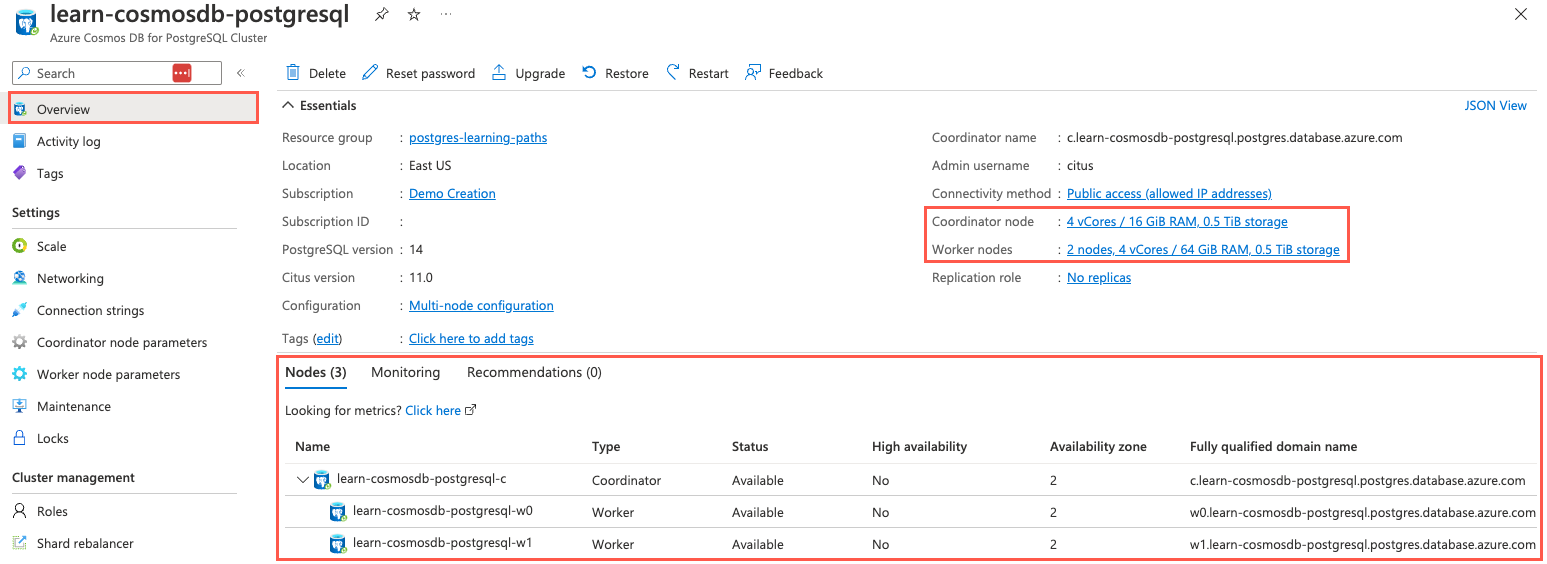
On the Overview page, the sizes of the coordinator and worker nodes are highlighted in the Essentials area, and the Nodes tab, where more details about each node are displayed, is highlighted.
The Azure portal provides high-level details about nodes in the cluster. The Essentials area of the Overview page provides details about the sizes of the coordinator and worker nodes. Selecting either of these panes will take you to the Scale page, where you can change the configuration of your cluster.
In addition, the Nodes tab below the Essentials area shows a breakdown of the nodes, with worker nodes appearing below the coordinator node. Here, you can view the status of your nodes and the availability zone and fully qualified domain name for each.
Next, use
psqlin the Cloud Shell to examine your nodes. In the Cloud Shell panel at the bottom of your browser window, run the following query against the worker node (pg_dist_node) metadata table to look at more detailed node information:SELECT * FROM pg_dist_node;If the width of your browser window is more narrow than the query results, it can result in rows wrapping and make it difficult to view. To provide a cleaner view, run this SQL command to enable the expanded display, which pivots wide query results:
\xNow, execute the same query as above against the
pg_dist_nodetable:SELECT * FROM pg_dist_node;The
\xcommand provides a cleaner view of the results for inspection:-[ RECORD 1 ]----+----------------------------------------------------------------- nodeid | 2 groupid | 2 nodename | private-w1.learn-cosmosdb-postgresql.postgres.database.azure.com nodeport | 5432 noderack | default hasmetadata | t isactive | t noderole | primary nodecluster | default metadatasynced | t shouldhaveshards | t -[ RECORD 2 ]----+----------------------------------------------------------------- nodeid | 3 groupid | 3 nodename | private-w0.learn-cosmosdb-postgresql.postgres.database.azure.com nodeport | 5432 noderack | default hasmetadata | t isactive | t noderole | primary nodecluster | default metadatasynced | t shouldhaveshards | t -[ RECORD 3 ]----+----------------------------------------------------------------- nodeid | 4 groupid | 0 nodename | private-c.learn-cosmosdb-postgresql.postgres.database.azure.com nodeport | 5432 noderack | default hasmetadata | t isactive | t noderole | primary nodecluster | default metadatasynced | t shouldhaveshards | fQuerying the worker node metadata table provides you with much more information about cluster nodes than you can see in the Azure portal. Node names and port numbers can be used for connecting directly to nodes, which is a common practice when performing query optimization. Alternatively, you can retrieve connection strings for each node in your cluster from the Azure Cosmos DB for PostgreSQL resource's Connection strings page in the Azure portal. On the Connection strings page, you can select the desired node from the Show connection strings for drop-down list, and then copy the appropriate connection string, which you can then use to directly connect to individual nodes.
Inspect table distribution
To look at how the tables are distributed across shards, you can use the citus_tables view.
Execute the following query against the
citus_tablesview to learn more about the tables in the Woodgrove database:SELECT * FROM citus_tables;-[ RECORD 1 ]-------+------------------ table_name | payment_events citus_table_type | distributed distribution_column | user_id colocation_id | 1 table_size | 26 MB shard_count | 32 table_owner | citus access_method | heap -[ RECORD 2 ]-------+------------------ table_name | payment_merchants citus_table_type | reference distribution_column | <none> colocation_id | 2 table_size | 18 MB shard_count | 1 table_owner | citus access_method | heap -[ RECORD 3 ]-------+------------------ table_name | payment_users citus_table_type | distributed distribution_column | user_id colocation_id | 1 table_size | 44 MB shard_count | 32 table_owner | citus access_method | heapFrom the results, you can see that each distributed table is spread across 32 shards, while the
payment_merchantsreference table is on a single shard. You can also see the size of each table, which can help you decide when to define a table as a reference table instead of a distributed table. While there are no set guidelines about the size limits of a reference table, it's important to pay attention to sizes, because larger tables aren't good candidates for defining as reference tables. Based on the smaller size of thepayment_merchanttable, it will work as a reference table. However, you should beware of trying it for tables that might get too large.Next, look at a few records from the shard table,
pg_dist_shard, to view information about the individual shards of thepayment_eventstable. First, disable the expanded display using the\xcommand.\xSELECT * FROM pg_dist_shard WHERE logicalrelid = 'payment_events'::regclass LIMIT 5;logicalrelid | shardid | shardstorage | shardminvalue | shardmaxvalue ----------------+---------+--------------+---------------+--------------- payment_events | 102232 | t | -2147483648 | -2013265921 payment_events | 102233 | t | -2013265920 | -1879048193 payment_events | 102234 | t | -1879048192 | -1744830465 payment_events | 102235 | t | -1744830464 | -1610612737 payment_events | 102236 | t | -1610612736 | -1476395009The
pg_dist_shardtable provides information about individual shards, including the shard hash range, which the coordinator uses to determine the correct shard to and from which data should be written and read.
Inspect the distribution of data
Now, look at how the event data was distributed across shards by querying the citus_shards view.
Run this SQL query to look at the data sizes of the first 10 shards for the
payment_eventstable:SELECT shardid, shard_name, shard_size FROM citus_shards WHERE table_name = 'payment_users'::regclass LIMIT 10;You should see results that look similar to the following output:
 shardid |      shard_name       | shard_size
---------+-----------------------+------------
  102040 | payment_events_102040 |     770048
  102041 | payment_events_102041 |     614400
  102042 | payment_events_102042 |     647168
  102043 | payment_events_102043 |     622592
  102044 | payment_events_102044 |     638976
  102045 | payment_events_102045 |     638976
  102046 | payment_events_102046 |     598016
  102047 | payment_events_102047 |     622592
  102048 | payment_events_102048 |     729088
  102049 | payment_events_102049 |     630784
Notice that while some of the shards are the same size, there's some variability in data sizes. These differences occur because the number of events for each unique
user_idisn't perfectly equal.To determine whether these differences are skewed enough to require running the Shard rebalancer, navigate to your Azure Cosmos DB for PostgreSQL instance in the Azure portal, and select Shard rebalancer from the left-hand navigation menu.
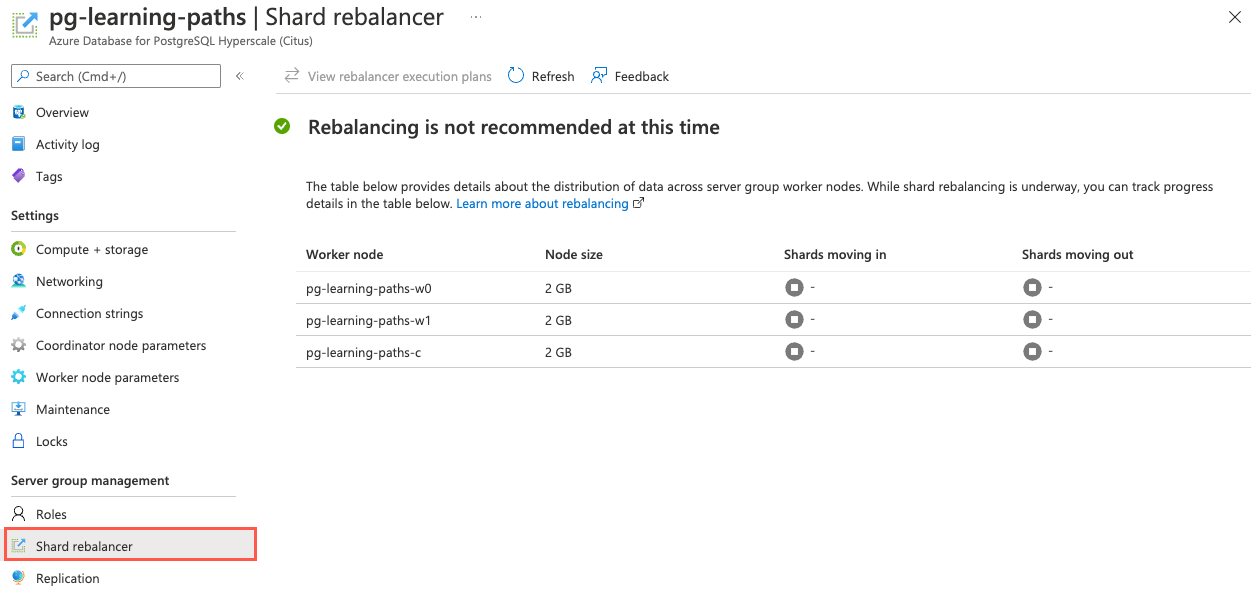
Based on the Rebalancing is not recommended at this time message displayed, the minor differences in shard data sizes aren't yet something that requires rebalancing the shards in your cluster.
In this exercise, you used the Azure portal and queries against coordinator metadata tables and views to discover detailed information about your distributed database.
In the Cloud Shell, run the following command to disconnect from your database:
\qYou can keep the Cloud Shell open and move on to Unit 6: Understand distributed query execution.