Understand distributed query execution
Before optimizing query performance for Woodgrove Bank, you must understand how distributed queries are run in Azure Cosmos DB for PostgreSQL. You must also understand the server parameters you can use to tune query execution. Every cluster consists of a single coordinator node and multiple worker nodes. This architecture enables compute, memory, and storage to scale across numerous PostgreSQL servers in the cloud but also adds complexity to query execution.

The diagram also features arrows on the right and left, showing how you can add more nodes to scale out.
The coordinator uses a query-processing pipeline consisting of a distributed query planner and a distributed query executor. For each query issued to the cluster, the coordinator consults the metadata tables to build an execution plan and then passes that plan to the executor for execution.
Understand distributed-query execution planning
The distributed-query planner on the coordinator takes every query issued to the cluster and generates the plan for distributed execution. This plan is then parallelized across worker nodes. Optimizations are applied to ensure queries are executed in a scalable manner and that network I/O is minimized.
For queries containing a WHERE clause filtering for a specific distribution column value, the coordinator uses metadata tables to determine which shard to route the query to by hashing the distribution column of the row or rows involved in the query. These queries will only hit one shard, so the planning process is slightly different.
Once the execution planner has identified the correct shard or shards, it rewrites the query plan to reference shard tables instead of the original table. Shard tables combine the original table name with the shardid. For example, suppose you issue an UPDATE query against Woodgrove Bank's payment_events table, and it's determined that shard 102104 contains the row to update. In that case, the query against the payment_events table will be rewritten to target payment_events_102027 instead of payment_events.
The planner breaks the query into a coordinator query (which runs on the coordinator) and worker query fragments (which run on individual shards). Query fragments are assigned to workers to allow their resources to be used efficiently.

The query fragment modify the table name in the original query to add an underscore followed by the shard ID. The query fragments are then sent to the worker nodes for execution.
The final step is for the coordinator to pass the distributed query plan on to the distributed executor for execution.
What is the distributed query executor?
Azure Cosmos DB for PostgreSQL uses a distributed-query executor to split up regular SQL queries and run them in parallel on worker nodes close to the data. The distributed-query executor is responsible for running distributed-query plans and handling any failures.
The distributed-query executor is optimized for getting fast responses to queries involving filters, aggregations, and colocated joins and running single-tenant queries with full SQL coverage. Executing multi-shard queries requires balancing the gains from parallelism with the overhead of managing database connections. The query executor creates a connection pool for each session, opens one connection per shard to the workers as needed, and sends all fragment queries to them. It then fetches the results from each fragment query, merges them, and sends the final results back to the user.

In the diagram, query sessions are fragmented by the coordinator node and added to a task queue. Query fragments are then sent to session connection pools for execution on worker nodes.
Use EXPLAIN to understand query execution
The coordinator partitions an incoming query into fragment queries and sends them to the workers for parallel processing. The workers are just PostgreSQL servers, and they apply PostgreSQL's standard planning and execution logic for these queries. To understand better how execution plans are generated and executed, you can use the EXPLAIN command.
EXPLAIN can help you gain insights into query performance and view information about query execution planning. The EXPLAIN output shows how each worker processes the query and provides some details about how the coordinator node combines their results.
For their dashboard, Woodgrove Bank would like a query that allows them to view the number of events by type per user, which they can also filter on the event_type. The following example explains the plan for the query you created. You can also see the actual queries sent to the worker nodes by including the VERBOSE flag.
EXPLAIN VERBOSE
  SELECT e.user_id, login, event_type, COUNT(event_id) AS event_count
  FROM payment_events AS e
  LEFT JOIN payment_users AS u ON e.user_id = u.user_id
  WHERE event_type = 'GiftFunds'
  GROUP BY e.user_id, login, event_type
  ORDER BY event_count DESC
  LIMIT 10;
The output from the EXPLAIN VERBOSE statement provides details about how the query is executed across nodes that you can use to optimize the query using server parameters as follows:
Limit  (cost=2160.96..2160.99 rows=10 width=80)
   Output: remote_scan.user_id, remote_scan.login, remote_scan.event_type, remote_scan.event_count
   ->  Sort  (cost=2160.96..2410.96 rows=100000 width=80)
         Output: remote_scan.user_id, remote_scan.login, remote_scan.event_type, remote_scan.event_count
         Sort Key: remote_scan.event_count DESC
         ->  Custom Scan (Citus Adaptive)  (cost=0.00..0.00 rows=100000 width=80)
               Output: remote_scan.user_id, remote_scan.login, remote_scan.event_type, remote_scan.event_count
               Task Count: 32
               Tasks Shown: One of 32
               ->  Task
                     Query: SELECT worker_column_1 AS user_id, worker_column_2 AS login, worker_column_3 AS event_type, count(worker_column_4) AS event_count FROM (SELECT e.user_id AS worker_column_1, u.login AS worker_column_2, e.event_
type AS worker_column_3, e.event_id AS worker_column_4 FROM (public.payment_events_102232 e LEFT JOIN public.payment_users_102264 u ON ((e.user_id OPERATOR(pg_catalog.=) u.user_id))) WHERE (e.event_type OPERATOR(pg_catalog.=) 'GiftFunds'
::text)) worker_subquery GROUP BY worker_column_1, worker_column_2, worker_column_3 ORDER BY (count(worker_column_4)) DESC LIMIT '10'::bigint
                     Node: host=private-w0.learn-cosmosdb-postgresql.postgres.database.azure.com port=5432 dbname=citus
                     ->  Limit  (cost=498.14..498.16 rows=10 width=37)
                           Output: e.user_id, u.login, e.event_type, (count(e.event_id))
                           ->  Sort  (cost=498.14..498.88 rows=298 width=37)
                                 Output: e.user_id, u.login, e.event_type, (count(e.event_id))
                                 Sort Key: (count(e.event_id)) DESC
                                 ->  HashAggregate  (cost=488.72..491.70 rows=298 width=37)
                                       Output: e.user_id, u.login, e.event_type, count(e.event_id)
                                       Group Key: e.user_id, u.login, e.event_type
                                       ->  Hash Left Join  (cost=334.93..485.74 rows=298 width=37)
                                             Output: e.user_id, u.login, e.event_type, e.event_id
                                             Inner Unique: true
                                             Hash Cond: (e.user_id = u.user_id)
                                             ->  Seq Scan on public.payment_events_102232 e  (cost=0.00..150.03 rows=298 width=27)
                                                   Output: e.event_id, e.event_type, e.user_id, e.merchant_id, e.event_details, e.created_at
                                                   Filter: (e.event_type = 'GiftFunds'::text)
                                             ->  Hash  (cost=231.08..231.08 rows=8308 width=18)
                                                   Output: u.login, u.user_id
                                                   ->  Seq Scan on public.payment_users_102264 u  (cost=0.00..231.08 rows=8308 width=18)
                                                         Output: u.login, u.user_id
The EXPLAIN statement's output reveals several things about the query execution plan. Starting with the custom scan line, you can see the planner chose the Citus Adaptive executor to run this query. The task count reveals that there are 32 shards, and you're viewing one of the 32 tasks in the output.
->  Custom Scan (Citus Adaptive)  (cost=0.00..0.00 rows=100000 width=80)
      Output: remote_scan.user_id, remote_scan.login, remote_scan.event_type, remote_scan.event_count
      Task Count: 32
      Tasks Shown: One of 32
Next, EXPLAIN selects one of the workers and shows a representative example of how the query behaves on the worker nodes. It indicates the worker node (host, port, and database name) and includes the query fragment executed by the worker:
->  Task
      Query: SELECT worker_column_1 AS user_id, worker_column_2 AS login, worker_column_3 AS event_type, count(worker_column_4) AS event_count FROM (SELECT e.user_id AS worker_column_1, u.login AS worker_column_2, e.event_ type AS worker_column_3, e.event_id AS worker_column_4 FROM (public.payment_events_102232 e LEFT JOIN public.payment_users_102264 u ON ((e.user_id OPERATOR(pg_catalog.=) u.user_id))) WHERE (e.event_type OPERATOR(pg_catalog.=) 'GiftFunds'::text)) worker_subquery GROUP BY worker_column_1, worker_column_2, worker_column_3 ORDER BY (count(worker_column_4)) DESC LIMIT '10'::bigint
      Node: host=private-w0.learn-cosmosdb-postgresql.postgres.database.azure.com port=5432 dbname=citus
After the worker node details, you can view the results of running a standard PostgreSQL EXPLAIN command on that worker for the fragment query:
->  Limit  (cost=498.14..498.16 rows=10 width=37)
      Output: e.user_id, u.login, e.event_type, (count(e.event_id))
      ->  Sort  (cost=498.14..498.88 rows=298 width=37)
            Output: e.user_id, u.login, e.event_type, (count(e.event_id))
            Sort Key: (count(e.event_id)) DESC
            ->  HashAggregate  (cost=488.72..491.70 rows=298 width=37)
                  Output: e.user_id, u.login, e.event_type, count(e.event_id)
                  Group Key: e.user_id, u.login, e.event_type
                  ->  Hash Left Join  (cost=334.93..485.74 rows=298 width=37)
                        Output: e.user_id, u.login, e.event_type, e.event_id
                        Inner Unique: true
                        Hash Cond: (e.user_id = u.user_id)
                        ->  Seq Scan on public.payment_events_102232 e  (cost=0.00..150.03 rows=298 width=27)
                              Output: e.event_id, e.event_type, e.user_id, e.merchant_id, e.event_details, e.created_at
                              Filter: (e.event_type = 'GiftFunds'::text)
                        ->  Hash  (cost=231.08..231.08 rows=8308 width=18)
                              Output: u.login, u.user_id
                              ->  Seq Scan on public.payment_users_102264 u  (cost=0.00..231.08 rows=8308 width=18)
                                    Output: u.login, u.user_id
Data movement for subquery execution
Azure Cosmos DB for PostgreSQL can also gather results from subqueries and common table expressions (CTEs) into the coordinator node and then push them back across workers for use by an outer query. This capability provides support for a greater variety of SQL constructs.
To learn more about how you can use the EXPLAIN statement to view queries with distributed subplans, review the Citus Query Processing documentation.
Achieve maximum query performance by tuning server parameters
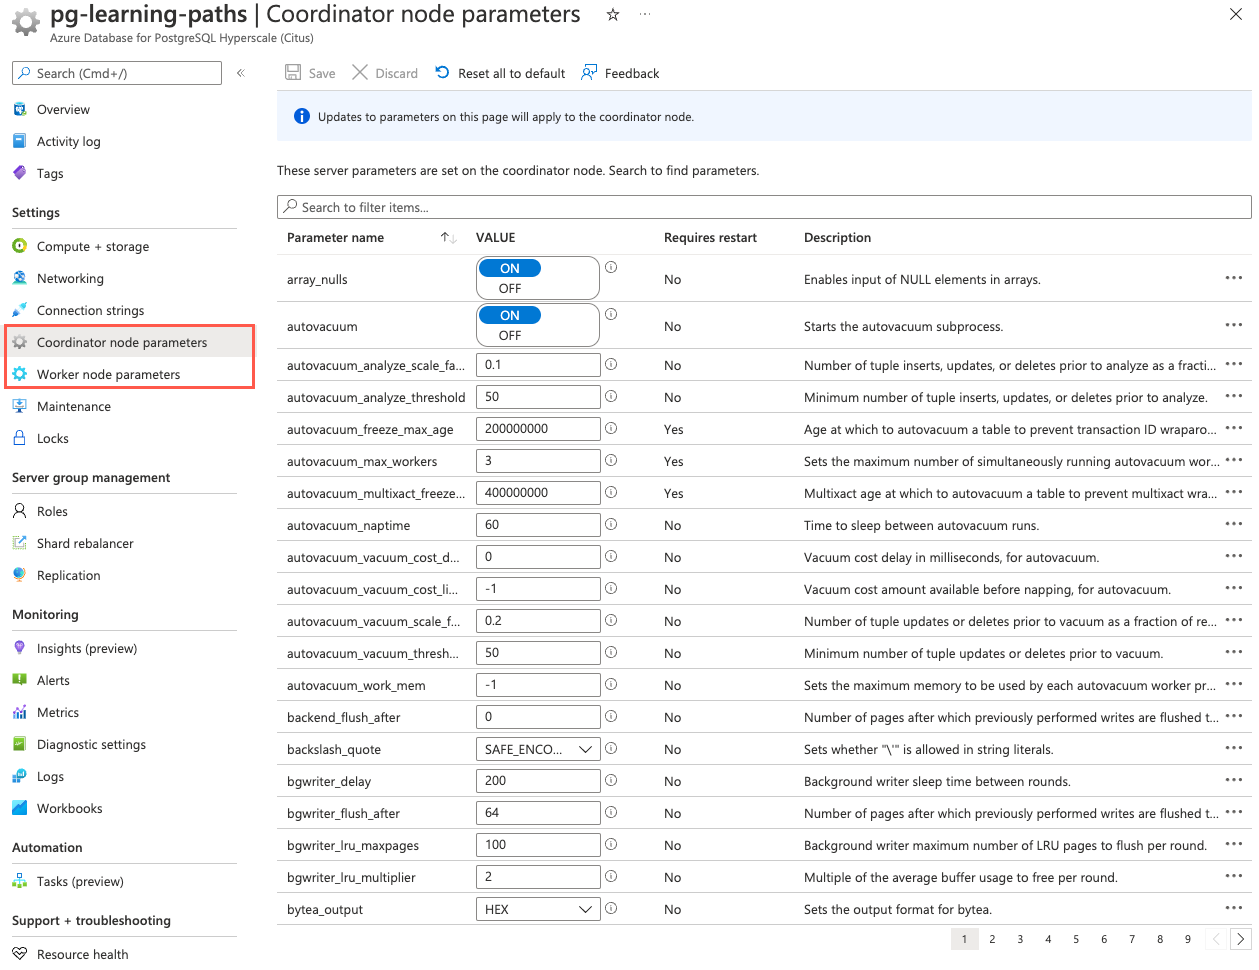
Various server parameters affect the behavior of your database. You can use these parameters to tune your cluster to achieve maximum performance. You can manipulate the values of server parameters using SQL statements or in the Azure portal. Under the Settings category, choose Worker node parameters or Coordinator node parameters. These pages allow you to set parameters for all worker nodes or just for the coordinator node.
You can find detailed information about all the available server parameters in the server parameters documentation. The Azure Cosmos DB for PostgreSQL API documentation also provides logical groupings of server parameters by function.
The first step in the tuning process is to run the EXPLAIN command from the coordinator node on representative queries to inspect their performance. The information you derive from EXPLAIN can help you understand what parameters to tune. Adjusting worker node parameters is usually the place to start when attempting to optimize query performance. You can change parameter values on worker nodes either by using the Worker node parameters page in the Azure portal or by connecting directly to the worker node using the worker's fully qualified domain name and port.
Note
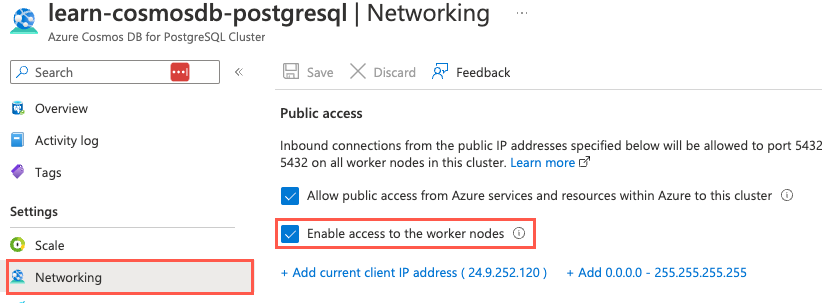
Connecting directly to worker nodes requires you to select the Enable access to the worker nodes checkbox on the Networking page of your Azure Cosmos DB for PostgreSQL resource in the Azure portal.
Tuning server parameters requires experimentation and often requires multiple attempts to achieve acceptable performance. As you make changes, run EXPLAIN again from the coordinator or directly on the worker to evaluate the effect of the modification. As a general recommendation, it's best to iteratively tune your database using only a tiny portion of your data. Once you've adjusted a worker to achieve the desired performance, you must manually apply those changes to the other workers in the cluster.
Clusters within Azure Cosmos DB for PostgreSQL are configured with conservative resource settings by default. Among these settings, shared_buffers and work_mem are probably the most critical parameters in optimizing read performance. These parameters are briefly discussed below. Apart from these settings, several other configuration parameters can affect query performance. You can learn about these settings in more detail in the Microsoft documentation.
Optimize read performance
The shared_buffers PostgreSQL parameter sets the amount of memory allocated to the database for caching data. The default value for this setting is 128 MB. If you have a worker node with 1 GB or more RAM, a reasonable starting value for shared_buffers is 25% of the system's memory. There are some workloads where even larger settings for shared_buffers are advantageous. However, given that Azure Cosmos DB for PostgreSQL also relies on the operating system cache, it's unlikely you'll find that using more than 25% of RAM provides extra performance benefits.
Increase working memory
If your common query patterns include many complex sorts, increasing work_mem allows the database to perform larger in-memory sorts, which is faster than disk-based equivalents. The work_mem parameter sets the amount of memory used by internal sort operations and hash tables before writing to temporary disk files. If you have high disk I/O activity on your worker node despite having a reasonable amount of memory, increasing work_mem to a higher value can be beneficial. Increasing work_mem will help generate more efficient query plans and allow more operations to occur in memory.
In addition to the shared_buffers and work_mem parameter settings, the query execution planner relies on statistical information about the contents of tables to generate good plans. These statistics are collected when ANALYZE is run. This functionality is enabled by default.
Tune connection management
The number of simultaneous connections that can be opened by individual queries is restricted by the citus.max_adaptive_executor_pool_size (integer) server parameter. The default value for that setting is 16, but it's configurable at the session level for priority management. You should set citus.max_adaptive_executor_pool_size (integer) to a low value, like 1 or 2, for transactional workloads with short-running queries (for example, < 20 ms of latency). Leave this setting at its default value for analytical workloads where parallelism is critical.
It's faster to execute tasks sequentially over the same connection for short tasks rather than establishing new connections to run in parallel. Long-running tasks, on the other hand, benefit from more immediate parallelism. To balance the needs of both short and long-running tasks, Azure Cosmos DB for PostgreSQL uses the citus.executor_slow_start_interval (integer) parameter. That setting specifies a delay between connection attempts for the tasks in a multi-shard query. When a query first queues tasks, the tasks can acquire just one connection. At the end of each interval where there are pending connections, the coordinator increases the number of simultaneous open connections. You should set citus.executor_slow_start_interval (integer) to a high value like 100 ms for transactional workloads comprised of short queries bound on network latency rather than parallelism. For analytical workloads, leave this setting at its default value of 10 ms. You can also disable the slow start behavior entirely by setting its value to 0.
When a task finishes using a connection, the session pool keeps the connection open to speed up subsequent commands. Caching the connection avoids the overhead of connection reestablishment between coordinator and worker. However, each pool will hold no more than citus.max_cached_conns_per_worker (integer) idle connections open at once, to limit idle connection resource usage in the worker. Increasing this value reduces the latency of multi-shard queries but will also increase overhead on the workers. The default value of 1 for citus.max_cached_conns_per_worker (integer) is reasonable. A larger value such as 2 might be helpful for clusters that use a few concurrent sessions, but it isn't recommended to go much further (for example, 16 would be too high). If set too high, sessions unnecessarily hold idle connections and use worker resources.
Woodgrove Bank's database is used for both transactional and analytics workloads. The most effective way to tune connection parameters is to follow an iterative approach, modify parameter values, and observe the effect of the change. For each use case, you'll observe the effect that change has on the queries and you'll identify the settings that best suit their needs.