Debug using the Just-In-Time Debugger in Visual Studio
Applies to: ![]() Visual Studio
Visual Studio ![]() Visual Studio for Mac
Visual Studio for Mac
Note
This article applies to Visual Studio 2017. If you're looking for the latest Visual Studio documentation, see Visual Studio documentation. We recommend upgrading to the latest version of Visual Studio. Download it here
Just-In-Time debugging can launch Visual Studio automatically when an app running outside Visual Studio errors or crashes. With Just-In-Time debugging, you can test apps outside of Visual Studio, and open Visual Studio to begin debugging when a problem occurs.
Just-In-Time debugging works for Windows desktop apps. It does not work for Universal Windows Apps, or for managed code that is hosted in a native application, such as Visualizers.
Tip
If you just want to stop the Just-In-Time Debugger dialog box from appearing, but don't have Visual Studio installed, see Disable the Just-In-Time Debugger. If you once had Visual Studio installed, you may need to disable Just-In-Time debugging from the Windows registry.
Enable or disable Just-In-Time debugging in Visual Studio
Note
To enable or disable Just-In-Time debugging, you must be running Visual Studio as an administrator. Enabling or disabling Just-In-Time debugging sets a registry key, and administrator privileges may be required to change that key. To open Visual Studio as an administrator, right-click the Visual Studio app and choose Run as administrator.
You can configure Just-In-Time debugging from the Visual Studio Tools > Options (or Debug > Options) dialog box.
To enable or disable Just-In-Time debugging:
On the Tools or Debug menu, select Options > Debugging > Just-In-Time.

In the Enable Just-In-Time debugging for these types of code box, select the types of code you want Just-In-Time debugging to debug: Managed, Native, and/or Script.
Select OK.
If you enable the Just-In-Time debugger, but it doesn't open when an app crashes or errors, see Troubleshoot Just-In-Time debugging.
Disable Just-In-Time debugging from the Windows registry
Just-In-Time debugging may still be enabled even if Visual Studio is no longer installed on your computer. If Visual Studio is no longer installed, you can disable Just-In-Time debugging by editing the Windows registry.
To disable Just-In-Time debugging by editing the registry:
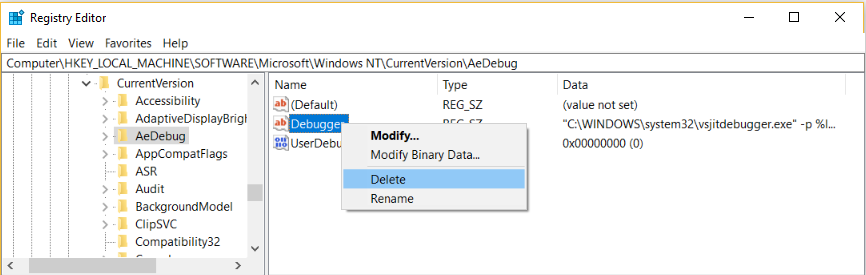
From the Windows Start menu, run the Registry Editor (regedit.exe).
In the Registry Editor window for 64-bit computers, locate and delete the following registry entries:
HKEY_LOCAL_MACHINE\SOFTWARE\Wow6432Node\Microsoft\.NETFramework\DbgManagedDebugger
HKEY_LOCAL_MACHINE\SOFTWARE\Wow6432Node\Microsoft\Windows NT\CurrentVersion\AeDebug\Debugger
If the following registry entries are present, or your computer is running a 32-bit operating system, delete the following entries:
HKEY_LOCAL_MACHINE\SOFTWARE\Microsoft\.NETFramework\DbgManagedDebugger
HKEY_LOCAL_MACHINE\SOFTWARE\Microsoft\Windows NT\CurrentVersion\AeDebug\Debugger
Make sure not to delete or change any other registry keys.
Close the Registry Editor window.
Enable Just-In-Time debugging of a Windows Form
By default, Windows Form apps have a top-level exception handler that lets the app keep running if it can recover. If a Windows Forms app throws an unhandled exception, it shows the following dialog:

To enable Just-In-Time debugging instead of standard Windows Form error handling, add these settings:
In the
system.windows.formssection of the machine.config or <app name>.exe.config file, set thejitDebuggingvalue totrue:<configuration> <system.windows.forms jitDebugging="true" /> </configuration>In a C++ Windows Form application, also set
DebuggableAttributetotruein a .config file or in your code. If you compile with /Zi and without /Og, the compiler sets this attribute for you. If you want to debug a non-optimized release build, however, you must setDebuggableAttributeby adding the following line in your app's AssemblyInfo.cpp file:[assembly:System::Diagnostics::DebuggableAttribute(true, true)];For more information, see DebuggableAttribute.
Use Just-In-Time debugging
This example walks you through Just-In-Time debugging when an app throws an error.
You must have Visual Studio installed to follow these steps. If you don't have Visual Studio, you can download the free Visual Studio Community Edition.
Make sure Just-In-Time debugging is enabled in Tools > Options > Debugging > Just-In-Time.
For this example, you'll make a C# console app in Visual Studio that throws a NullReferenceException.
In Visual Studio, create a C# console app (File > New > Project > Visual C# > Console Application) named ThrowsNullException. For more information about creating projects in Visual Studio, see Walkthrough: Create a simple application.
When the project opens in Visual Studio, open the Program.cs file. Replace the Main() method with the following code, which prints a line to the console and then throws a NullReferenceException:
static void Main(string[] args)
{
    Console.WriteLine("we will now throw a NullReferenceException");
    throw new NullReferenceException("this is the exception thrown by the console app");
}
To build the solution, choose either the Debug (default) or Release configuration, and then select Build > Rebuild Solution.
Note
- Choose Debug configuration for the full debugging experience.
- If you select Release configuration, you must turn off Just My Code for this procedure to work. Under Tools > Options > Debugging, deselect Enable Just My Code.
For more information about build configurations, see Understanding build configurations.
Open the built app ThrowsNullException.exe in your C# project folder (...\ThrowsNullException\ThrowsNullException\bin\Debug or ...\ThrowsNullException\ThrowsNullException\bin\Release).
You should see the following command window:
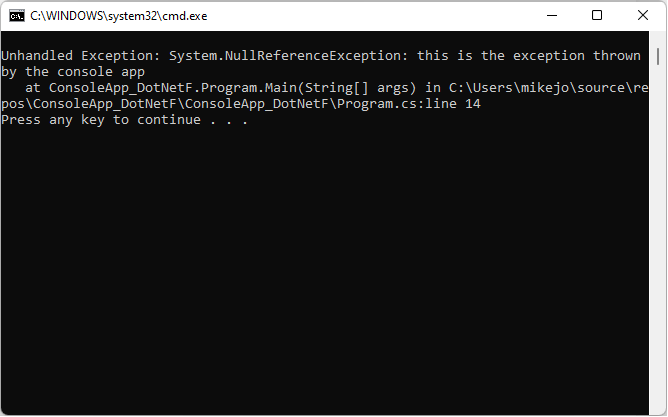
The Choose Just-In-Time Debugger dialog opens.
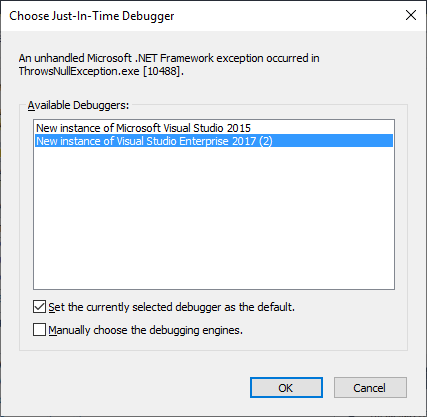
Under Available Debuggers, select New instance of <your preferred Visual Studio version/edition>, if not already selected.
Select OK.
The ThrowsNullException project opens in a new instance of Visual Studio, with execution stopped at the line that threw the exception:
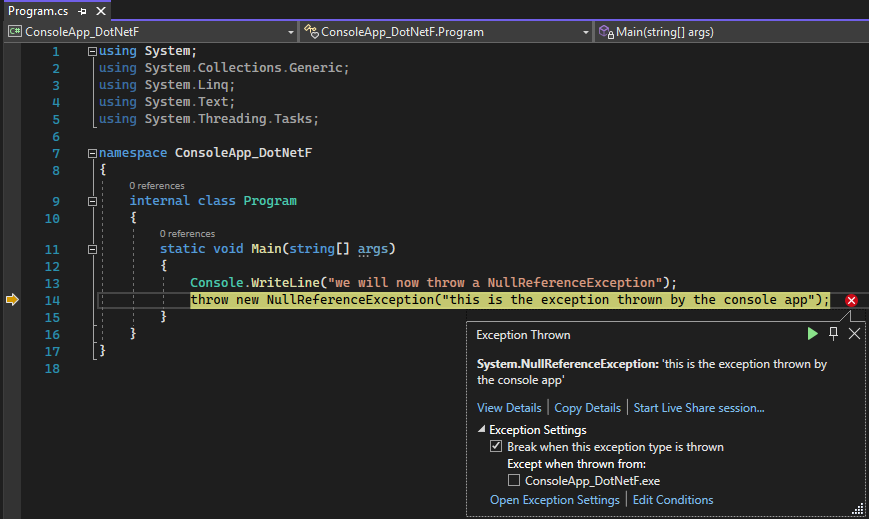
You can start debugging at this point. If you were debugging a real app, you would need to find out why the code is throwing the exception.
Caution
If your app contains untrusted code, a security warning dialog box appears, enabling you to decide whether to proceed with debugging. Before you continue debugging, decide whether you trust the code. Did you write the code yourself? If the application is running on a remote machine, do you recognize the name of the process? If the app is running locally, consider the possibility of malicious code running on your computer. If you decide the code is trustworthy, select OK. Otherwise, select Cancel.
Troubleshoot Just-In-Time debugging
If Just-In-Time debugging doesn't start when an app crashes, even though it is enabled in Visual Studio:
Windows Error Reporting could be taking over the error handling on your computer.
To fix this issue, use Registry Editor to add a DWORD Value of Disabled, with Value data of 1, to the following registry keys:
HKEY_LOCAL_MACHINE\Software\WOW6432Node\Microsoft\Windows\Windows Error Reporting
(For 32-bit machines) HKEY_LOCAL_MACHINE\Software\Microsoft\Windows\Windows Error Reporting
For more information, see .WER settings.
A known Windows issue may be causing the Just-In-Time debugger to fail.
The fix is to add a DWORD Value of Auto, with Value data of 1, to the following registry keys:
HKEY_LOCAL_MACHINE\Software\WOW6432Node\Microsoft\Windows NT\CurrentVersion\AeDebug
(For 32-bit machines) HKEY_LOCAL_MACHINE\SOFTWARE\Microsoft\Windows NT\CurrentVersion\AeDebug
You might see the following error messages during Just-In-Time debugging:
Unable to attach to the crashing process. The specified program is not a Windows or MS-DOS program.
The debugger tried to attach to a process running under another user.
To work around this problem, in Visual Studio, open Debug > Attach to Process (or press Ctrl + Alt + P), and find the process you want to debug in the Available Processes list. If you do not know the name of the process, find the Process ID in the Visual Studio Just-In-Time Debugger dialog. Select the process in the Available Processes list, and select Attach. Select No to dismiss the Just-In-Time debugger dialog.
Debugger could not be started because no user is logged on.
There is no user logged onto the console, so there is no user session to display the Just-In-Time debugging dialog.
To fix this problem, log onto the machine.
Class not registered.
The debugger tried to create a COM class that is not registered, probably due to an installation problem.
To fix this problem, use the Visual Studio Installer to reinstall or repair your Visual Studio installation.