Windows 仮想マシン (クラシック) についてゲスト OS メトリックを Azure Monitor メトリック データベースに送信する
注意
Azure を操作するには、Azure Az PowerShell モジュールを使用することをお勧めします。 作業を開始するには、Azure PowerShell のインストールに関する記事を参照してください。 Az PowerShell モジュールに移行する方法については、「AzureRM から Az への Azure PowerShell の移行」を参照してください。
Azure Monitor 診断拡張機能 ("WAD" または "診断" と呼ばれる) を使用すると、仮想マシン、クラウド サービス、または Service Fabric クラスターの一部として、ゲスト オペレーティング システム (ゲスト OS) からメトリックとログを収集できます。 拡張機能により、多くの異なる場所にテレメトリを送信できます。
この記事では、Windows 仮想マシン (クラシック) 用のゲスト OS のパフォーマンス メトリックを Azure Monitor メトリック データベースに送信するプロセスについて説明します。 診断拡張機能バージョン 1.11 以降、標準プラットフォーム メトリックが既に収集されている Azure Monitor メトリック ストアに、メトリックを直接書き込むことができます。
この場所にこれらを格納することで、プラットフォーム メトリックに対して実行するのと同じアクションにアクセスできます。 アクションには、ほぼリアルタイムのアラート、グラフ作成、ルーティング、REST API からのアクセスなどの機能があります。 これまで、診断拡張機能では、Azure Monitor データ ストアではなく Azure Storage に書き込んでいました。
この記事で説明するプロセスは、Windows オペレーティング システムが実行されているクラシック仮想マシンでのみ機能します。
前提条件
Azure サブスクリプションで、サービス管理者または共同管理者である必要があります。
サブスクリプションを Microsoft.Insights に登録する必要があります
Azure PowerShell または Azure Cloud Shell がインストールされている必要があります。
クラシック仮想マシンおよびストレージ アカウントを作成する
Azure portal を使用してクラシック VM を作成します。

この VM を作成しているときに、新しいクラシック ストレージ アカウントを作成するオプションを選択します。 このストレージ アカウントは後の手順で使用します。
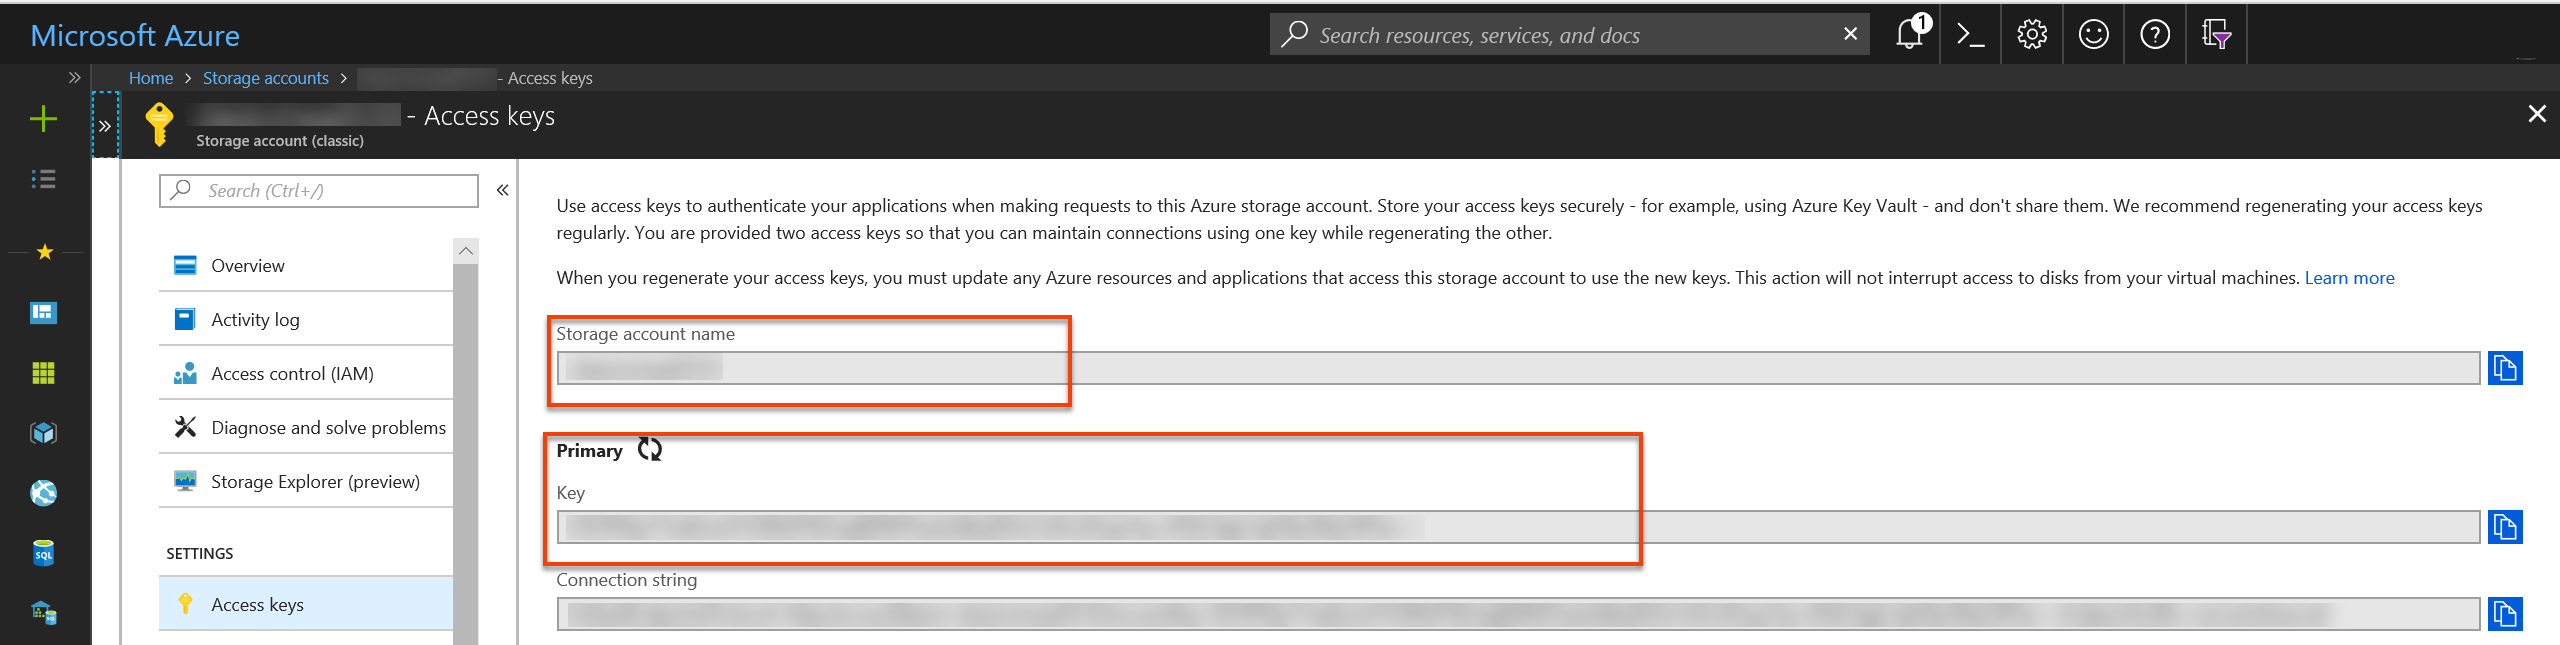
Azure portal で、ストレージ アカウントのリソース ペインに移動します。 [キー] を選択して、ストレージ アカウント名とストレージ アカウント キーをメモしておきます。 この情報は後の手順で必要になります。


サービス プリンシパルの作成
サービス プリンシパルの作成に関するページの手順を使って、お使いの Microsoft Entra テナントでサービス プリンシパルを作成します。 このプロセスを進める際には、次の点に注意してください。
- このアプリ用に新しいクライアント シークレットを作成します。
- 後の手順で使用するために、キーとクライアント ID を保存します。
このアプリに、メトリックを出力するリソースへの "監視メトリック パブリッシャー" アクセス許可を付与します。 リソース グループまたはサブスクリプション全体を使用できます。
Note
診断拡張機能では、サービス プリンシパルを使用して、Azure Monitor を認証し、クラシック VM 用のメトリックを発行します
診断拡張機能の構成の作成
診断拡張機能の構成ファイルを準備します。 このファイルにより、ご自身のクラシック VM について、診断拡張機能の収集対象のパフォーマンス カウンターとログが決まります。 たとえば次のようになります。
<?xml version="1.0" encoding="utf-8"?>
<DiagnosticsConfiguration xmlns="http://schemas.microsoft.com/ServiceHosting/2010/10/DiagnosticsConfiguration">
<PublicConfig xmlns="http://schemas.microsoft.com/ServiceHosting/2010/10/DiagnosticsConfiguration">
    <WadCfg>
    <DiagnosticMonitorConfiguration overallQuotaInMB="4096" sinks="applicationInsights.errors">
        <DiagnosticInfrastructureLogs scheduledTransferLogLevelFilter="Error" />
        <Directories scheduledTransferPeriod="PT1M">
            <IISLogs containerName="wad-iis-logfiles" />
            <FailedRequestLogs containerName="wad-failedrequestlogs" />
        </Directories>
        <PerformanceCounters scheduledTransferPeriod="PT1M">
            <PerformanceCounterConfiguration counterSpecifier="\Processor(*)\% Processor Time" sampleRate="PT15S" />
            <PerformanceCounterConfiguration counterSpecifier="\Memory\Available Bytes" sampleRate="PT15S" />
            <PerformanceCounterConfiguration counterSpecifier="\Memory\Committed Bytes" sampleRate="PT15S" />
            <PerformanceCounterConfiguration counterSpecifier="\Memory\% Committed Bytes" sampleRate="PT15S" />
            <PerformanceCounterConfiguration counterSpecifier="\LogicalDisk(*)\Disk Read Bytes/sec" sampleRate="PT15S" />
        </PerformanceCounters>
        <WindowsEventLog scheduledTransferPeriod="PT1M">
            <DataSource name="Application!*[System[(Level=1 or Level=2 or Level=3)]]" />
            <DataSource name="Windows Azure!*[System[(Level=1 or Level=2 or Level=3 or Level=4)]]" />
        </WindowsEventLog>
        <CrashDumps>
            <CrashDumpConfiguration processName="WaIISHost.exe" />
            <CrashDumpConfiguration processName="WaWorkerHost.exe" />
            <CrashDumpConfiguration processName="w3wp.exe" />
        </CrashDumps>
        <Logs scheduledTransferPeriod="PT1M" scheduledTransferLogLevelFilter="Error" />
        <Metrics resourceId="/subscriptions/xxxxxxxx-xxxx-xxxx-xxxx-xxxxxxxxxxxx/resourceGroups/MyResourceGroup/providers/Microsoft.ClassicCompute/virtualMachines/MyClassicVM">
            <MetricAggregation scheduledTransferPeriod="PT1M" />
            <MetricAggregation scheduledTransferPeriod="PT1H" />
        </Metrics>
    </DiagnosticMonitorConfiguration>
    <SinksConfig>
    </SinksConfig>
    </WadCfg>
    <StorageAccount />
</PublicConfig>
<PrivateConfig xmlns="http://schemas.microsoft.com/ServiceHosting/2010/10/DiagnosticsConfiguration">
    <StorageAccount name="" endpoint="" />
</PrivateConfig>
<IsEnabled>true</IsEnabled>
</DiagnosticsConfiguration>
診断ファイルの "SinksConfig" セクションで、新しい Azure Monitor シンクを次のように定義します。
<SinksConfig>
    <Sink name="AzMonSink">
        <AzureMonitor>
            <ResourceId>Provide the resource ID of your classic VM </ResourceId>
            <Region>The region your VM is deployed in</Region>
        </AzureMonitor>
    </Sink>
</SinksConfig>
収集対象のパフォーマンス カウンターの一覧が表示されている構成ファイルのセクションで、パフォーマンス カウンターを Azure Monitor シンク "AzMonSink" にルーティングします。
<PerformanceCounters scheduledTransferPeriod="PT1M" sinks="AzMonSink">
    <PerformanceCounterConfiguration counterSpecifier="\Processor(_Total)\% Processor Time" sampleRate="PT15S" />
...
</PerformanceCounters>
プライベート構成で、Azure Monitor アカウントを定義します。 その後、メトリックの出力に使用するサービス プリンシパル情報を追加します。
<PrivateConfig xmlns="http://schemas.microsoft.com/ServiceHosting/2010/10/DiagnosticsConfiguration">
<StorageAccount name="" endpoint="" />
    <AzureMonitorAccount>
        <ServicePrincipalMeta>
            <PrincipalId>clientId for your service principal</PrincipalId>
            <Secret>client secret of your service principal</Secret>
        </ServicePrincipalMeta>
    </AzureMonitorAccount>
</PrivateConfig>
このファイルをローカルに保存します。
診断拡張機能をクラウド サービスに配置する
PowerShell を起動して、サインインします。
Login-AzAccount最初に、お使いのクラシック VM にコンテキストを設定します。
$VM = Get-AzureVM -ServiceName <VM’s Service_Name> -Name <VM Name>VM で作成されたクラシック ストレージ アカウントのコンテキストを設定します。
$StorageContext = New-AzStorageContext -StorageAccountName <name of your storage account from earlier steps> -storageaccountkey "<storage account key from earlier steps>"次のコマンドを使用して、診断ファイルのパスを変数に設定します。
$diagconfig = “<path of the diagnostics configuration file with the Azure Monitor sink configured>”Azure Monitor シンクが構成されている診断ファイルを使って、クラシック VM への更新を準備します。
$VM_Update = Set-AzureVMDiagnosticsExtension -DiagnosticsConfigurationPath $diagconfig -VM $VM -StorageContext $Storage_Context次のコマンドを実行して、ご自身の VM に更新をデプロイします。
Update-AzureVM -ServiceName "ClassicVMWAD7216" -Name "ClassicVMWAD" -VM $VM_Update.VM
Note
診断拡張機能のインストールの一環として、引き続きストレージ アカウントを指定する必要があります。 診断構成ファイルで指定されたログやパフォーマンス カウンターは、指定したストレージ アカウントに書き込まれます。
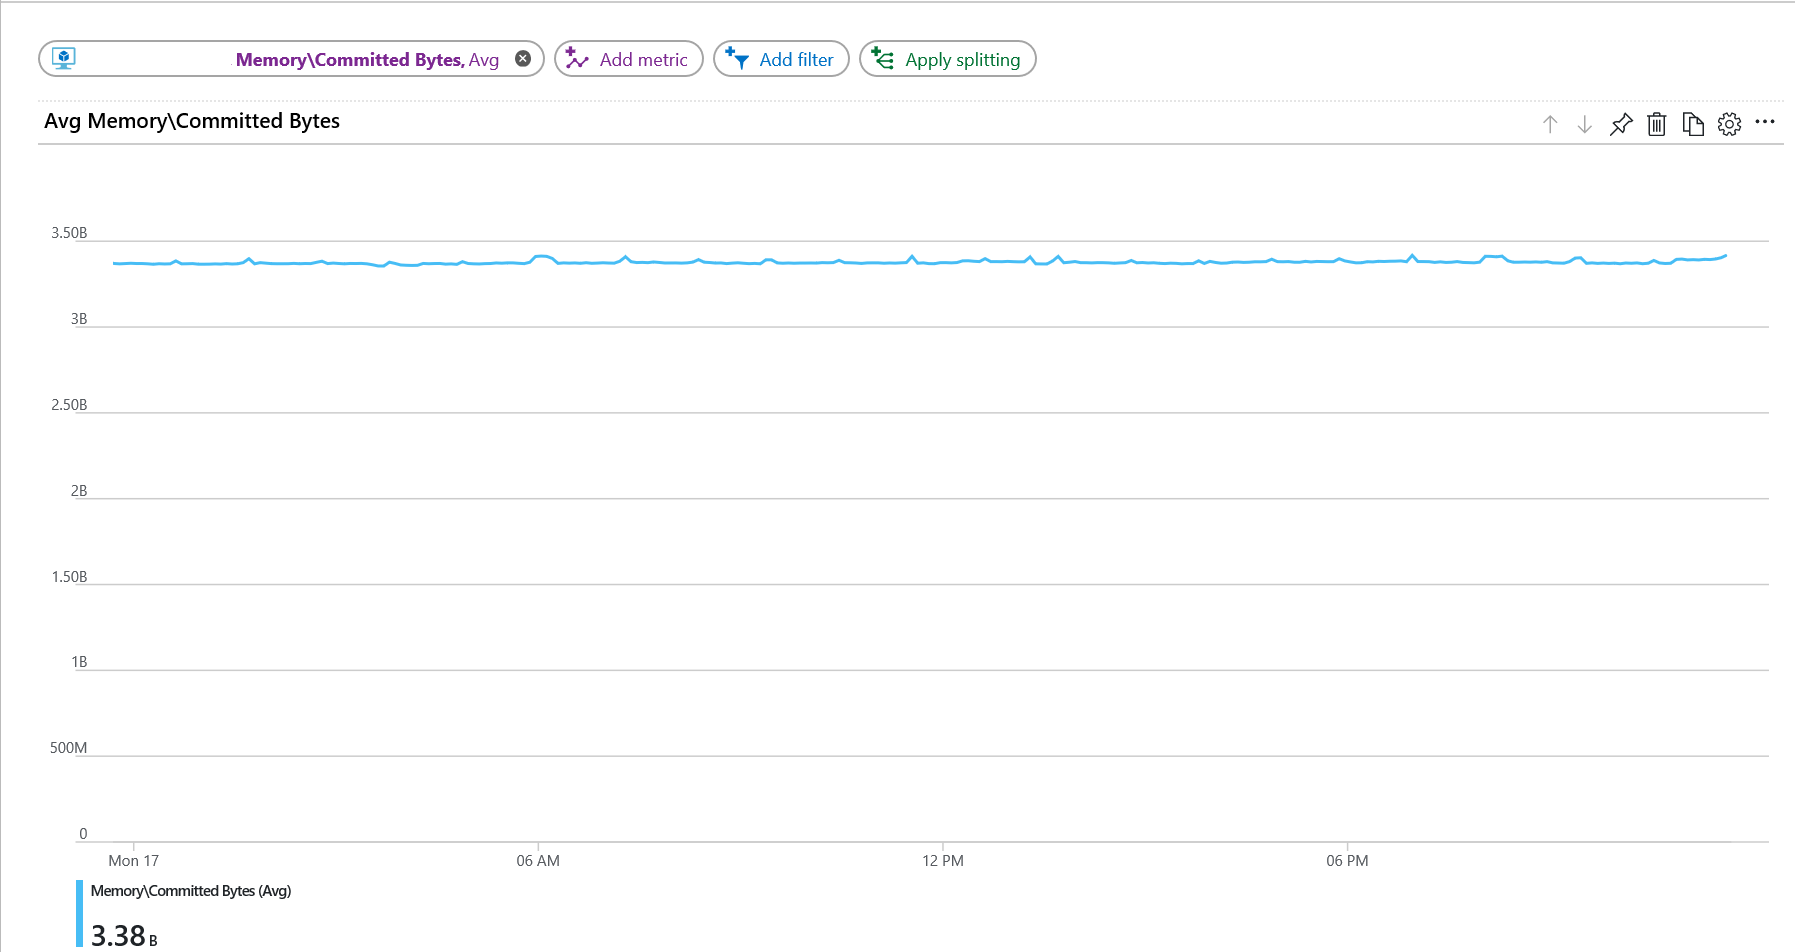
Azure portal でメトリックをプロットする
Azure Portal にアクセスします。
左側のメニューで [モニター] を選択します。
左側の [監視] ペインで、[メトリック] を選択します。

リソースのドロップダウン メニューで、お使いのクラシック VM を選択します。
名前空間のドロップダウン メニューで、 [azure.vm.windows.guest] を選択します。
メトリックのドロップダウン メニューで、 [Memory\Committed Bytes in Use] を選択します。


次のステップ
- カスタム メトリックの詳細を確認します。