Power BI ビジュアルでのデータ ビューのマッピングについて理解する
この記事では、データ ビュー マッピングと、さまざまな種類のビジュアルを作成するためのデータ ロールの使用方法について説明します。 データ ロールの条件付き要件と、さまざまな dataMappings の種類を指定する方法について説明します。
有効なマッピングごとにデータ ビューが生成されます。 特定の条件下で複数のデータ マッピングを指定できます。 サポートされているマッピング オプションは次のとおりです。
"dataViewMappings": [
    {
        "conditions": [ ... ],
        "categorical": { ... },
        "single": { ... },
        "table": { ... },
        "matrix": { ... }
    }
]
Power BI では、dataViewMappings に有効なマッピングも指定されている場合にのみ、データ ビューへのマッピングが作成されます。
つまり、dataViewMappings に定義されるものも (categorical) あれば、定義されないものも (table や single などの他のマッピング) あります。 その場合、Power BI では、単一の categorical マッピングを使用してデータ ビューが生成されますが、table およびその他のマッピングは未定義のままとなります。 次に例を示します。
"dataViewMappings": [
    {
    "categorical": {
        "categories": [ ... ],
        "values": [ ... ]
    },
    "metadata": { ... }
    }
]
条件
conditions セクションでは、特定のデータ マッピングの規則を設定します。 記述されている条件セットのいずれかにデータが一致した場合、ビジュアルによってデータが有効なものとして受け入れられます。
フィールドごとに最小値と最大値を指定できます。 この値は、そのデータ ロールにバインドできるフィールドの数を表します。
Note
条件でデータ ロールが省略されている場合は、任意の数のフィールドを持つことができます。
次の例では、category は 1 つのデータ フィールドに制限され、measure は 2 つのデータ フィールドに制限されています。
"conditions": [
    { "category": { "max": 1 }, "measure": { "max": 2 } },
]
また、データ ロールに対して複数の条件を設定できます。 その場合、次のいずれかの条件が満たされるとデータは有効です。
"conditions": [
    { "category": { "min": 1, "max": 1 }, "measure": { "min": 2, "max": 2 } },
    { "category": { "min": 2, "max": 2 }, "measure": { "min": 1, "max": 1 } }
]
上の例では、次の 2 つの条件のいずれかが必要です。
- 正確に 1 つの category フィールドと正確に 2 つの measure
- 正確に 2 つの category と正確に 1 つの measure
単一のデータ マッピング
単一のデータ マッピングは、最も単純な形式のデータ マッピングです。 単一の measure フィールドが受け入れられ、合計が返されます。 フィールドが数値の場合は、合計が返されます。 それ以外の場合は、一意の値の数が返されます。
単一のデータ マッピングを使用するには、マップするデータ ロールの名前を定義します。 このマッピングは、1 つの measure フィールドに対してのみ機能します。 2 番目のフィールドが割り当てられている場合は、データ ビューは生成されません。そのため、データを 1 つのフィールドに制限する条件を含めることをお勧めします。
Note
このデータ マッピングは、他のどのデータ マッピングとも組み合わせて使用することはできません。 データを単一の数値に減らすことを目的としています。
次に例を示します。
{
    "dataRoles": [
        {
            "displayName": "Y",
            "name": "Y",
            "kind": "Measure"
        }
    ],
    "dataViewMappings": [
        {
            "conditions": [
                {
                    "Y": {
                        "max": 1
                    }
                }
            ],
            "single": {
                "role": "Y"
            }
        }
    ]
}
結果のデータ ビューには引き続き他のマッピングの種類 (テーブルやカテゴリ別など) を含めることはできますが、各マッピングには 1 つの値しか含まれません。 ベスト プラクティスは、単一のマッピング内の値にのみアクセスすることです。
{
    "dataView": [
        {
            "metadata": null,
            "categorical": null,
            "matrix": null,
            "table": null,
            "tree": null,
            "single": {
                "value": 94163140.3560001
            }
        }
    ]
}
次のコード サンプルでは、シンプルなデータ ビュー マッピングを処理します。
"use strict";
import powerbi from "powerbi-visuals-api";
import DataView = powerbi.DataView;
import DataViewSingle = powerbi.DataViewSingle;
// standard imports
// ...

export class Visual implements IVisual {
    private target: HTMLElement;
    private host: IVisualHost;
    private valueText: HTMLParagraphElement;

    constructor(options: VisualConstructorOptions) {
        // constructor body
        this.target = options.element;
        this.host = options.host;
        this.valueText = document.createElement("p");
        this.target.appendChild(this.valueText);
        // ...
    }

    public update(options: VisualUpdateOptions) {
        const dataView: DataView = options.dataViews[0];
        const singleDataView: DataViewSingle = dataView.single;

        if (!singleDataView ||
            !singleDataView.value ) {
            return
        }

        this.valueText.innerText = singleDataView.value.toString();
    }
}
前述のコードの結果として、Power BI から単一の値が表示されます。

カテゴリ別のデータ マッピング
カテゴリ別データ マッピングは、データの独立したグループ (つまり、カテゴリ) を取得します。 また、データ マッピングで "group by" を使用して、カテゴリをまとめてグループ化することもできます。
基本的なカテゴリ別のデータ マッピング
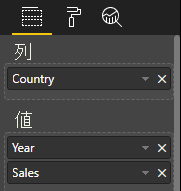
次のようなデータ ロールとマッピングがあるとします。
"dataRoles":[
    {
        "displayName": "Category",
        "name": "category",
        "kind": "Grouping"
    },
    {
        "displayName": "Y Axis",
        "name": "measure",
        "kind": "Measure"
    }
],
"dataViewMappings": {
    "categorical": {
        "categories": {
            "for": { "in": "category" }
        },
        "values": {
            "select": [
                { "bind": { "to": "measure" } }
            ]
        }
    }
}
前述の例は次のように読み取れます。"category のデータの役割をマップして、category にドラッグしたすべてのフィールドに、そのデータが categorical.categories にマップされるようにします。 また、自分の measure データ ロールを categorical.values にマップします。"
- for...in: データ クエリに、このデータ ロールの ''すべての'' 項目を含めます。
- bind...to - for...in と同じ結果が生成されますが、それを ''単一'' フィールドに制限する条件をデータ ロールが持つことが想定されています。
カテゴリ別データをグループ化する
次の例では、前の例と同じ 2 つのデータ ロールを使用し、grouping と measure2 という名前のデータ ロールをさらに追加します。
"dataRole":[
    {
        "displayName": "Category",
        "name": "category",
        "kind": "Grouping"
    },
    {
        "displayName": "Y Axis",
        "name": "measure",
        "kind": "Measure"
    },
    {
        "displayName": "Grouping with",
        "name": "grouping",
        "kind": "Grouping"
    },
    {
        "displayName": "X Axis",
        "name": "measure2",
        "kind": "Grouping"
    }
],
"dataViewMappings":{
    "categorical": {
        "categories": {
            "for": { "in": "category" }
        },
        "values": {
            "group": {
                "by": "grouping",
                "select":[
                    { "bind": { "to": "measure" } },
                    { "bind": { "to": "measure2" } }
                ]
            }
        }
    }
}
このマッピングと基本的なマッピングの違いは、categorical.values がマッピングされる方法の違いです。 measure および measure2 データ ロールを grouping データ ロールにマップすると、x 軸と y 軸が適切にスケーリングされます。
階層データをグループ化する
次の例では、カテゴリ別データを使用して階層を作成します。これは、ドリルダウン アクションをサポートするために使用できます。
次の例は、データロールとマッピングを示しています。
"dataRoles": [
    {
        "displayName": "Categories",
        "name": "category",
        "kind": "Grouping"
    },
    {
        "displayName": "Measures",
        "name": "measure",
        "kind": "Measure"
    },
    {
        "displayName": "Series",
        "name": "series",
        "kind": "Measure"
    }
],
"dataViewMappings": [
    {
        "categorical": {
            "categories": {
                "for": {
                    "in": "category"
                }
            },
            "values": {
                "group": {
                    "by": "series",
                    "select": [{
                            "for": {
                                "in": "measure"
                            }
                        }
                    ]
                }
            }
        }
    }
]
次のようなカテゴリ別データがあるとします。
| 国/地域 | 2013 | 2014 | 2015 | 2016 |
|---|---|---|---|---|
| 米国 | x | x | 650 | 350 |
| Canada | x | 630 | 490 | x |
| メキシコ | 645 | x | x | x |
| 英国 | x | x | 831 | x |
Power BI により、次のカテゴリ セットでカテゴリ別データ ビューが生成されます。
{
    "categorical": {
        "categories": [
            {
                "source": {...},
                "values": [
                    "Canada",
                    "USA",
                    "UK",
                    "Mexico"
                ],
                "identity": [...],
                "identityFields": [...],
            }
        ]
    }
}
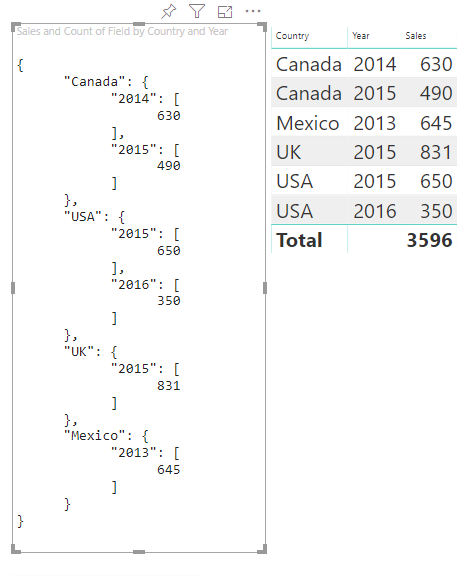
各 category は values のセットにマップされます。 これらの values はそれぞれ series (年で表される) でグループ化されます。
たとえば、各 values 配列は 1 年を表します。
また、各 values 配列には、カナダ、米国、英国、メキシコの 4 つの値があります。
{
    "values": [
        // Values for year 2013
        {
            "source": {...},
            "values": [
                null, // Value for `Canada` category
                null, // Value for `USA` category
                null, // Value for `UK` category
                645 // Value for `Mexico` category
            ],
            "identity": [...],
        },
        // Values for year 2014
        {
            "source": {...},
            "values": [
                630, // Value for `Canada` category
                null, // Value for `USA` category
                null, // Value for `UK` category
                null // Value for `Mexico` category
            ],
            "identity": [...],
        },
        // Values for year 2015
        {
            "source": {...},
            "values": [
                490, // Value for `Canada` category
                650, // Value for `USA` category
                831, // Value for `UK` category
                null // Value for `Mexico` category
            ],
            "identity": [...],
        },
        // Values for year 2016
        {
            "source": {...},
            "values": [
                null, // Value for `Canada` category
                350, // Value for `USA` category
                null, // Value for `UK` category
                null // Value for `Mexico` category
            ],
            "identity": [...],
        }
    ]
}
次に、カテゴリ データ ビュー マッピングを処理するためのコード サンプルを示します。 このサンプルでは、国 / 地域 > 年 > 値の階層構造を作成します。
"use strict";
import powerbi from "powerbi-visuals-api";
import DataView = powerbi.DataView;
import DataViewCategorical = powerbi.DataViewCategorical;
import DataViewValueColumnGroup = powerbi.DataViewValueColumnGroup;
import PrimitiveValue = powerbi.PrimitiveValue;
// standard imports
// ...

export class Visual implements IVisual {
    private target: HTMLElement;
    private host: IVisualHost;
    private categories: HTMLElement;

    constructor(options: VisualConstructorOptions) {
        // constructor body
        this.target = options.element;
        this.host = options.host;
        this.categories = document.createElement("pre");
        this.target.appendChild(this.categories);
        // ...
    }

    public update(options: VisualUpdateOptions) {
        const dataView: DataView = options.dataViews[0];
        const categoricalDataView: DataViewCategorical = dataView.categorical;

        if (!categoricalDataView ||
            !categoricalDataView.categories ||
            !categoricalDataView.categories[0] ||
            !categoricalDataView.values) {
            return;
        }

        // Categories have only one column in data buckets
        // To support several columns of categories data bucket, iterate categoricalDataView.categories array.
        const categoryFieldIndex = 0;
        // Measure has only one column in data buckets.
        // To support several columns on data bucket, iterate years.values array in map function
        const measureFieldIndex = 0;
        let categories: PrimitiveValue[] = categoricalDataView.categories[categoryFieldIndex].values;
        let values: DataViewValueColumnGroup[] = categoricalDataView.values.grouped();

        let data = {};
        // iterate categories/countries-regions
        categories.map((category: PrimitiveValue, categoryIndex: number) => {
            data[category.toString()] = {};
            // iterate series/years
            values.map((years: DataViewValueColumnGroup) => {
                if (!data[category.toString()][years.name] && years.values[measureFieldIndex].values[categoryIndex]) {
                    data[category.toString()][years.name] = []
                }
                if (years.values[0].values[categoryIndex]) {
                    data[category.toString()][years.name].push(years.values[measureFieldIndex].values[categoryIndex]);
                }
            });
        });

        this.categories.innerText = JSON.stringify(data, null, 6);
        console.log(data);
    }
}
結果のビジュアルは次のとおりです。
マッピング テーブル
''テーブル'' データ ビューは、基本的に数値データ ポイントを集計できるデータ ポイントのリストです。
たとえば、前のセクションと同じデータを使用しますが、次の機能があります。
"dataRoles": [
    {
        "displayName": "Column",
        "name": "column",
        "kind": "Grouping"
    },
    {
        "displayName": "Value",
        "name": "value",
        "kind": "Measure"
    }
],
"dataViewMappings": [
    {
        "table": {
            "rows": {
                "select": [
                    {
                        "for": {
                            "in": "column"
                        }
                    },
                    {
                        "for": {
                            "in": "value"
                        }
                    }
                ]
            }
        }
    }
]
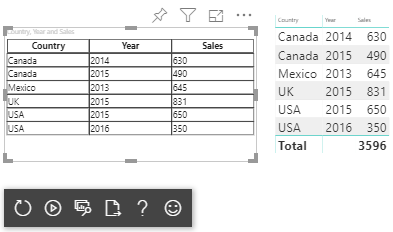
次の例のように、テーブル データ ビューを視覚化します。
| 国/地域 | Year | Sales |
|---|---|---|
| 米国 | 2016 | 100 |
| 米国 | 2015 | 50 |
| Canada | 2015 | 200 |
| Canada | 2015 | 50 |
| メキシコ | 2013 | 300 |
| 英国 | 2014 | 150 |
| 米国 | 2015 | 75 |
データ バインド:
Power BI では、ご利用のデータはテーブル データ ビューとして表示されます。 ''データが順序付けられていると想定しないでください''。
{
    "table" : {
        "columns": [...],
        "rows": [
            [
                "Canada",
                2014,
                630
            ],
            [
                "Canada",
                2015,
                490
            ],
            [
                "Mexico",
                2013,
                645
            ],
            [
                "UK",
                2014,
                831
            ],
            [
                "USA",
                2015,
                650
            ],
            [
                "USA",
                2016,
                350
            ]
        ]
    }
}
データを集計するには、希望するフィールドを選択してから、[合計] を選択してください。

テーブル データ ビューのマッピングを処理するコード サンプルです。
"use strict";
import "./../style/visual.less";
import powerbi from "powerbi-visuals-api";
// ...
import DataViewMetadataColumn = powerbi.DataViewMetadataColumn;
import DataViewTable = powerbi.DataViewTable;
import DataViewTableRow = powerbi.DataViewTableRow;
import PrimitiveValue = powerbi.PrimitiveValue;
// standard imports
// ...

export class Visual implements IVisual {
    private target: HTMLElement;
    private host: IVisualHost;
    private table: HTMLParagraphElement;

    constructor(options: VisualConstructorOptions) {
        // constructor body
        this.target = options.element;
        this.host = options.host;
        this.table = document.createElement("table");
        this.target.appendChild(this.table);
        // ...
    }

    public update(options: VisualUpdateOptions) {
        const dataView: DataView = options.dataViews[0];
        const tableDataView: DataViewTable = dataView.table;

        if (!tableDataView) {
            return
        }
        while(this.table.firstChild) {
            this.table.removeChild(this.table.firstChild);
        }

        //draw header
        const tableHeader = document.createElement("th");
        tableDataView.columns.forEach((column: DataViewMetadataColumn) => {
            const tableHeaderColumn = document.createElement("td");
            tableHeaderColumn.innerText = column.displayName
            tableHeader.appendChild(tableHeaderColumn);
        });
        this.table.appendChild(tableHeader);

        //draw rows
        tableDataView.rows.forEach((row: DataViewTableRow) => {
            const tableRow = document.createElement("tr");
            row.forEach((columnValue: PrimitiveValue) => {
                const cell = document.createElement("td");
                cell.innerText = columnValue.toString();
                tableRow.appendChild(cell);
            })
            this.table.appendChild(tableRow);
        });
    }
}
ビジュアル スタイル ファイル style/visual.less には、テーブルのレイアウトが含まれています。
table {
    display: flex;
    flex-direction: column;
}

tr, th {
    display: flex;
    flex: 1;
}

td {
    flex: 1;
    border: 1px solid black;
}
結果のビジュアルはこのようになります。
マトリックスのデータ マッピング
''マトリックス'' のデータ マッピングはテーブルのデータ マッピングに似ていますが、行が階層的に表示されます。 データ ロール値はいずれも列ヘッダー値として使用することができます。
{
    "dataRoles": [
        {
            "name": "Category",
            "displayName": "Category",
            "displayNameKey": "Visual_Category",
            "kind": "Grouping"
        },
        {
            "name": "Column",
            "displayName": "Column",
            "displayNameKey": "Visual_Column",
            "kind": "Grouping"
        },
        {
            "name": "Measure",
            "displayName": "Measure",
            "displayNameKey": "Visual_Values",
            "kind": "Measure"
        }
    ],
    "dataViewMappings": [
        {
            "matrix": {
                "rows": {
                    "for": {
                        "in": "Category"
                    }
                },
                "columns": {
                    "for": {
                        "in": "Column"
                    }
                },
                "values": {
                    "select": [
                        {
                            "for": {
                                "in": "Measure"
                            }
                        }
                    ]
                }
            }
        }
    ]
}
マトリックス データの階層構造
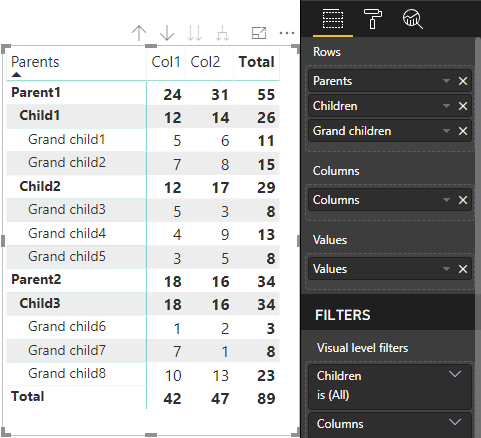
Power BI によって階層データ構造が作成されます。 ツリー階層のルートには、Category データ ロールの[親] 列からのデータと、データ ロール テーブルの [子] 列からの子が含まれます。
セマンティック モデル:
| Parents | Children | 孫 | [列] | 値 |
|---|---|---|---|---|
| Parent1 | Child1 | Grand child1 | Col1 | 5 |
| Parent1 | Child1 | Grand child1 | Col2 | 6 |
| Parent1 | Child1 | Grand child2 | Col1 | 7 |
| Parent1 | Child1 | Grand child2 | Col2 | 8 |
| Parent1 | Child2 | Grand child3 | Col1 | 5 |
| Parent1 | Child2 | Grand child3 | Col2 | 3 |
| Parent1 | Child2 | Grand child4 | Col1 | 4 |
| Parent1 | Child2 | Grand child4 | Col2 | 9 |
| Parent1 | Child2 | Grand child5 | Col1 | 3 |
| Parent1 | Child2 | Grand child5 | Col2 | 5 |
| Parent2 | Child3 | Grand child6 | Col1 | 1 |
| Parent2 | Child3 | Grand child6 | Col2 | 2 |
| Parent2 | Child3 | Grand child7 | Col1 | 7 |
| Parent2 | Child3 | Grand child7 | Col2 | 1 |
| Parent2 | Child3 | Grand child8 | Col1 | 10 |
| Parent2 | Child3 | Grand child8 | Col2 | 13 |
Power BI のコア マトリックス ビジュアルでは、データがテーブルとしてレンダリングされます。
このビジュアルでは、次のコードに記述されているようにそのデータ構造が取得されます (ここでは、最初の 2 つのテーブル行のみを表示しています)。
{
    "metadata": {...},
    "matrix": {
        "rows": {
            "levels": [...],
            "root": {
                "childIdentityFields": [...],
                "children": [
                    {
                        "level": 0,
                        "levelValues": [...],
                        "value": "Parent1",
                        "identity": {...},
                        "childIdentityFields": [...],
                        "children": [
                            {
                                "level": 1,
                                "levelValues": [...],
                                "value": "Child1",
                                "identity": {...},
                                "childIdentityFields": [...],
                                "children": [
                                    {
                                        "level": 2,
                                        "levelValues": [...],
                                        "value": "Grand child1",
                                        "identity": {...},
                                        "values": {
                                            "0": {
                                                "value": 5 // value for Col1
                                            },
                                            "1": {
                                                "value": 6 // value for Col2
                                            }
                                        }
                                    },
                                    ...
                                ]
                            },
                            ...
                        ]
                    },
                    ...
                ]
            }
        },
        "columns": {
            "levels": [...],
            "root": {
                "childIdentityFields": [...],
                "children": [
                    {
                        "level": 0,
                        "levelValues": [...],
                        "value": "Col1",
                        "identity": {...}
                    },
                    {
                        "level": 0,
                        "levelValues": [...],
                        "value": "Col2",
                        "identity": {...}
                    },
                    ...
                ]
            }
        },
        "valueSources": [...]
    }
}
行ヘッダーの展開と折りたたみ
API 4.1.0 以降の場合、マトリックス データでは行ヘッダーの展開と折りたたみがサポートされています。 API 4.2 から、プログラムを使ってレベル全体を展開したり折りたたんだりすることができます。 展開および折りたたみ機能は、ユーザーが次のレベルのすべてのデータをフェッチせずに行を展開または折りたたむことができるようにして、dataView へのデータのフェッチを最適化します。 選択された行のデータのみがフェッチされます。 行ヘッダーの展開状態は、ブックマーク間、さらに保存されたレポート間でも一貫性が保たれます。 各ビジュアルに固有ではありません。
dataRoles パラメーターを showContextMenu メソッドに指定して、展開と折りたたみのコマンドをコンテキスト メニューに追加することができます。

多数のデータ ポイントを展開するには、expand/collapse API を使用してさらに多くのデータ API をフェッチします。
API 機能
行ヘッダーの展開と折りたたみを有効にするために、API バージョン 4.1.0 に次の要素が追加されました。
DataViewTreeNodeのisCollapsedフラグ。interface DataViewTreeNode { //... /** * TRUE if the node is Collapsed * FALSE if it is Expanded * Undefined if it cannot be Expanded (e.g. subtotal) */ isCollapsed?: boolean; }ISelectionMangerインターフェイス内のtoggleExpandCollapseメソッド。interface ISelectionManager { //... showContextMenu(selectionId: ISelectionId, position: IPoint, dataRoles?: string): IPromise<{}>; // dataRoles is the name of the role of the selected data point toggleExpandCollapse(selectionId: ISelectionId, entireLevel?: boolean): IPromise<{}>; // Expand/Collapse an entire level will be available from API 4.2.0 //... }DataViewHierarchyLevel 内の
canBeExpandedフラグ。interface DataViewHierarchyLevel { //... /** If TRUE, this level can be expanded/collapsed */ canBeExpanded?: boolean; }
ビジュアルの要件
マトリックス データ ビューを使用して、展開と折りたたみ機能をビジュアルに対して有効にするには、次のようにします。
次のコードを capabilities.json ファイルに追加してください。
   "expandCollapse": {
    "roles": ["Rows"], //”Rows” is the name of rows data role
    "addDataViewFlags": {
        "defaultValue": true //indicates if the DataViewTreeNode will get the isCollapsed flag by default
    }
},
ロールがドリル可能であることを確認してください。
    "drilldown": {
    "roles": ["Rows"]
},
各ノードについて、選択したノードの階層レベルで
withMatrixNodeメソッドを呼び出し、selectionIdを作成して、選択ビルダーのインスタンスを作成してください。 次に例を示します。let nodeSelectionBuilder: ISelectionIdBuilder = visualHost.createSelectionIdBuilder(); // parantNodes is a list of the parents of the selected node. // node is the current node which the selectionId is created for. parentNodes.push(node); for (let i = 0; i < parentNodes.length; i++) { nodeSelectionBuilder = nodeSelectionBuilder.withMatrixNode(parentNodes[i], levels); } const nodeSelectionId: ISelectionId = nodeSelectionBuilder.createSelectionId();選択マネージャーのインスタンスを作成し、選択したノード用に作成した
selectionIdのパラメーターを持つselectionManager.toggleExpandCollapse()メソッドを使用してください。 次に例を示します。// handle click events to apply expand\collapse action for the selected node button.addEventListener("click", () => { this.selectionManager.toggleExpandCollapse(nodeSelectionId); });
Note
- 選択したノードが行ノードでない場合、Power BI では展開および折りたたみの呼び出しが無視され、展開および折りたたみコマンドはコンテキストメニューから削除されます。
dataRolesパラメーターがshowContextMenuメソッドに必要なのは、ビジュアルがdrilldownまたはexpandCollapseの機能をサポートしている場合のみです。 ビジュアルがこれらの機能をサポートしていても、dataRoles が指定されていない場合、開発者向けビジュアルを使用するか、デバッグ モードが有効になった状態でパブリック ビジュアルをデバッグすると、エラーがコンソールに出力されます。
考慮事項と制限事項
- ノードを展開すると、新しいデータ制限が DataView に適用されます。 新しい DataView に、前の DataView に提示されたノードの一部が含まれていない場合があります。
- 展開または折りたたみを使用すると、ビジュアルで要求されなかった場合でも合計が追加されます。
- 列の展開と折りたたみはサポートされていません。
すべてのメタデータ列を保持する
API 5.1.0 以降では、すべてのメタデータ列の保持がサポートされています。 この機能により、視覚エフェクトはアクティブなプロジェクションに関係なく、すべての列のメタデータを受け取ることができます。
次の行を capabilities.json ファイルに追加します。
"keepAllMetadataColumns": {
    "type": "boolean",
    "description": "Indicates that visual is going to receive all metadata columns, no matter what the active projections are"
}
このプロパティを true に設定すると、折りたたまれた列を含むすべてのメタデータが受信されます。 このプロパティを false に設定するか、未定義のままにすると、アクティブなプロジェクションを持つ列 (たとえば展開済み) でのみメタデータを受信することになります。
データの削減アルゴリズム
データの削減アルゴリズムでは、データ ビューで受け取るデータとその量を制御します。
count は、データ ビューで受け入れ可能な値の最大数に設定されます。 count を超える値がある場合、受け取る必要がある値はデータの削減アルゴリズムによって判断されます。
データの削減アルゴリズムの種類
データの削減アルゴリズムの設定には、次の 4 種類があります。
top: 先頭から count 個の値がセマンティック モデルから取得されます。bottom: 末尾から count 個の値がセマンティック モデルから取得されます。sample: 最初と最後の項目と、それらの間にある等間隔の count 個の項目が含まれます。 たとえば、セマンティック モデル [0, 1, 2, ...100] をお持ちで、count が 9 である場合、値 [0, 10, 20...100] を受け取ることになります。window: count 個の要素を含む、ある時点のデータ ポイントの 1 つの window を読み込みます。 現時点では、topとwindowは同等です。 今後、ウィンドウ設定が完全にサポートされる予定です。
既定では、すべての Power BI ビジュアルには、count が 1000 個のデータ ポイントに設定された先頭データ削減アルゴリズムが適用されます。 この既定値は capabilities.json ファイルで次のプロパティを設定することと同じです。
"dataReductionAlgorithm": {
    "top": {
        "count": 1000
    }
}
count 値は 30000 までの任意の整数値に変更できます。 R ベースの Power BI ビジュアルでは、最大 150000 行をサポートできます。
データの削減アルゴリズムの使用
データの削減アルゴリズムは、カテゴリ別、テーブル、またはマトリックスのデータ ビュー マッピングで使用できます。
カテゴリ別データ マッピングでは、カテゴリ別データ マッピングに対して、"categories" または values の "group" セクションにアルゴリズムを追加できます。
"dataViewMappings": {
    "categorical": {
        "categories": {
            "for": { "in": "category" },
            "dataReductionAlgorithm": {
                "window": {
                    "count": 300
                }
            }
        },
        "values": {
            "group": {
                "by": "series",
                "select": [{
                        "for": {
                            "in": "measure"
                        }
                    }
                ],
                "dataReductionAlgorithm": {
                    "top": {
                        "count": 100
                    }
                }
            }
        }
    }
}
テーブル データ ビュー マッピングでは、データの削減アルゴリズムをデータ ビュー マッピング テーブルの rows セクションに適用します。
"dataViewMappings": [
    {
        "table": {
            "rows": {
                "for": {
                    "in": "values"
                },
                "dataReductionAlgorithm": {
                    "top": {
                        "count": 2000
                    }
                }
            }
        }
    }
]
データの削減アルゴリズムは、データ ビュー マッピング マトリックスの rows セクションおよび columns セクションに適用できます。
次のステップ
フィードバック
以下は間もなく提供いたします。2024 年を通じて、コンテンツのフィードバック メカニズムとして GitHub の issue を段階的に廃止し、新しいフィードバック システムに置き換えます。 詳細については、「https://aka.ms/ContentUserFeedback」を参照してください。
フィードバックの送信と表示