다각형 계층을 맵에 추가(Android SDK)
이 문서에서는 다각형 계층을 사용하여 맵에 Polygon 및 MultiPolygon 기능 기하 도형의 영역을 렌더링하는 방법을 보여 줍니다.
참고 항목
Azure Maps Android SDK 사용 중지
이제 Android용 Azure Maps 네이티브 SDK는 더 이상 사용되지 않으며 2025년 3월 31일에 사용 중지됩니다. 서비스 중단을 방지하려면 2025년 3월 31일까지 Azure Maps 웹 SDK로 마이그레이션하세요. 자세한 내용은 Azure Maps Android SDK 마이그레이션 가이드를 참조하세요.
필수 조건
빠른 시작: Android 앱 만들기 문서의 단계를 완료해야 합니다. 이 문서의 코드 블록은 맵 onReady 이벤트 처리기에 삽입할 수 있습니다.
다각형 계층 사용
다각형 계층이 데이터 원본에 연결되고 맵에 로드되면 Polygon 및 MultiPolygon 기능을 사용하여 영역을 렌더링합니다. 다각형을 만들려면 이를 데이터 원본에 추가하고 PolygonLayer 클래스를 사용하여 다각형 계층으로 렌더링합니다.
//Create a data source and add it to the map.
DataSource source = new DataSource();
map.sources.add(source);

//Create a rectangular polygon.
source.add(Polygon.fromLngLats(
    Arrays.asList(
        Arrays.asList(
            Point.fromLngLat(-73.98235, 40.76799),
            Point.fromLngLat(-73.95785, 40.80044),
            Point.fromLngLat(-73.94928, 40.79680),
            Point.fromLngLat(-73.97317, 40.76437),
            Point.fromLngLat(-73.98235, 40.76799)
        )
    )
));

//Create and add a polygon layer to render the polygon on the map, below the label layer.
map.layers.add(new PolygonLayer(source,
    fillColor("red"),
    fillOpacity(0.7f)
), "labels");
//Create a data source and add it to the map.
val source = DataSource()
map.sources.add(source)

//Create a rectangular polygon.
source.add(
    Polygon.fromLngLats(
        Arrays.asList(
            Arrays.asList(
                Point.fromLngLat(-73.98235, 40.76799),
                Point.fromLngLat(-73.95785, 40.80044),
                Point.fromLngLat(-73.94928, 40.79680),
                Point.fromLngLat(-73.97317, 40.76437),
                Point.fromLngLat(-73.98235, 40.76799)
            )
        )
    )
)

//Create and add a polygon layer to render the polygon on the map, below the label layer.
map.layers.add(
    PolygonLayer(
        source,
        fillColor("red"),
        fillOpacity(0.7f)
    ), "labels"
)
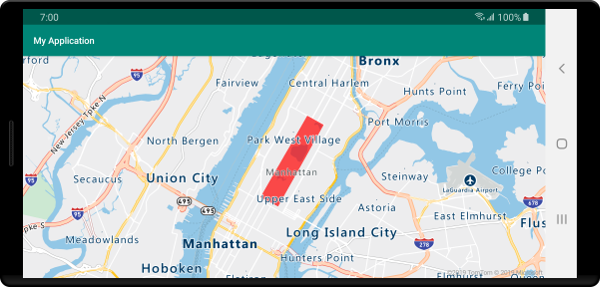
다음 스크린샷은 다각형 계층을 사용하여 다각형 영역을 렌더링하는 위의 코드를 보여줍니다.
다각형 및 선 계층을 함께 사용
선 계층은 다각형의 윤곽선을 렌더링하는 데 사용됩니다. 다음 코드 샘플에서는 이전 예와 같이 다각형을 렌더링하지만, 이제는 선 계층을 추가합니다. 이 선 계층은 데이터 원본에 연결된 두 번째 계층입니다.
//Create a data source and add it to the map.
DataSource source = new DataSource();
map.sources.add(source);

//Create a rectangular polygon.
source.add(Polygon.fromLngLats(
    Arrays.asList(
        Arrays.asList(
            Point.fromLngLat(-73.98235, 40.76799),
            Point.fromLngLat(-73.95785, 40.80044),
            Point.fromLngLat(-73.94928, 40.79680),
            Point.fromLngLat(-73.97317, 40.76437),
            Point.fromLngLat(-73.98235, 40.76799)
        )
    )
));

//Create and add a polygon layer to render the polygon on the map, below the label layer.
map.layers.add(new PolygonLayer(source,
    fillColor("rgba(0, 200, 200, 0.5)")
), "labels");

//Create and add a line layer to render the outline of the polygon.
map.layers.add(new LineLayer(source,
    strokeColor("red"),
    strokeWidth(2f)
));
//Create a data source and add it to the map.
val source = DataSource()
map.sources.add(source)

//Create a rectangular polygon.
source.add(
    Polygon.fromLngLats(
        Arrays.asList(
            Arrays.asList(
                Point.fromLngLat(-73.98235, 40.76799),
                Point.fromLngLat(-73.95785, 40.80044),
                Point.fromLngLat(-73.94928, 40.79680),
                Point.fromLngLat(-73.97317, 40.76437),
                Point.fromLngLat(-73.98235, 40.76799)
            )
        )
    )
)

//Create and add a polygon layer to render the polygon on the map, below the label layer.
map.layers.add(
    PolygonLayer(
        source,
        fillColor("rgba(0, 200, 200, 0.5)")
    ), "labels"
)

//Create and add a line layer to render the outline of the polygon.
map.layers.add(
    LineLayer(
        source,
        strokeColor("red"),
        strokeWidth(2f)
    )
)
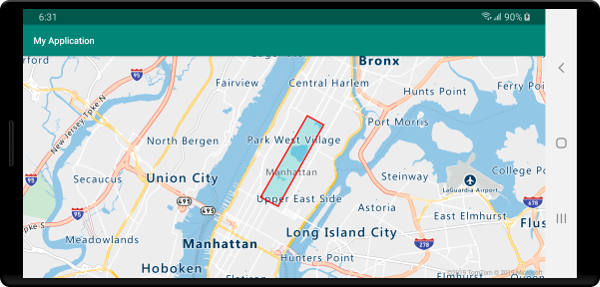
다음 스크린샷은 선 계층을 사용하여 렌더링된 윤곽선으로 다각형을 렌더링하는 위의 코드를 보여줍니다.
팁
선 계층을 사용하여 다각형의 윤곽선을 만들 때 각 지점 배열의 시작점과 끝점이 같도록 다각형의 모든 링을 닫아야 합니다. 이렇게 하지 않으면 선 계층이 다각형의 마지막 지점을 첫 번째 지점에 연결하지 못할 수 있습니다.
패턴을 사용하여 다각형 채우기
색을 사용한 다각형 채우기 외에도 이미지 패턴을 사용하여 다각형을 채울 수 있습니다. 이미지 패턴을 맵 이미지 스프라이트 리소스에 로드한 다음 다각형 계층의 fillPattern 옵션을 사용하여 이 이미지를 참조합니다.
//Load an image pattern into the map image sprite.
map.images.add("fill-checker-red", R.drawable.fill_checker_red);

//Create a data source and add it to the map.
DataSource source = new DataSource();
map.sources.add(source);

//Create a polygon.
source.add(Polygon.fromLngLats(
    Arrays.asList(
        Arrays.asList(
            Point.fromLngLat(-50, -20),
            Point.fromLngLat(0, 40),
            Point.fromLngLat(50, -20),
            Point.fromLngLat(-50, -20)
        )
    )
));

//Create and add a polygon layer to render the polygon on the map, below the label layer.
map.layers.add(new PolygonLayer(source,
        fillPattern("fill-checker-red"),
        fillOpacity(0.5f)
), "labels");
//Load an image pattern into the map image sprite.
map.images.add("fill-checker-red", R.drawable.fill_checker_red)

//Create a data source and add it to the map.
val source = DataSource()
map.sources.add(source)

//Create a polygon.
source.add(
    Polygon.fromLngLats(
        Arrays.asList(
            Arrays.asList(
                Point.fromLngLat(-50, -20),
                Point.fromLngLat(0, 40),
                Point.fromLngLat(50, -20),
                Point.fromLngLat(-50, -20)
            )
        )
    )
)

//Create and add a polygon layer to render the polygon on the map, below the label layer.
map.layers.add(
    PolygonLayer(
        source,
        fillPattern("fill-checker-red"),
        fillOpacity(0.5f)
    ), "labels"
)
이 샘플의 경우 다음 이미지가 앱의 그리기 가능한 폴더에 로드되었습니다.
 |
|---|
| fill-checker-red.png |
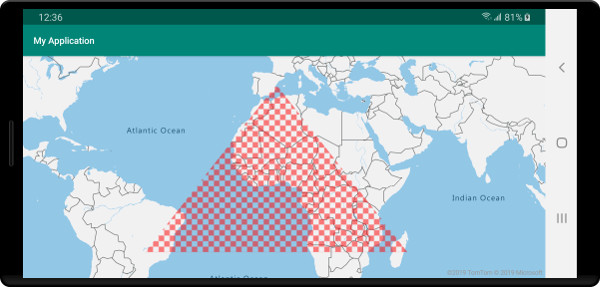
다음 이미지는 맵에 채우기 패턴이 있는 다각형을 렌더링하는 위 코드의 스크린샷입니다.
다음 단계
맵에 추가할 더 많은 코드 예제를 보려면 다음 문서를 참조하세요.