Exercise - Monitor and troubleshoot performance
In this exercise, you'll learn how to monitor and troubleshoot a performance problem with Azure SQL by using familiar and new tools and capabilities.
Set up: Use scripts to deploy Azure SQL Database
The terminal session on the right, Azure Cloud Shell, enables you to interact with Azure by using a browser. For this exercise, you'll run a script to create your environment, an instance of Azure SQL Database with the AdventureWorks database. (The smaller, simpler sample AdventureWorksLT database is used, but we'll call it AdventureWorks to prevent confusion.) In the script, you're prompted for a password and your local IP address to enable your device to connect to the database.
This script takes 3-5 minutes to complete. Make sure to note your password, unique ID, and region. These won't be shown again.
Start by obtaining your local IP address. Ensure that you're disconnected from any VPN service and open a local PowerShell terminal on your device. Run the following command and note the resulting IP address:
(Invoke-WebRequest -Uri "https://ipinfo.io/ip").ContentIn Azure Cloud Shell on the right, enter the following code, and when prompted, provide a complex password and your local public IP address you retrieved in the previous step. Press Enter to run the last line of the script.
$adminSqlLogin = "cloudadmin"
$password = Read-Host "Your username is 'cloudadmin'. Please enter a password for your Azure SQL Database server that meets the password requirements"
# Prompt for local ip address
$ipAddress = Read-Host "Disconnect your VPN, open PowerShell on your machine and run '(Invoke-WebRequest -Uri "https://ipinfo.io/ip").Content'. Please enter the value (include periods) next to 'Address':"
# Get resource group and location and random string
$resourceGroup = Get-AzResourceGroup | Where ResourceGroupName -like "<rgn>Sandbox resource group name</rgn>"
$resourceGroupName = "<rgn>Sandbox resource group name</rgn>"
$uniqueID = Get-Random -Minimum 100000 -Maximum 1000000
$storageAccountName = "mslearnsa"+$uniqueID
$location = $resourceGroup.Location
$serverName = "aw-server$($uniqueID)"
Run the following script in Azure Cloud Shell. Save the output; you'll need this information throughout the module. Press Enter after you paste in the code, so the last line of code prints the output you need.
Write-Host "Please note your unique ID for future exercises in this module:"
Write-Host $uniqueID
Write-Host "Your resource group name is:"
Write-Host $resourceGroupName
Write-Host "Your resources were deployed in the following region:"
Write-Host $location
Write-Host "Your server name is:"
Write-Host $serverName
Tip
Save the output and note your password, unique ID, and server. You'll need these items throughout the module.
Run the following script to deploy an instance of Azure SQL Database and a logical server with the
AdventureWorkssample. This script adds your IP address as a firewall rule, enables Advanced Data Security, and creates a storage account for use in the remaining exercises in this module. The script can take several minutes to complete, and will pause several times. Wait for a command prompt.# The logical server name has to be unique in the system $serverName = "aw-server$($uniqueID)" # The sample database name $databaseName = "AdventureWorks" # The storage account name has to be unique in the system $storageAccountName = $("sql$($uniqueID)") # Create a new server with a system wide unique server name $server = New-AzSqlServer -ResourceGroupName $resourceGroupName ` -ServerName $serverName ` -Location $location ` -SqlAdministratorCredentials $(New-Object -TypeName System.Management.Automation.PSCredential -ArgumentList $adminSqlLogin, $(ConvertTo-SecureString -String $password -AsPlainText -Force)) # Create a server firewall rule that allows access from the specified IP range and all Azure services $serverFirewallRule = New-AzSqlServerFirewallRule ` -ResourceGroupName $resourceGroupName ` -ServerName $serverName ` -FirewallRuleName "AllowedIPs" ` -StartIpAddress $ipAddress -EndIpAddress $ipAddress $allowAzureIpsRule = New-AzSqlServerFirewallRule ` -ResourceGroupName $resourceGroupName ` -ServerName $serverName ` -AllowAllAzureIPs # Create a database $database = New-AzSqlDatabase -ResourceGroupName $resourceGroupName ` -ServerName $serverName ` -DatabaseName $databaseName ` -SampleName "AdventureWorksLT" ` -Edition "GeneralPurpose" -Vcore 2 -ComputeGeneration "Gen5" # Enable Advanced Data Security $advancedDataSecurity = Enable-AzSqlServerAdvancedDataSecurity ` -ResourceGroupName $resourceGroupName ` -ServerName $serverName # Create a Storage Account $storageAccount = New-AzStorageAccount -ResourceGroupName $resourceGroupName ` -AccountName $storageAccountName ` -Location $location ` -Type "Standard_LRS"On your local device, open SQL Server Management Studio (SSMS) to create a new connection to your logical server.
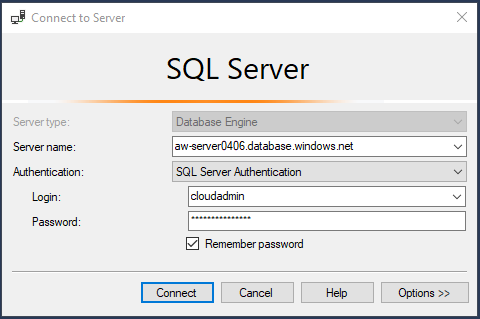
On the Connect to Server login dialog box, provide the following information:
Field Value Server type Database Engine (default). Server name The $serverName that was returned in the Cloud Shell, plus the rest of the URI. For example: aw-server <unique ID>.database.windows.net.Authentication SQL Server Authentication (default). Login cloudadmin The adminSqlLogin assigned in step 1 of this exercise. Password The password you provided in step 1 of this exercise. Remember password checked Select Connect.
Note
Depending on your local configuration (for example, VPN), your client IP address might differ from the IP address the Azure portal used during deployment. If it does, you'll get the following message: "Your client IP address does not have access to the server. Sign in to an Azure account and create a new firewall rule to enable access." If you get this message, sign in by using the account you're using for the sandbox and add a firewall rule for your client IP address. You can complete all of these steps by using the wizard in SSMS.
Prepare the exercise by loading and editing scripts
You can find all the scripts for this exercise in the 04-Performance\monitor_and_scale folder in the GitHub repository you cloned or the zip file you downloaded. Let's prepare the exercise by loading and editing scripts.
In SSMS, in Object Explorer, expand the Databases folder and select the AdventureWorks database.
Select File > Open > File and open the dmexecrequests.sql script. Your query editor window should look like the following text:
SELECT er.session_id, er.status, er.command, er.wait_type, er.last_wait_type, er.wait_resource, er.wait_time
FROM sys.dm_exec_requests er
INNER JOIN sys.dm_exec_sessions es
ON er.session_id = es.session_id
AND es.is_user_process = 1;
Use the same method in SSMS to load the dmdbresourcestats.sql script. A new query editor window should look like the following text:
SELECT * FROM sys.dm_db_resource_stats;This dynamic management view (DMV) will track overall resource usage of your workload against Azure SQL Database. For example, it tracks CPU, I/O, and memory.
Open and edit the sqlworkload.cmd script (which will use the ostress.exe program).
- Substitute your
unique_idthat you saved from the deployment script in the server name. - Substitute the password you used for the sign-in for the Azure SQL Database server for the
-P parameter. - Save the changes to the script.
- Substitute your
Run the workload
In this task, you'll run a workload in a T-SQL query to observe its performance simulating concurrent users.
Use SSMS to open the topcustomersales.sql script file to observe the query. You won't run the query from SSMS. Your query editor window should look like the following text:
DECLARE @x int
DECLARE @y float
SET @x = 0;
WHILE (@x < 10000)
BEGIN
SELECT @y = sum(cast((soh.SubTotal*soh.TaxAmt*soh.TotalDue) as float))
FROM SalesLT.Customer c
INNER JOIN SalesLT.SalesOrderHeader soh
ON c.CustomerID = soh.CustomerID
INNER JOIN SalesLT.SalesOrderDetail sod
ON soh.SalesOrderID = sod.SalesOrderID
INNER JOIN SalesLT.Product p
ON p.ProductID = sod.ProductID
GROUP BY c.CompanyName
ORDER BY c.CompanyName;
SET @x = @x + 1;
END
GO
This database is small. The query to retrieve a list of customers and their associated sales information, ordered by customers with the most sales, shouldn't generate a large result set. You could tune this query by reducing the number of columns in the result set, but these are needed for demonstration purposes of this exercise.
From a PowerShell command prompt, enter the following command to move to the correct directory for this exercise. Replace
<base directory>with your user ID and path for this module :cd <base directory>\04-Performance\monitor_and_scaleRun the workload with the following command:
.\sqlworkload.cmdThis script will use 10 concurrent users who are running the workload query two times. Notice that the script itself runs a single batch but loops 10,000 times. It also assigned the result to a variable, therefore eliminating almost all result set traffic to the client. This isn't necessary, but helps to show a "pure" CPU workload run entirely on the server.
Tip
If you're not seeing CPU usage behavior with this workload for your environment, you can adjust the
-n parameterfor number of users and the-r parameterfor iterations.The output at the command prompt should look similar to the following output:
[datetime] [ostress PID] Max threads setting: 10000
[datetime] [ostress PID] Arguments:
[datetime] [ostress PID] -S[server].database.windows.net
[datetime] [ostress PID] -isqlquery.sql
[datetime] [ostress PID] -U[user]
[datetime] [ostress PID] -dAdventureWorks
[datetime] [ostress PID] -P********
[datetime] [ostress PID] -n10
[datetime] [ostress PID] -r2
[datetime] [ostress PID] -q
[datetime] [ostress PID] Using language id (LCID): 1024 [English_United States.1252] for character formatting with NLS: 0x0006020F and Defined: 0x0006020F
[datetime] [ostress PID] Default driver: SQL Server Native Client 11.0
[datetime] [ostress PID] Attempting DOD5015 removal of [directory]\sqlquery.out]
[datetime] [ostress PID] Attempting DOD5015 removal of [directory]\sqlquery_1.out]
[datetime] [ostress PID] Attempting DOD5015 removal of [directory]\sqlquery_2.out]
[datetime] [ostress PID] Attempting DOD5015 removal of [directory]\sqlquery_3.out]
[datetime] [ostress PID] Attempting DOD5015 removal of [directory]\sqlquery_4.out]
[datetime] [ostress PID] Attempting DOD5015 removal of [directory]\sqlquery_5.out]
[datetime] [ostress PID] Attempting DOD5015 removal of [directory]\sqlquery_6.out]
[datetime] [ostress PID] Attempting DOD5015 removal of [directory]\sqlquery_7.out]
[datetime] [ostress PID] Attempting DOD5015 removal of [directory]\sqlquery_8.out]
[datetime] [ostress PID] Attempting DOD5015 removal of [directory]\sqlquery_9.out]
[datetime] [ostress PID] Starting query execution...
[datetime] [ostress PID]  BETA: Custom CLR Expression support enabled.
[datetime] [ostress PID] Creating 10 thread(s) to process queries
[datetime] [ostress PID] Worker threads created, beginning execution...
Observe performance of the workload
Let's use the DMV queries you loaded earlier to observe performance.
Run the query in SSMS you previously loaded to monitor
dm_exec_requests(dmexecrequests.sql) to observe active requests. Run this query five or six times and observe some of the results:SELECT er.session_id, er.status, er.command, er.wait_type, er.last_wait_type, er.wait_resource, er.wait_time FROM sys.dm_exec_requests er INNER JOIN sys.dm_exec_sessions es ON er.session_id = es.session_id AND es.is_user_process = 1;You should see many of the requests have a status of
RUNNABLE, andlast_wait_typeisSOS_SCHEDULER_YIELD. One indicator of manyRUNNABLErequests and manySOS_SCHEDULER_YIELDwaits is a possible lack of CPU resources for active queries.Note
You might see one or more active requests with a command of
SELECTand await_typeofXE_LIVE_TARGET_TVF. These are queries run by services managed by Microsoft. They help with capabilities like performance insights by using extended events. Microsoft doesn't publish the details of these sessions.Leave this query editor window open. You'll run it again in the next exercise.
Run the query in SSMS you previously loaded to monitor sys.dm_db_resource_stats (dmdbresourcestats.sql). Run the query to see the results of this DMV three or four times.
SELECT * FROM sys.dm_db_resource_stats;This DMV records a snapshot of resource usage for the database every 15 seconds (kept for 1 hour). You should see the column avg_cpu_percent close to 100 percent for several of the snapshots. This is a symptom of a workload pushing the limits of CPU resources for the database.
For a SQL Server on-premises environment, you'd typically use a tool specific to the operating system to track overall resource usage such a CPU. For example, you might use Windows Performance Monitor for this purpose. If you ran this example on an on-premises SQL Server or SQL Server in a virtual machine with two CPUs, you'd see near 100 percent CPU utilization on the server.
Note
You can run another DMV,
sys.resource_stats, in the context of the Azure SQL Database server'smasterdatabase to see resource usage for all Azure SQL Database databases associated with the server. This view is less granular and shows resource usage every five minutes (kept for 14 days).Leave this query editor window open. You'll run it again in the next exercise.
Let the workload complete and take note of its overall duration. When the workload completes, you should see results like the following output and a return to the command prompt:
[datetime] [ostress PID] Total IO waits: 0, Total IO wait time: 0 (ms)
[datetime] [ostress PID] OSTRESS exiting normally, elapsed time: 00:01:22.637
Your duration time might vary but this typically takes at least 1-3 minutes. Make sure to let this run to completion. When the workload is done, you'll be returned to the command prompt.
Use the Query Store for further analysis
Query Store is a capability in SQL Server to track performance execution of queries. Performance data is stored in the user database. Query Store isn't enabled by default for databases created in SQL Server, but is on by default for Azure SQL Database (and Azure SQL Managed Instance).
Query Store comes with a series of system catalog views to view performance data. SSMS provides reports by using these views.
Using the Object Explorer in SSMS, open the Query Store folder to find the report for Top Resource Consuming Queries.
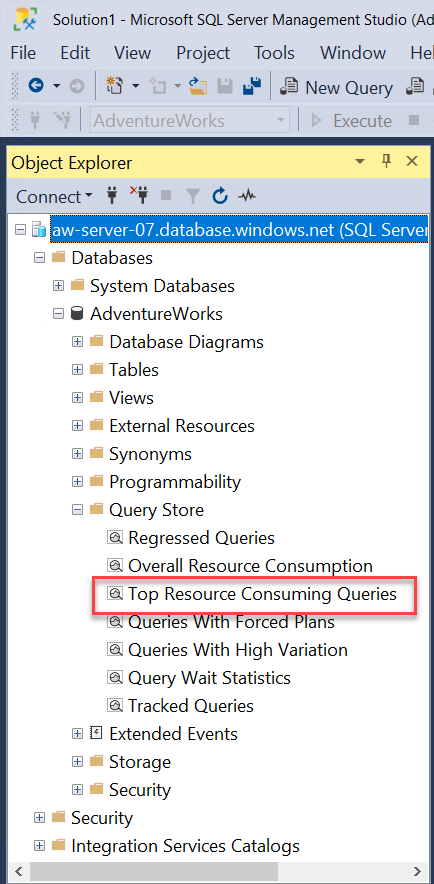
Select the report to find out what queries have consumed the most average resources and execution details of those queries. Based on the workload run to this point, your report should look something like the following image:
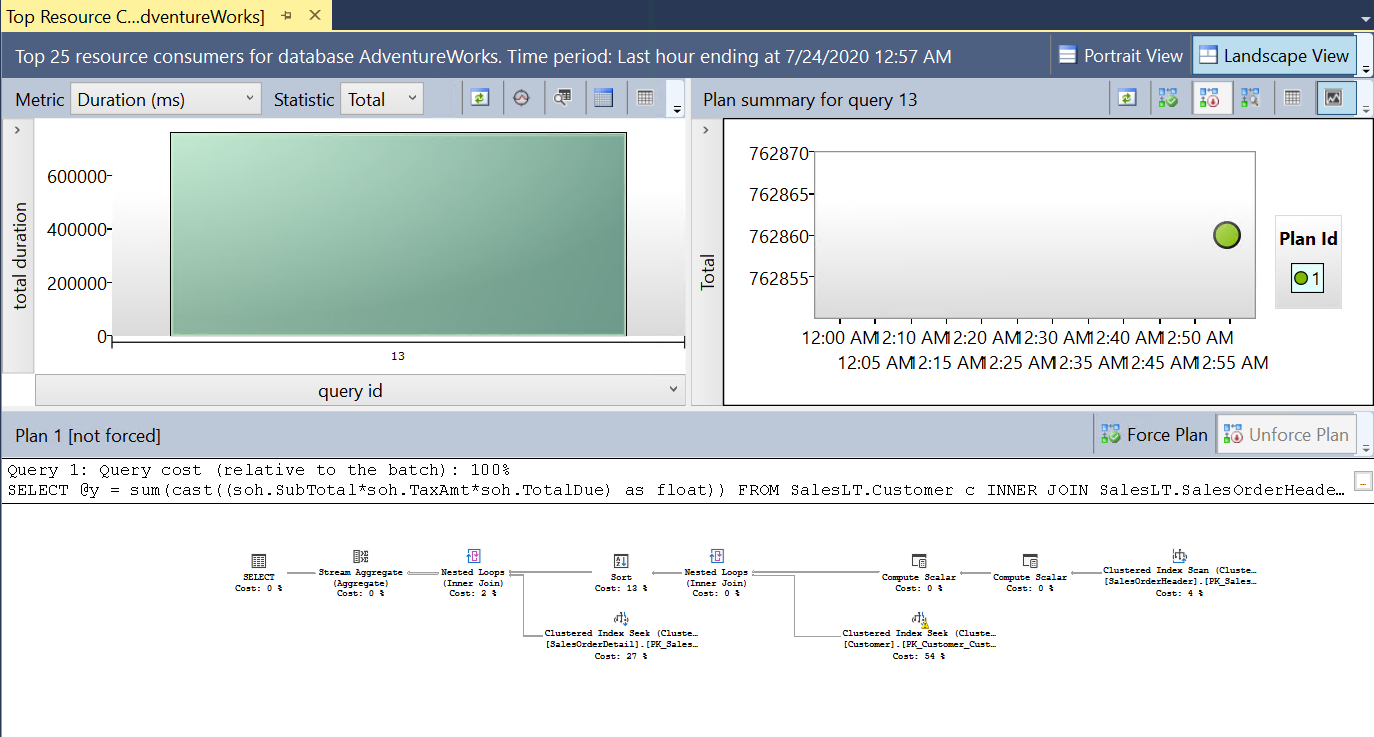
The query shown is the SQL query from the workload for customer sales. This report has three components: queries with the high total duration (you can change the metric), the associated query plan and runtime statistics, and the associated query plan in a visual map.
Select the bar chart for the query (the
query_idmight be different for your system). Your results should look like the following image: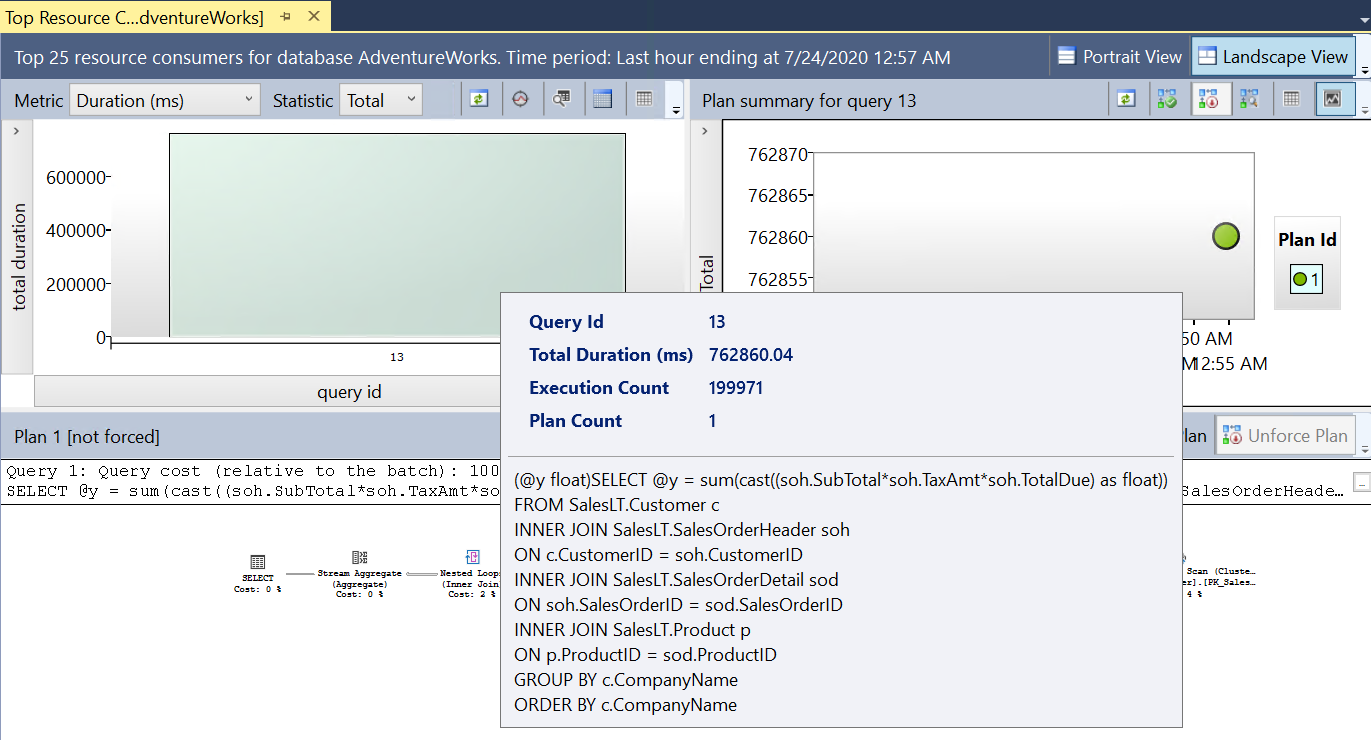
You can see the total duration of the query and query text.
To the right of this bar chart is a chart for statistics for the query plan associated with the query. Hover over the dot associated with the plan. Your results should look like the following image:
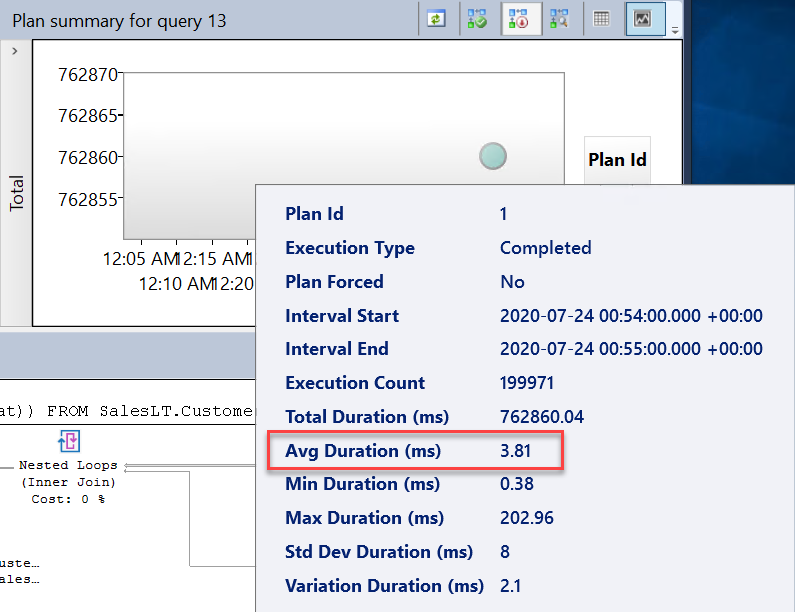
Note the average duration of the query. Your times might vary, but compare this average duration to the average wait time for this query. Later, we'll introduce a performance improvement, and you'll make this comparison again to see the difference.
The final component is the visual query plan. The query plan for this query looks like the following image:
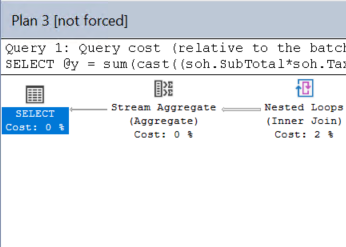
This database table has so few rows that it doesn't need a plan; it can be inefficient. Tuning the query won't improve performance by a measurable amount. You might see a warning in the plan about a lack of statistics for one of the columns for the clustered index seek. This doesn't factor into overall performance.
Following the Top Resource Consuming Queries report in SSMS is a report called Query Wait Statistics. You know from earlier diagnostics that a high number of requests constantly were in a RUNNABLE status, along with almost 100 percent CPU. Query Store comes with reports to look at possible performance bottlenecks due to waits on resources. Select this report and hover over the bar chart. Your results should look like the following image:
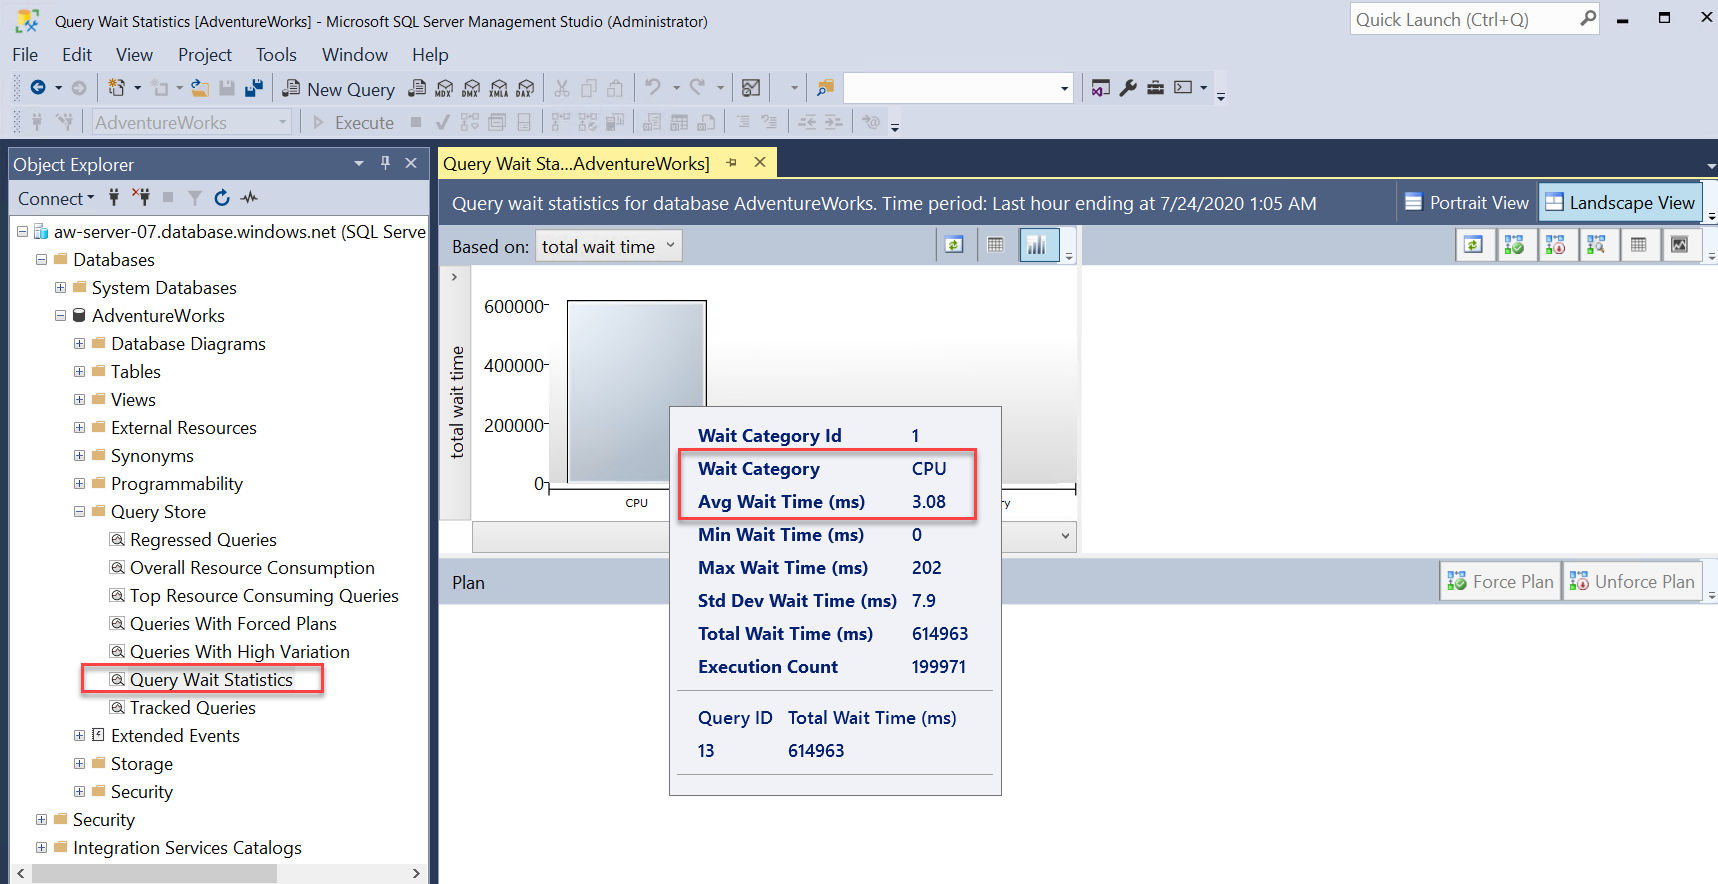
You can see the top wait category is CPU (this is equivalent to the
wait_typeSOS_SCHEDULER_YIELD, which can be seen insys.dm_os_wait_stats), and the average wait time.Select the CPU bar chart in the report. The top query, waiting for CPU, is the query from the workload that you're using.

Notice that the average wait time for CPU in this query is a high percentage of the overall average duration for the query.
Considering the evidence, without any query tuning, our workload requires more CPU capacity than we have deployed for our instance of Azure SQL Database.
Close both Query Store reports. You'll use the same reports in the next exercise.


Observe performance with Azure Monitor
Let's use another method to view the resource usage of our workload. Azure Monitor provides performance metrics that you can view in various ways, including via the Azure portal.
Open the Azure portal, and then find your instance of the AdventureWorks SQL database. On the Overview pane for the database, select the Monitoring tab. The default view in the Monitoring pane is Compute Utilization:
In this example, the CPU percentage is near 100 percent for a recent time range. This chart shows resource usage (CPU and I/O are defaults) over the last hour, and it's refreshed continually. Select the chart so you can customize it to look at other resource usage.
On the SQL database menu, select Add metrics. Another way to view the Compute Utilization metrics and other metrics that are automatically collected by Azure Monitor for Azure SQL Database is to use Metrics Explorer.
Note
Compute Utilization is a pre-defined view of the Metrics Explorer. If you select the Metric drop-down in the Add metrics window, you'll see the following results:
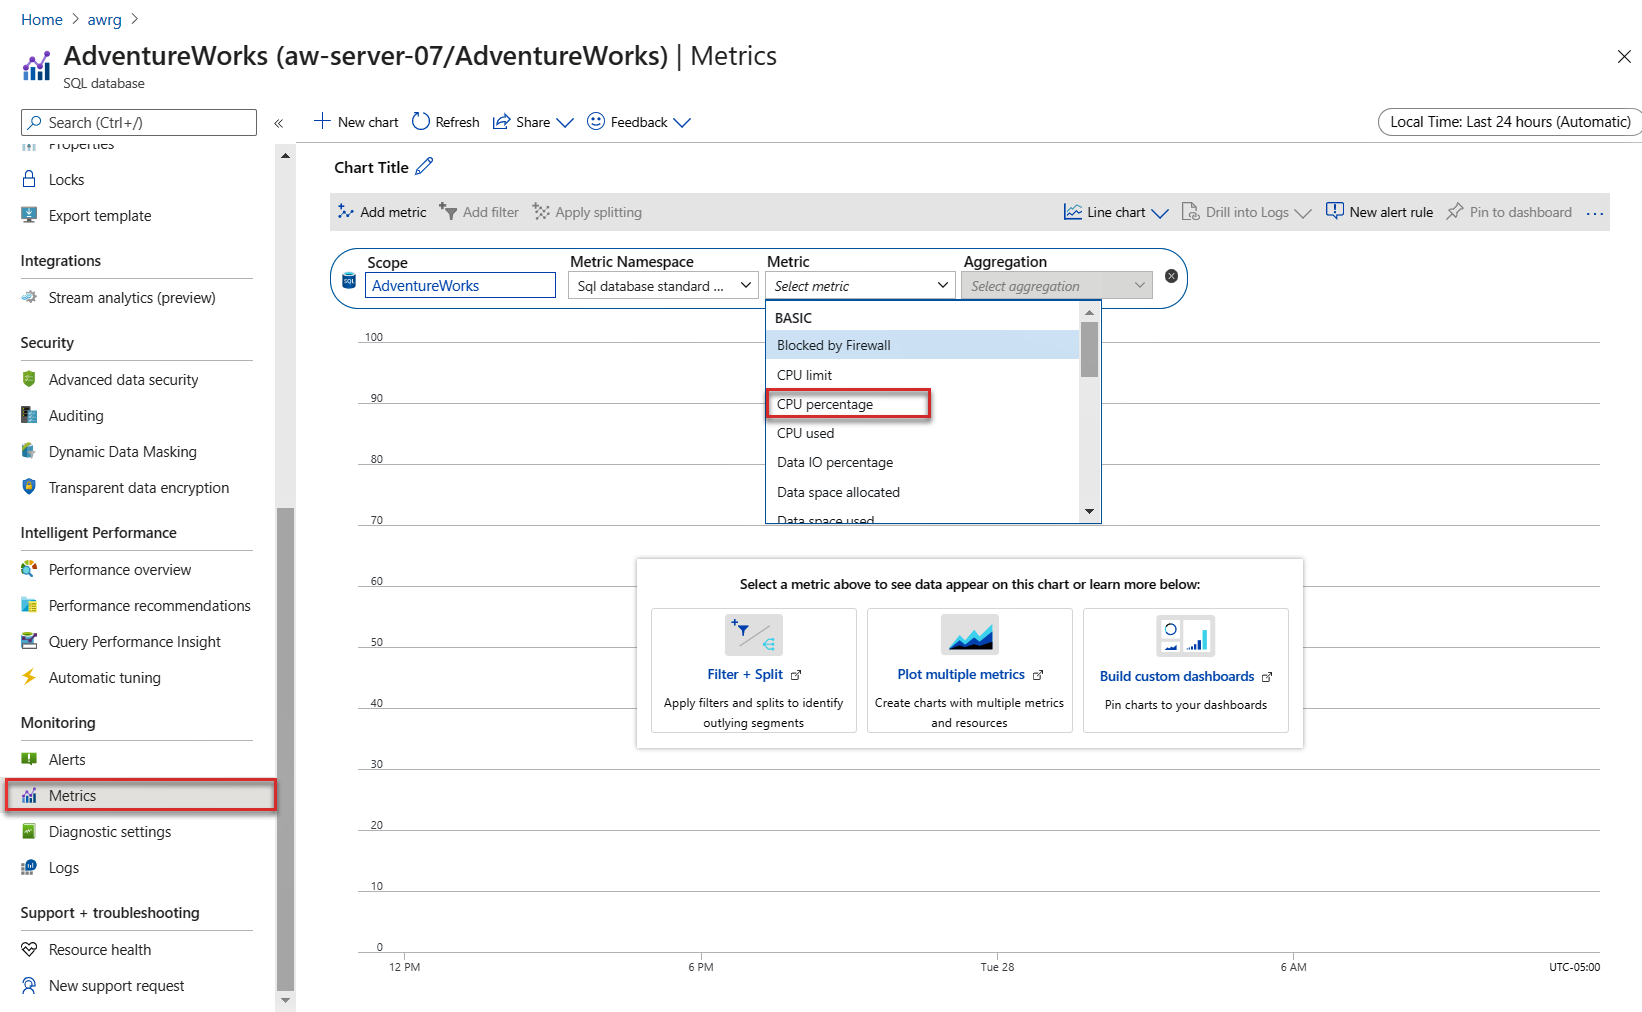
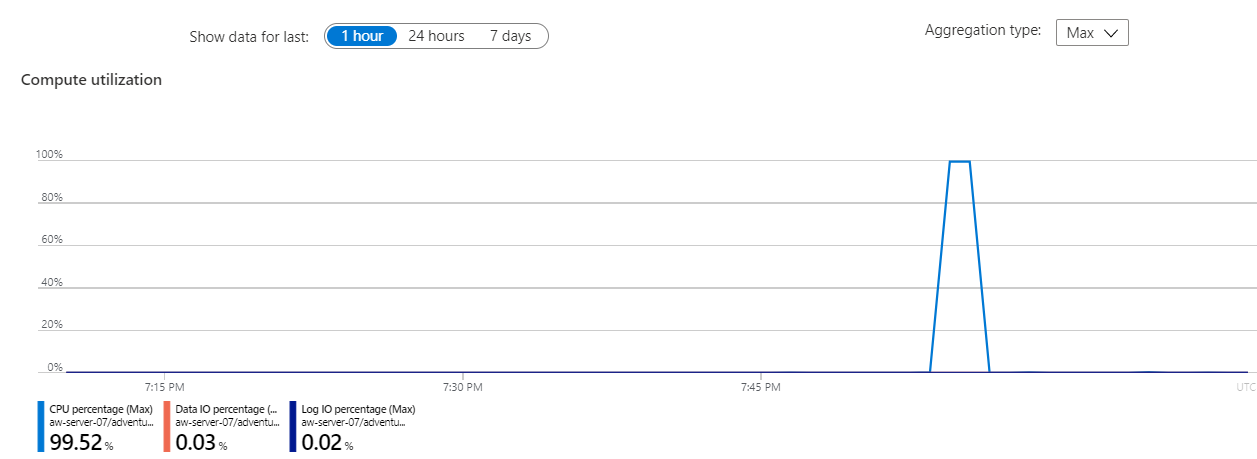
As shown in the screenshot, there are several metrics you can use to view with Metrics Explorer. The Metrics Explorer default view is for a 24-hour period, with a five-minute granularity. The Compute Utilization view is the last hour with a one-minute granularity (which you can change). To see the same view, select CPU percentage and change the capture for one hour. The granularity will change to one minute and should look like the following image:

The default is a line chart, but the Explorer view allows you to change the chart type. Metrics Explorer has many options, including the ability to show multiple metrics on the same chart.

Azure Monitor logs
In this exercise, you didn't set up an Azure Monitor log, but it's worth looking at what a log might look like for a CPU resource usage scenario. Azure Monitor logs can provide a much longer historical record than Azure Metrics.
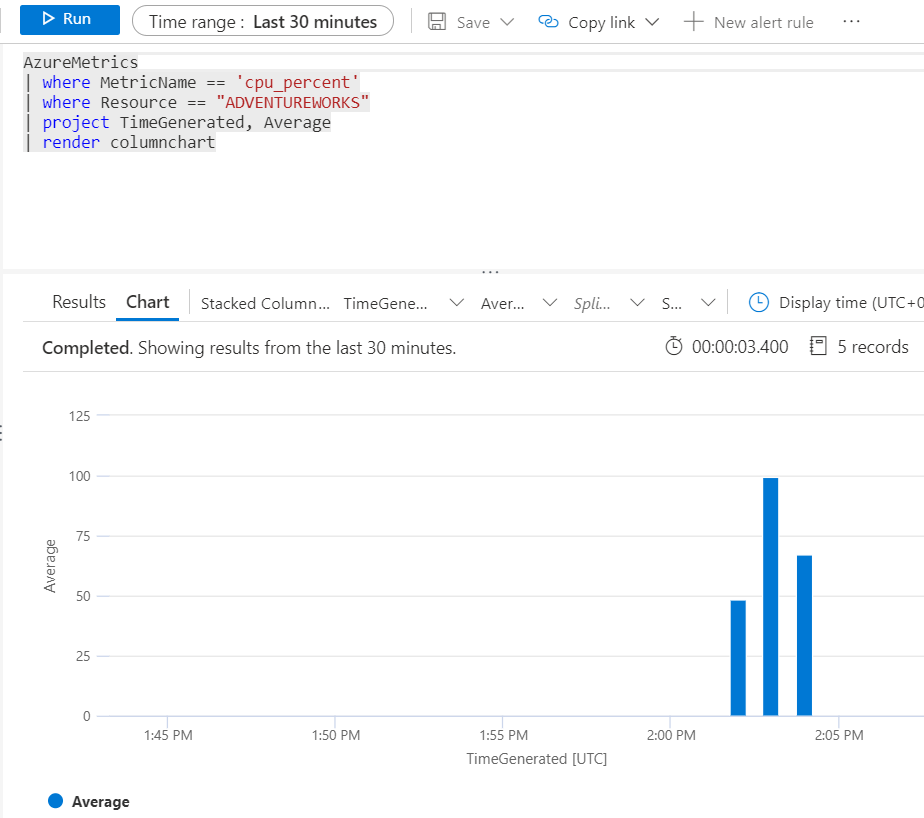
If you'd configured Azure Monitor logs with a Log Analytics workspace, you could use the following Kusto query to view the same CPU utilization results for the database:
AzureMetrics
| where MetricName == 'cpu_percent'
| where Resource == "ADVENTUREWORKS"
| project TimeGenerated, Average
| render columnchart
Your results would look like the following image:
Azure Monitor logs have a delay when you're first configuring log diagnostics for a database, so these results can take some time to appear.
In this exercise, you learned how to observe a common SQL Server performance scenario and dive into details to decide on a possible solution to improve performance. In the next unit, you'll learn methods to accelerate and tune performance.