Manage menus: Key performance indicators
Microsoft Dynamics 365 Finance uses Power BI for data exploration. Many Power BI apps are provided for you.
Navigate to Workspaces and Sales order processing and inquiry.
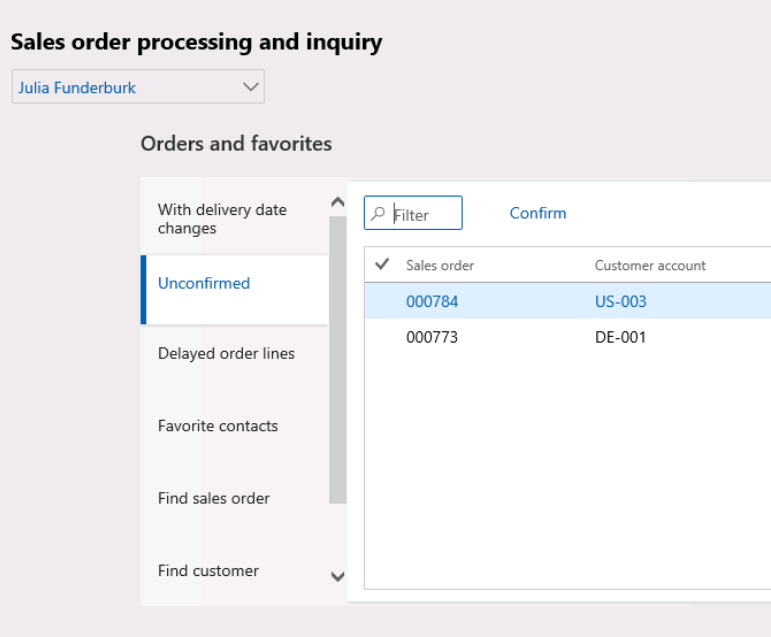
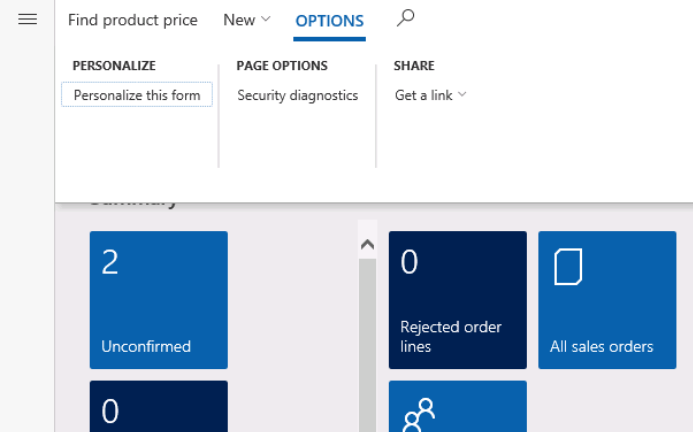
Notice the tiles and KPIs available to you. For example, in the screenshot below, there are two unconfirmed sales orders. If you select that tile, you’re brought to a form, which shows these two orders.
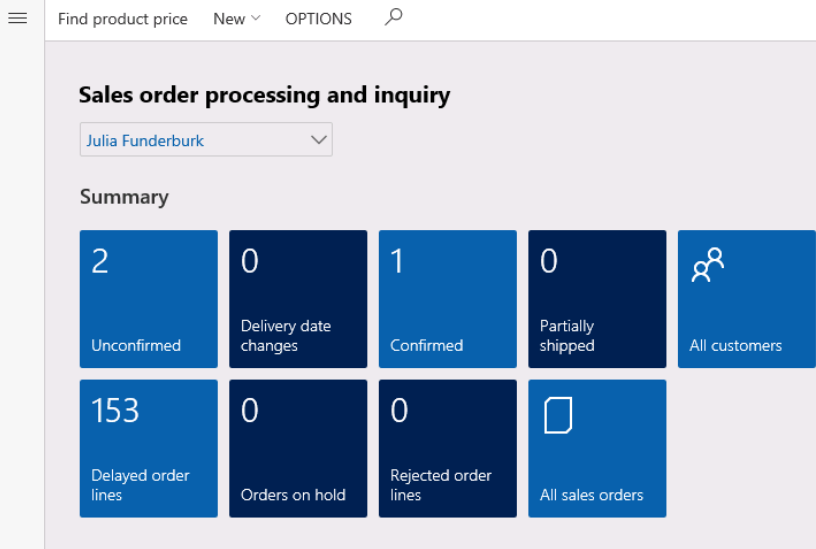
Each tile is a quick link to the underlying data that it summarizes.
The dashboard also shows lists with quick data under the heading Orders and favorites. You can view these same unconfirmed orders right here.
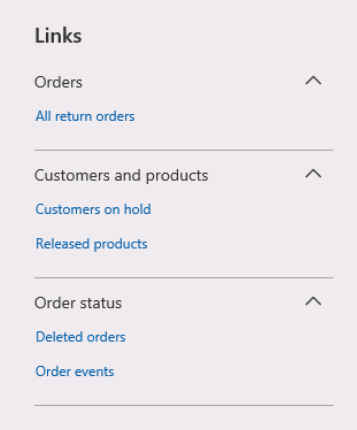
Finally, at the far right, you can see a group list of Links.
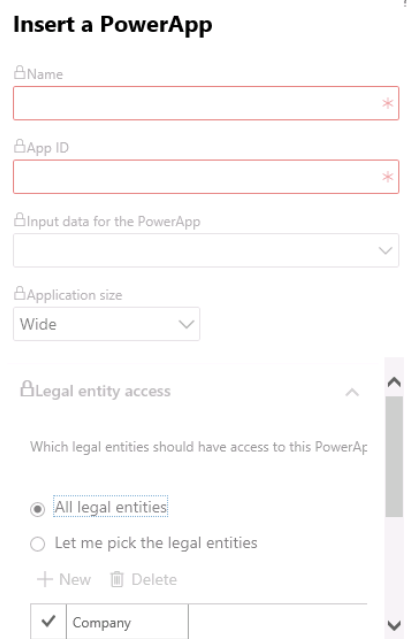
You may customize the dashboard as well, if you've written a Power App. Select Options and Personalize this form.
You may hide parts of the form, add fields, and Add a PowerApp.
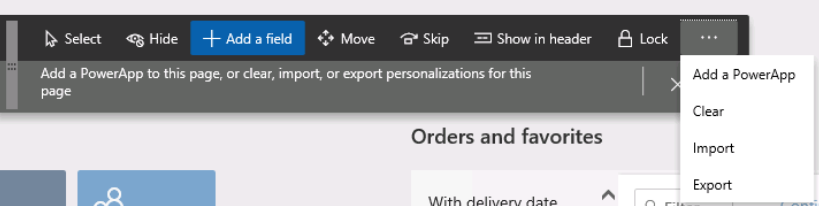
For a PowerApp, many options are available – the name, input data, size, and which legal entities it pulls data from.