Explore extended events
The extended events engine in Azure SQL is a lightweight and powerful monitoring system that allows you to capture granular information about activity in your databases and servers. The monitoring solutions on the Azure platform allow you to easily configure powerful monitoring for your environment and provide automated responses to error conditions.
Extended events build on the functionality of SQL Server Profiler by allowing you to trace queries and by exposing additional data (events) that you can monitor. Some examples of issues you might troubleshoot with Extended Events include:
- Troubleshooting blocking and deadlocking performance issues.
- Identifying long-running queries.
- Monitoring Data Definition Language (DDL) operations.
- Logging missing column statistics.
- Observing Memory Pressure in your database.
- Long-running physical I/O operations.
The extended event framework also allows you to use filters to limit the amount of data you collect in order to reduce the overhead of data collection, and allows you to more easily identify your performance problem by targeting your focus onto specific areas.
Below is an example of an extended event session created on Azure SQL Database:

In the image above, xe_deadlocks is the name an extended event session running on AdventureWorks database (on the left side of the image). The event_counter target node, which is under your event session node, counts the number of occurrences of each event in the event session. To view the target data in the SSMS Object Explorer, you can right-click the target node, and then select View Target Data. SSMS displays the data as we see on the left side of the image, and the count results for each event.
For more information about extended events on Azure SQL Database, see Extended events in Azure SQL Database.
What can I monitor with extended events?
Extended events cover the full surface area of SQL Server, and are divided into four channels, which define the audience of an event.
- Admin - Admin events are targeted for end users and administrators. The events included indicate a problem within a well-defined set of actions an administrator can take. An example of this is the generation of an XML deadlock report to help identity the root cause of the deadlock.
- Operational - Operational events are used for analysis and diagnostics or common problems. These events can be used to trigger an action or task based on an occurrence of the event. An example of an operational event would be a database in an availability group changing state, which would indicate a failover.
- Analytic - Analytic events are typically related to performance events and are published in high volume. Tracing stored procedure or query execution would be an example of an analytic event.
- Debug - Debug events are not necessarily fully documented and you should only use them when troubleshooting in conjunction with Microsoft support.
Events are added to sessions, which can host multiple events. Typically, multiple events are grouped together in a session to capture a related set of information.
You can run the query below to obtain a list of the available events, actions, and targets:
SELECT
    obj.object_type,
    pkg.name AS [package_name],
    obj.name AS [object_name],
    obj.description AS [description]
FROM sys.dm_xe_objects  AS obj
    INNER JOIN sys.dm_xe_packages AS pkg  ON pkg.guid = obj.package_guid
WHERE obj.object_type in ('action',  'event',  'target')
ORDER BY obj.object_type,
    pkg.name,
    obj.name;
Create extended events session
You will see below the basic process of creating an extended events session using the New Session dialog from SQL Server Management Studio. You can get to this screen by expanding the Management node in SSMS, expanding the Extended Events node, right-clicking on Sessions, and selecting New Session.

The image above shows the New Session dialog for the extended events feature. You must first name the session. SQL Server provides numerous templates which are grouped into the following categories:
- Locks and Blocks
- Profiler Equivalents
- Query Execution
- System Monitoring
These predefined templates allow you to quickly get started with using extended events for monitoring. In this example, you will see events manually added to the session to walk you through all of the options, but when you are getting started, using a template can be an easy way to create a basic session.
You have a couple of check box options for when to start this session. You can choose to have your new session started whenever the server starts, and you can also choose to start the session as soon as it’s been created. Administrators can start, and stop extended event sessions at any time through the Extended Events node in SQL Server Management Studio. You also have the option of enabling causality tracking, which adds a globally unique identifier (GUID) and sequence number to the output of each event, which allows you to easily step through the order that the events occurred.

The image above shows the screen where you add the events to your session. An event represents a point of interest within the database engine code — these can represent purely internal system operations, or they can be associated with user actions like query execution. In the above example, you can see that the events sp_statement_completed, sql_batch_completed, and sql_statement_completed have been added to this event session. By default, this session would capture all instances of these events taking place on your instance. You can limit collection by clicking the configure button.

The event configuration screen allows for defining what data you are collecting as it relates to your events. Global fields, allow you to choose the data you are collecting, when your event occurs. Global fields are also known as actions, as the action is to add additional data fields to the event. These fields represent the data that is collected when the extended event occurs, and are common across most extended events. The image below shows the filter options for an extended event.
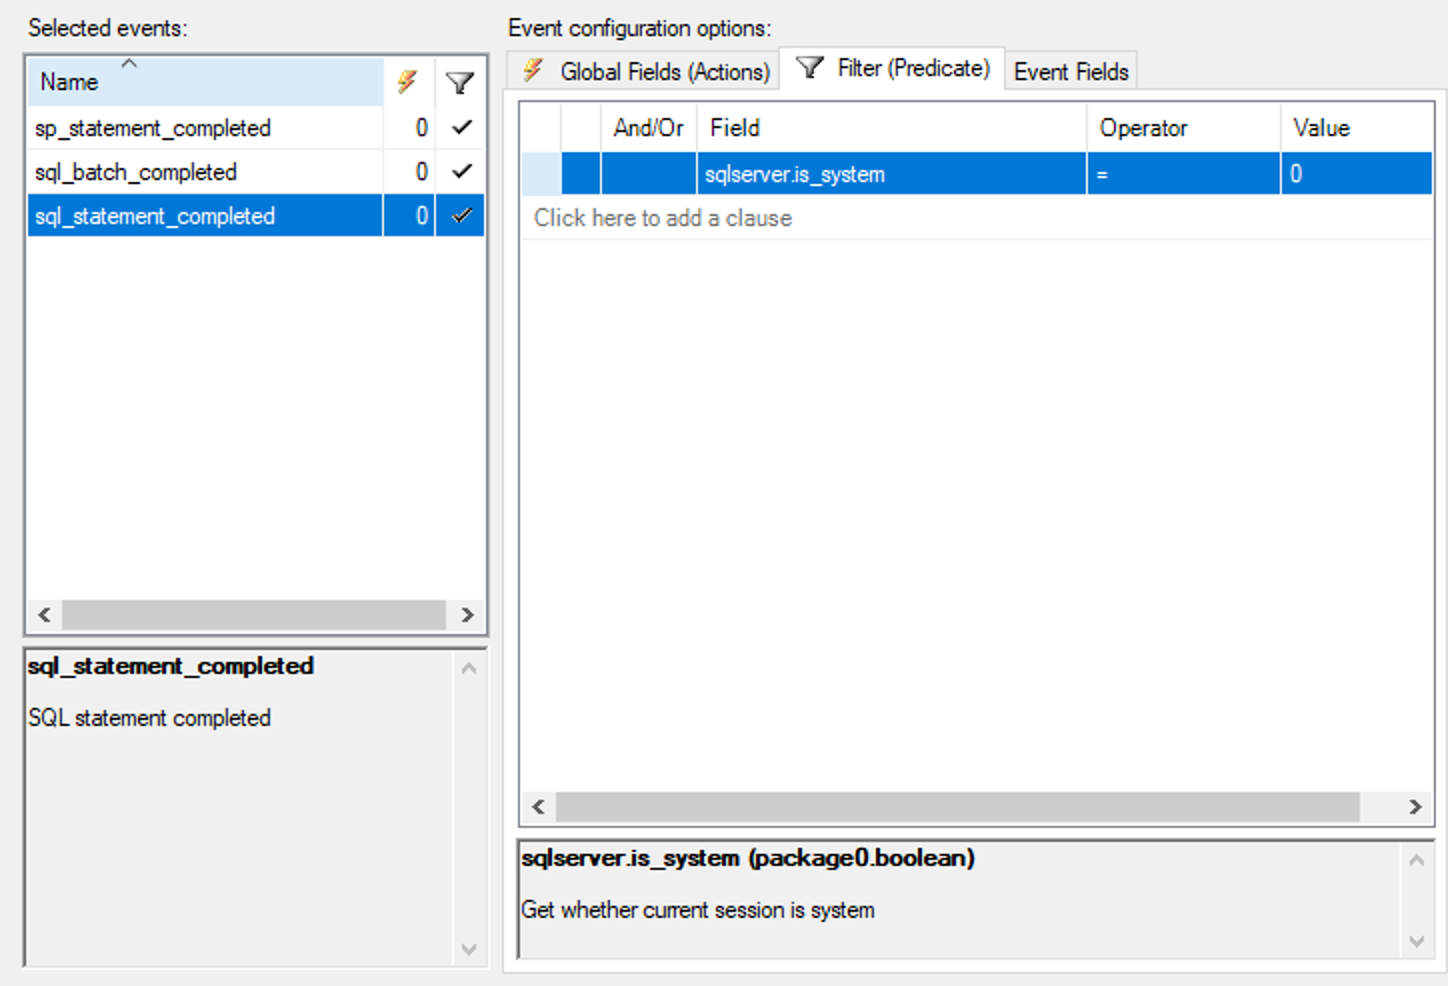
Filters are a powerful feature of Extended Events that allow you to use granular control to capture only the specific occurrences of the event you want to capture. In this example, you can see that filter is being applied on the field sqlserver.is_system where it is equal to zero, which indicates that the query is not an internal operation. In other words, the session will not capture completion of statements that are submitted by system connections, and we only want to capture statements submitted by users or user applications.
Filters apply to a single field on a single event. If you want to make sure that you aren't tracing system activities for any events, you'll need a separate filter for each: for the sql_statement_completed event, for the sql_batch_completed event, and for the sp_statement_completed event.
It is good practice to configure a filter for each event that you are capturing. This helps improve the efficiency of data collection, and allows you to narrow the focus of your search.
The image below shows the event fields that are collected. These are specific to the event being triggered, and can include optional fields for collection. In the above event, you can see the optional collection options are statement, and parameterized_plan_handle.

Once you have defined an event session, you will define a storage target, as shown in the image below.

An extended event session has a target — a target can be simply thought of as a place for the engine to keep track of occurrences of an event. Two of the more common targets are event file which is a file on the file system that can store events, and in Azure SQL PaaS offerings this data is written to a blob storage. Another common target is the ring buffer which is within SQL Server's memory. The ring buffer is most commonly used for live observation of an event session as it’s a circular buffer, and data is not persisted beyond a session. Most targets process data asynchronously, which means that the event data is written to memory before being persisted to disk. The exception is the Event Tracing for Windows target (ETW), and Event Counter targets, which are processed synchronously.
The following table contains information, and uses for each type of Extended Events target.
| Target | Description | Processing |
|---|---|---|
| Event Counter | Counts all events that occurred during an Extended Event session. This is used to obtain information about workload characteristics about a workload without the overhead of a full event collection. | Synchronous |
| Event File | Writes event session output from memory onto persistent file on disk. | Asynchronous |
| Event Pairing | Many events that generally occur in pairs (e.g. lock acquire, lock release), and this collection can be used to identity when those events do no occur in a matched set. | Asynchronous |
| Event Tracing for Windows (ETW) | Used to correlate SQL Server events with the Windows OS event data. | Synchronous |
| Histogram | This is similar to event counter, which counts the occurrences of an event. The difference is that the histogram can count based on a specific event column or action. | Asynchronous |
| Ring Buffer | Used to hold data in memory. Data is not persisted to disk and maybe frequently flushed from the buffer | Asynchronous |
Alternatively, you can create an extended events session using T-SQL. The following T-SQL commands provide an example on how to create an extended events session:
IF EXISTS (SELECT * FROM sys.server_event_sessions WHERE name='test_session')
    DROP EVENT session test_session ON SERVER;
GO

CREATE EVENT SESSION test_session
ON SERVER
    ADD EVENT sqlos.async_io_requested,
    ADD EVENT sqlserver.lock_acquired
    ADD TARGET package0.etw_classic_sync_target (SET default_etw_session_logfile_path = N'C:\demo\traces\sqletw.etl' )
    WITH (MAX_MEMORY=4MB, MAX_EVENT_SIZE=4MB);
GO
Event sessions can be scoped to a server or a database. In the example shown above, you are adding two events, and using the Event Tracing for Windows (ETW) path with a file location. After you create the session, you’ll have to start it. You can do this through T-SQL, and ALTER the session using the STATE option, or you can use SQL Server Management Studio for it.