Understand the .NET debugger in Visual Studio Code
In the previous unit, you learned that a debugger helps you control your program's execution and observe its state. In this section, you'll learn how to do both of those tasks in Visual Studio Code.
Let's start by learning how to configure the Visual Studio Code debugger to use it with .NET.
Configure Visual Studio Code for .NET debugging
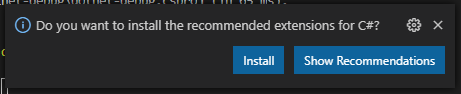
The first time you open a C# file in Visual Studio Code, you'll receive a prompt to install recommended extensions for C#.
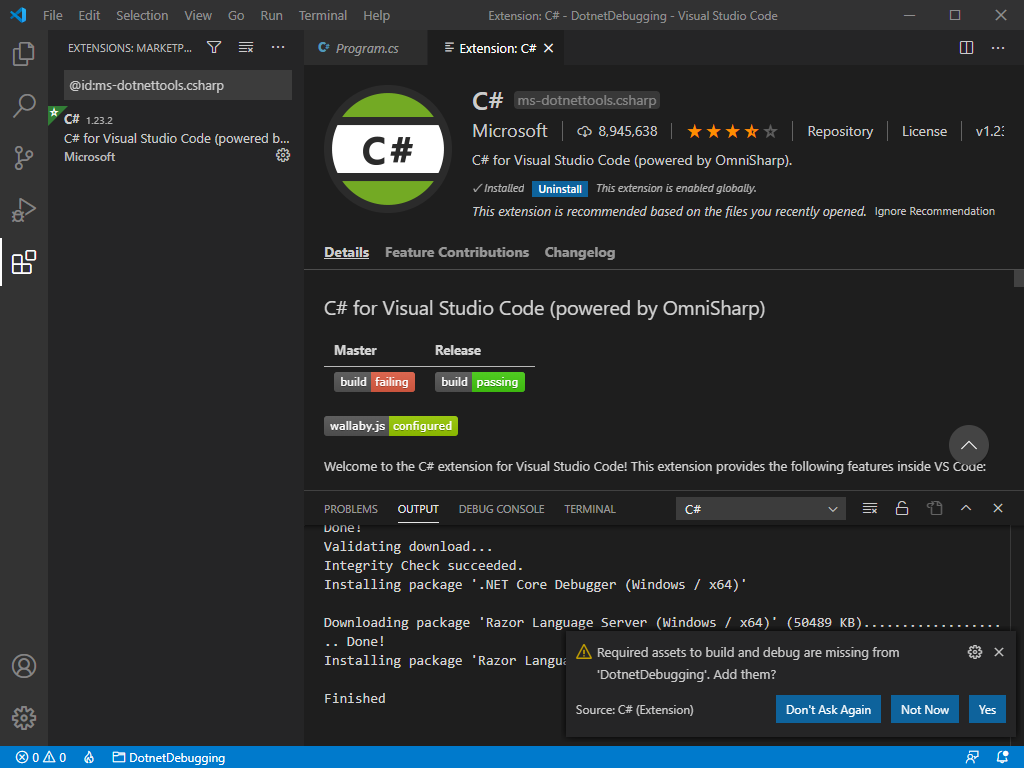
Visual Studio Code will install the C# extension and show an additional prompt to add required assets to build and debug your project.
Note
C# language support in Visual Studio Code is an optional installation from the Marketplace. Visual Studio Code automatically prompts you to install this extension when you open a C# file if you haven't yet. If you're having problems building or debugging your .NET application in Visual Studio Code, you should verify that your project has the required assets for C# language support.
Breakpoints
As you learned in the previous unit, a debugger helps you analyze and control your program's execution. When you start the Visual Studio Code debugger, it immediately begins executing your code. Because your code is executed quickly, you need to be able to pause the program on any statement. You'll use breakpoints to do that.
You can add a breakpoint in Visual Studio Code by clicking to the left side of the line number on the line you want to break. You should see a red circle after the breakpoint is enabled. To remove it, select the red circle again.

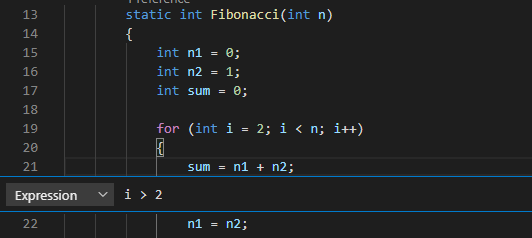
If you right-click to add a breakpoint, you can also select Add Conditional Breakpoint. This special kind of breakpoint allows you to enter a condition for breaking execution. This breakpoint will only be active when the specified condition is met. You can also modify an existing breakpoint by right-clicking it and selecting Edit Breakpoint.
Visual Studio Code debugger overview
After you've set up your breakpoints and started your app, new information panels and controls appear on the screen.
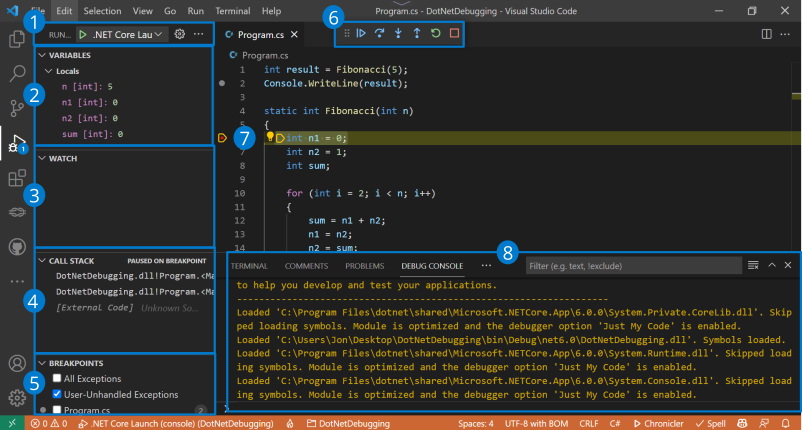
- Debugger launch controls
- Variables state
- Watched variables state
- Current call stack
- Breakpoints
- Execution controls
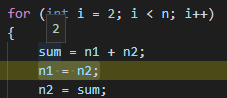
- Current execution step
- Debug console
Debugger launch controls
At the top of the sidebar, you can find the launch controls:
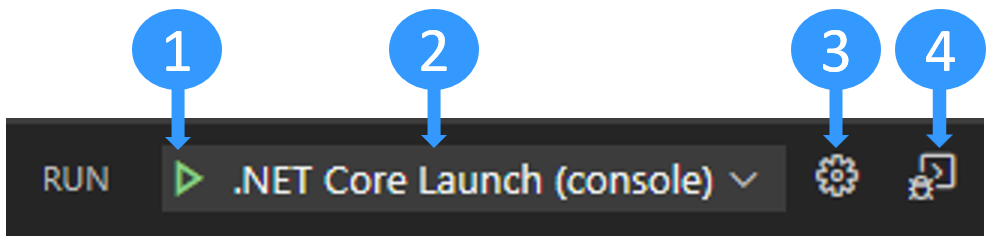
- Start debugging.
- Select the active launch configuration.
- Edit the
launch.jsonfile. Create it if you need to. - Open the debug terminal.
View and edit your variables state
When you analyze a program defect's cause, watch your variables state to look for unexpected changes. You can use the Variables panel to do that.
Your variables are shown organized by scope:
- Local variables are accessible in the current scope, usually the current function.
- Global variables are accessible from everywhere in your program. System objects from the JavaScript runtime are also included, so don't be surprised if you see a lot of stuff in there.
- Closure variables are accessible from the current closure, if any. A closure combines the local scope of a function with the scope from the outer function it belongs to.
You can unfold scopes and variables by selecting the arrow. When you unfold objects, you can see all the properties defined in the object.
It's possible to change a variable's value on the fly by double-clicking the variable.
By hovering over a function parameter or a variable directly in the editor window, you can also peek at its value.
Watch variables
It can be tedious to search for a variable state every time you want to track it across time or different functions. That's where the Watch panel comes in handy.
You can select the Plus button to enter a variable name or an expression to watch. As an alternative, you can right-click a variable in the Variables panel and select Add to watch.
All expressions inside the watch panel are updated automatically as your code runs.
Call stack
Every time your program enters a function, an entry is added to the call stack. When your application becomes complex and you have functions called within functions many times, the call stack represents the trail of functions calls.
It's useful to find the source of an exception. If you have an unexpected crash in your program, you'll often see something in the console like the following example:
Unhandled exception. System.IndexOutOfRangeException: Index was outside the bounds of the array.
   at OrderProcessor.OrderQueue.ProcessNewOrders(String[] orderIds) in C:\Users\Repos\OrderProcessor\OrderQueue.cs:line 12
   at OrderProcessor.Program.Main(String[] args) in C:\Users\Repos\OrderProcessor\Program.cs:line 9
The group of at [...] lines under the error message is called a stack trace. The stack trace gives the name and origin of every function that was called before ending up with the exception. It can be a bit difficult to decipher, because it also includes internal functions from the .NET runtime.
That's where the Visual Studio Code Call stack panel comes in handy. It filters out unwanted information to show you only the relevant functions from your own code by default. You then can unwind this call stack to find out where the exception originated from.
Breakpoints panel
In the Breakpoints panel, you can see and toggle all the breakpoints you placed in your code. You can also toggle options to break on caught or uncaught exceptions. You can use the Breakpoints panel to examine your program state and trace back the source of an exception by using the Call stack when one occurs.
Control execution
You can control the execution flow of your program by using these controls.

From left to right, the controls are:
- Continue or pause execution: If execution is paused, it will continue until the next breakpoint is hit. If your program is running, the button switches to a pause button that you can use to pause execution.
- Step over: Executes the next code statement in the current context.
- Step into: Like Step over, but if the next statement is a function call, move on to the first code statement of this function (same as the
stepcommand). - Step out: If you're inside a function, execute the remaining code of this function and jump back to the statement after the initial function call (same as the
outcommand). - Restart: Restart your program from the beginning.
- Stop: End the execution and exit the debugger.
Use the debug console
You can show or hide the debug console by selecting Ctrl+Shift+Y for Windows and Linux. Select Cmd+Shift+Y for Mac. You can use the debug console to visualize your application console logs. You can also use it to evaluate expressions or execute code in the current execution content, like commands or variable names in the built-in .NET debugger.
You can enter a .NET expression in the input field at the bottom of the debug console, then select Enter to evaluate it. The result displays directly in the console.
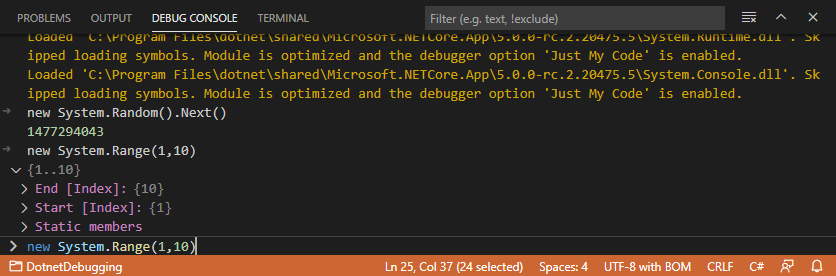
By using the debug console, you can quickly check a variable value, test a function with different values, or alter the current state.
Note
While the debug console is very useful for executing and evaluating .NET code, it can be a little confusing when you're trying to execute or debug a .NET Console application because the debug console doesn't accept terminal input for a running program.
To handle terminal input while debugging, you can use the integrated terminal (one of the Visual Studio Code windows) or an external terminal. For this tutorial, you use the integrated terminal.
Open .vscode/launch.json.
Change the
consolesetting tointegratedTerminalfrom:"console": "internalConsole",To:
"console": "integratedTerminal",Save your changes.
In the next unit, you'll learn how to use the debugger to fix the bug in the Fibonacci code we saw previously.