Describe using AI Insights to spot trends and anomalies
One challenge that organizations have, is being able to easily identify trends and detect anomalies as they occur. For example, many retail organizations see an increase in sales during the month of December over the holiday season. This uptick in sales is expected, but what happens if sales were down during that month, or if they were higher in August than normal? It's important to identify these anomalies as quickly as possible so you can take the necessary action.
Power BI’s insights feature helps organizations easily identify insights such as anomalies and trends in your data as you interact and consume elements such as reports, dashboards, and visualizations. It notifies you if there are interesting insights and provides explanations for them. It works out-of-the-box on any report, so you can automatically start getting insights from your reports without any setup.

Power BI has multiple insights features that use artificial intelligence (AI):
Insights for reports: Analyzes data and finds anomalies and trends in your data as you interact with reports.
Insights for individual visuals: Analyzes and explains the fluctuations of data points in visuals.
Insights for dashboard tiles: Looks at the data being used to render that tile and presents them in interactive visuals.
Quick Insights for datasets: Automatically generate data insights on a dataset in the Power BI service.
AI Insights for data models in Power Query: Provide access to pretrained machine learning models from Azure Cognitive Services.
Notifications
Notifications are an important part of the Insights capabilities in Power BI. As you're working on Power BI elements such as reports, Power BI automatically runs insights analysis. When Power BI identifies insights, you're presented with a notification. You can choose to either see the insights or ignore them. Notifications are a great way to proactively interact with suggested insights to ensure that you're not missing anything important such as if sales in a specific region increased. Top insights are those insights that are noteworthy, based on factors like recency and significance of the trend or anomaly.

Get insights on reports and visuals
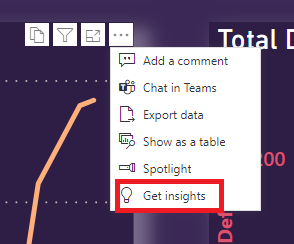
The notification capabilities alert and notify you of insights as you're working on reports. There are also many scenarios where you may just be able to get insights as you walk through some of the different elements. As you're working with Power BI reports and visuals, you can select Get insights to open the Insights pane.

The pane only shows insights about the current report page, and it updates when you select a different page on the report. As you work with individual visualizations, you can select More options (...) in the upper-right corner of a visual, and then Get insights to see insights about just that visual.
Insights
The Insights pane currently shows three types of insights:
Anomalies: Represents something that is out of the ordinary from what is expected. For example, a smart thermostat that suddenly reads the temperature as 100 F when it's typically 72 F would be considered an anomaly.
Trends: Represents a pattern that is found in time-series datasets. For example, if a company’s sales are steadily increasing through the month of April that would represent a trend.
Key Performance Indicator (KPI) analysis: Helps you evaluate the current value against a defined target. For example, a company might set a sales goal at 1.2 million, but currently they are at 1 million.
Anomalies
An anomaly is an abnormality in time-series data, such as unexpected spikes and dips in the data. An algorithm computes a boundary around what is considered a normal or expected value. Any value found outside this boundary is marked as an anomaly.
There are three types of anomaly insights:
Significant anomaly: The anomaly has a high score. Anomaly score indicates how far the point is from the expected range.
Recent anomaly: The most recent anomaly in the measure.
Anomaly summary: This insight type summarizes multiple anomalies in the measure.
When an anomaly in your data is flagged, Power BI runs an analysis across the different dimensions in your data model to look for spikes or dips in the measure that correlates to the anomaly. They're shown as possible explanations ranked by strength.

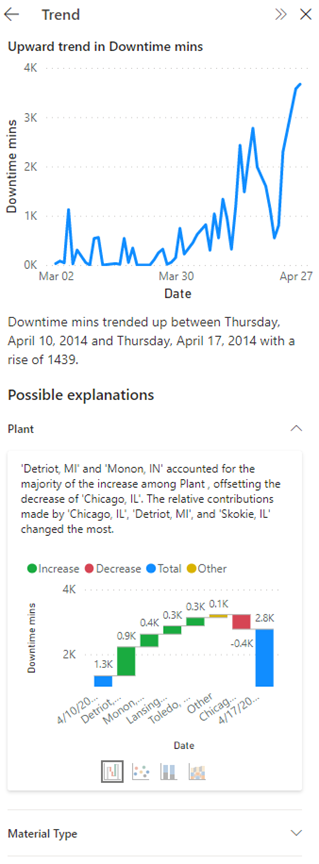
Trends
A trend occurs when there's a prolonged increase or decrease in time-series data. There are a series of steps the Power BI algorithm uses to find meaningful trends. It first performs data smoothening, interpolation, and time-series sampling. The trends are then identified for statistical significance based on the slope and length of a change in value. The algorithm removes noise like seasonality and outliers. For example, if sales jump in December, the algorithm doesn't mark that as a noteworthy trend because it's common for sales to jump around the holidays.
There are four main trends flagged:
Long trend: The trend is significant and is the longest trend within a single series or across multiple series in a visual.
Steep trend: The trend is significant and is the steepest trend within a single series or across multiple series in a visual.
Recent trend: The trend is significant and is the most recent trend within a single series or across multiple series in a visual.
Trend reversal: Recent trend in a single series or across multiple series in a visual where the reversal is significant, compared to the previous trend segment.
When a trend in your data is flagged, Power BI looks for and identifies the categories that most influenced the increase or decrease in the identified trend. Possible explanations are ranked based on the relative contributions from different categories to the increase or decrease in trend.
KPI analysis
KPI analysis with a target looks at the variance of the current value to its target. It's considered significant if the variance is high or low compared to other segments. KPI analysis without a target looks at the value itself and flags ones that are high or low compared to other segments.
For KPI analysis explanations, Power BI looks for and identifies the categories that have higher or lower than anticipated values. For KPI analysis with target, possible explanations are ranked based on Z-scores of the difference of the value from the target. Whereas for KPI analysis without a target, possible explanations are ranked based on the Z-scores of the value itself.