Import data into Power BI Desktop with the Cost Management data connector to better understand your Azure spending
You use the Microsoft Cost Management connector for Power BI Desktop to make powerful, customized visualizations and reports that help you better understand your Azure spending. The connector is a wrapper for an API that allows Power BI to communicate with Azure. It connects to your Azure account, imports your Cost Management data, and it uses a set of pre-built actions and triggers to help you build your own apps and reports. The connector currently supports customers with a Microsoft Customer Agreement or an Enterprise Agreement (EA).
The connector uses OAuth 2.0 for authentication with Azure and identifies users who are going to use the connector. Tokens generated in this process are valid for a specific period. Power BI preserves the token for the next time you sign in. OAuth 2.0 is the standard for the process that happens behind the scenes to ensure permissions are handled securely.
To connect, you must use one of the following account types. Other account types aren't supported.
- Enterprise Administrator account for Enterprise Agreements
- Billing account owner for Microsoft Customer Agreements
You must have Power BI Desktop installed.
Connect to Microsoft Cost Management
To connect using the Microsoft Cost Management connector in Power BI Desktop:
- Open Power BI Desktop.
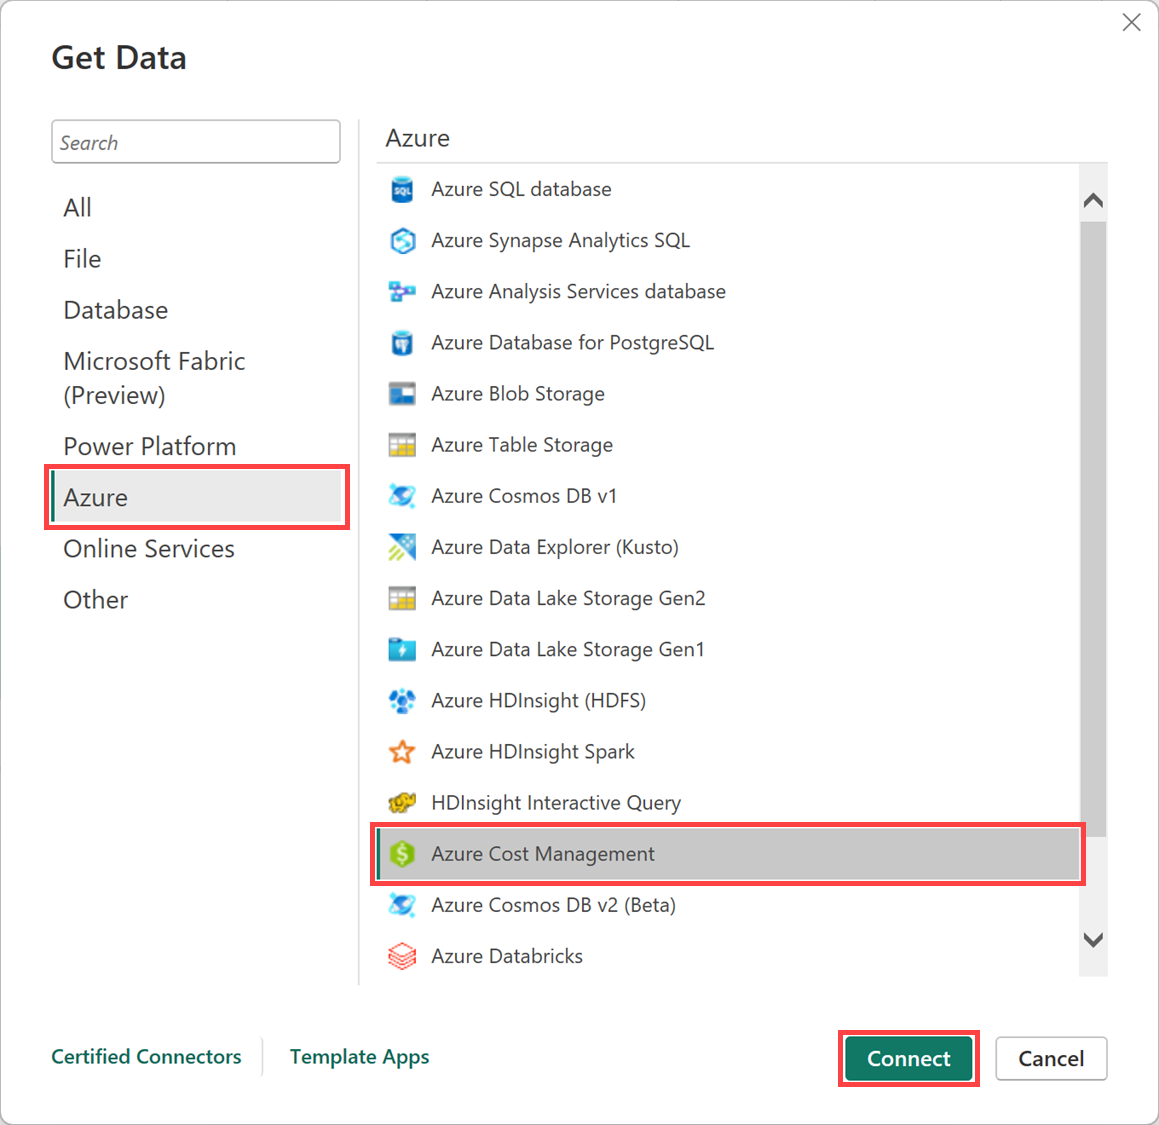
- In the Home ribbon, select Get Data.
- Select Azure from the list of data categories. You might need to select More at the end of the list to find the Azure option.
- Select Cost Management, then select Connect.
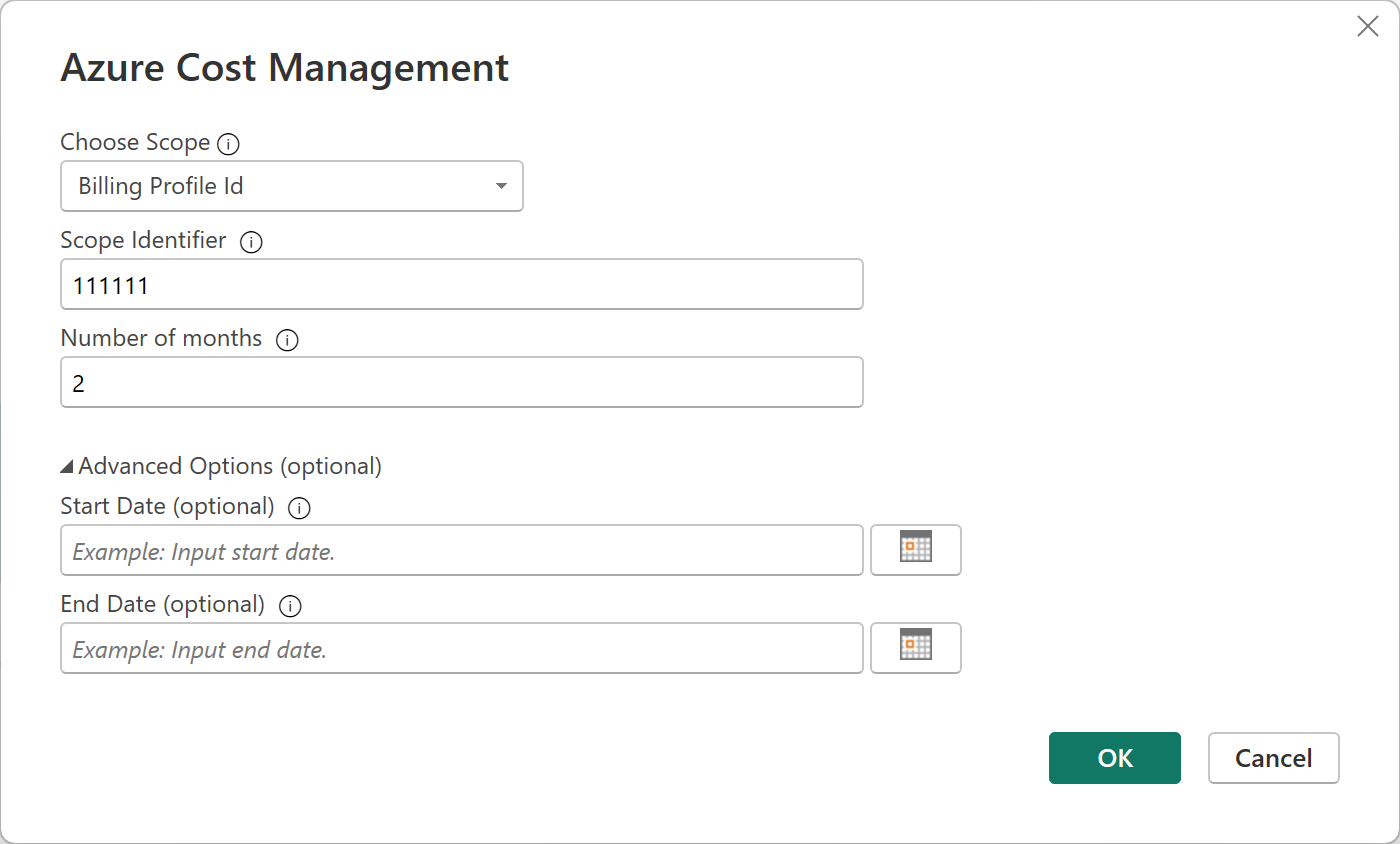
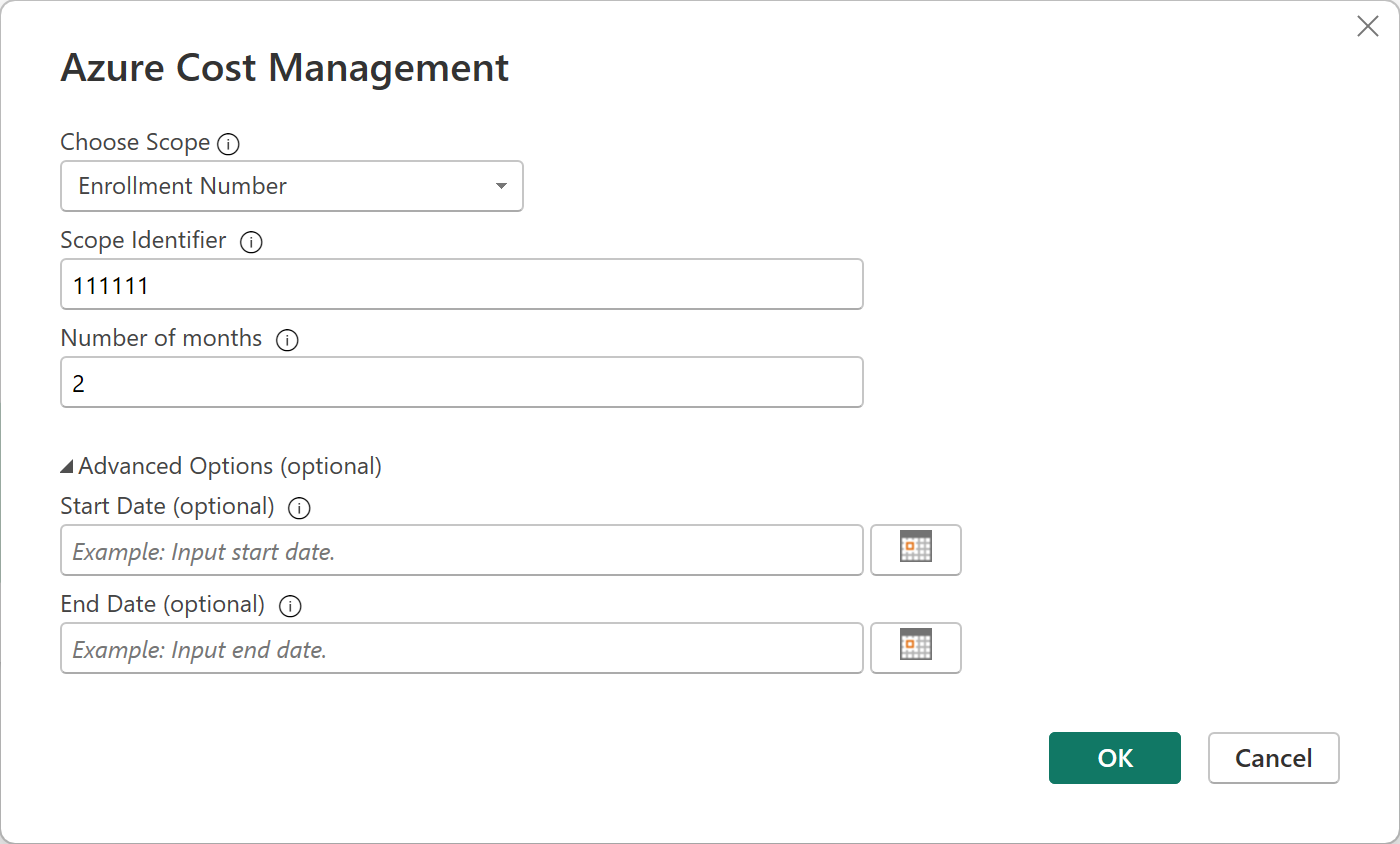
- In the dialog that appears for Choose Scope, select either your Billing Profile ID for Microsoft Customer Agreements, or your Enrollment Number for Enterprise Agreements (EA).
Connect with a Microsoft Customer Agreement account
To connect with a Microsoft Customer Agreement account, you can get your Billing profile ID from the Azure portal:
- In the Azure portal, navigate to Cost Management + Billing.
- Select your Billing profile.
- Under Settings in the menu, select Properties in the sidebar.
- Under General, copy the ID.
- In Power BI Desktop, select Billing Profile ID under Choose Scope and paste the billing profile ID from the previous step.
- Enter the number of months of data to get and select OK.
- When prompted, sign in with your Azure user account and password.
Connect with an Enterprise Agreement account
To connect with an Enterprise Agreement (EA) account, you can get your enrollment ID from the Azure portal:
- In the Azure portal, navigate to Cost Management + Billing.
- Select your billing account.
- On the Overview page, copy the Billing account ID.
- In Power BI Desktop, under Choose Scope, select Enrollment Number and paste the billing account ID from the previous step.
- Enter the number of months of data to get and then select OK.
- When prompted, sign in with your Azure user account and password.
Create a custom report with your data
We'll guide you through creating a simple report showing your costs over time.
After you successfully authenticate, a Navigator window appears with the following available data tables:
| Table | Description |
|---|---|
| Balance summary | Summary of the balance for Enterprise Agreements |
| Billing events | Event log of new invoices and credit purchases (Microsoft Customer Agreement only) |
| Budgets | Budget details to view actual costs or usage against existing budget targets |
| Charges | A month-level summary of Azure usage, Marketplace charges, and charges billed separately (Microsoft Customer Agreement only) |
| Credit lots | Azure credit lot purchase details for the provided billing profile (Microsoft Customer Agreement only) |
| Pricesheets | Applicable meter rates for the provided billing profile or EA enrollment |
| RI charges | Charges associated to your reserved instances over the last 24 months |
| RI recommendations (shared) | Reserved instance purchase recommendations based on all your subscription usage trends for the last 30 days |
| RI recommendations (single) | Reserved instance purchase recommendations based on your single subscription usage trends for the last 30 days |
| RI usage details | Consumption details for your existing reserved instances over the last month |
| RI usage summary | Daily Azure reservation usage percentage |
| Usage details | A breakdown of consumed quantities and estimated charges for the given billing profile on EA enrollment |
| Usage details amortized | A breakdown of consumed quantities and estimated amortized charges for the given billing profile on EA enrollment |
Select a table to see a preview dialog. You can select one or more tables by selecting the boxes next to their names. Select Load.
When the data you selected loads, the data tables and fields are shown in the Fields list.
To create a report:
- For this example, select Usage details, then select Load.
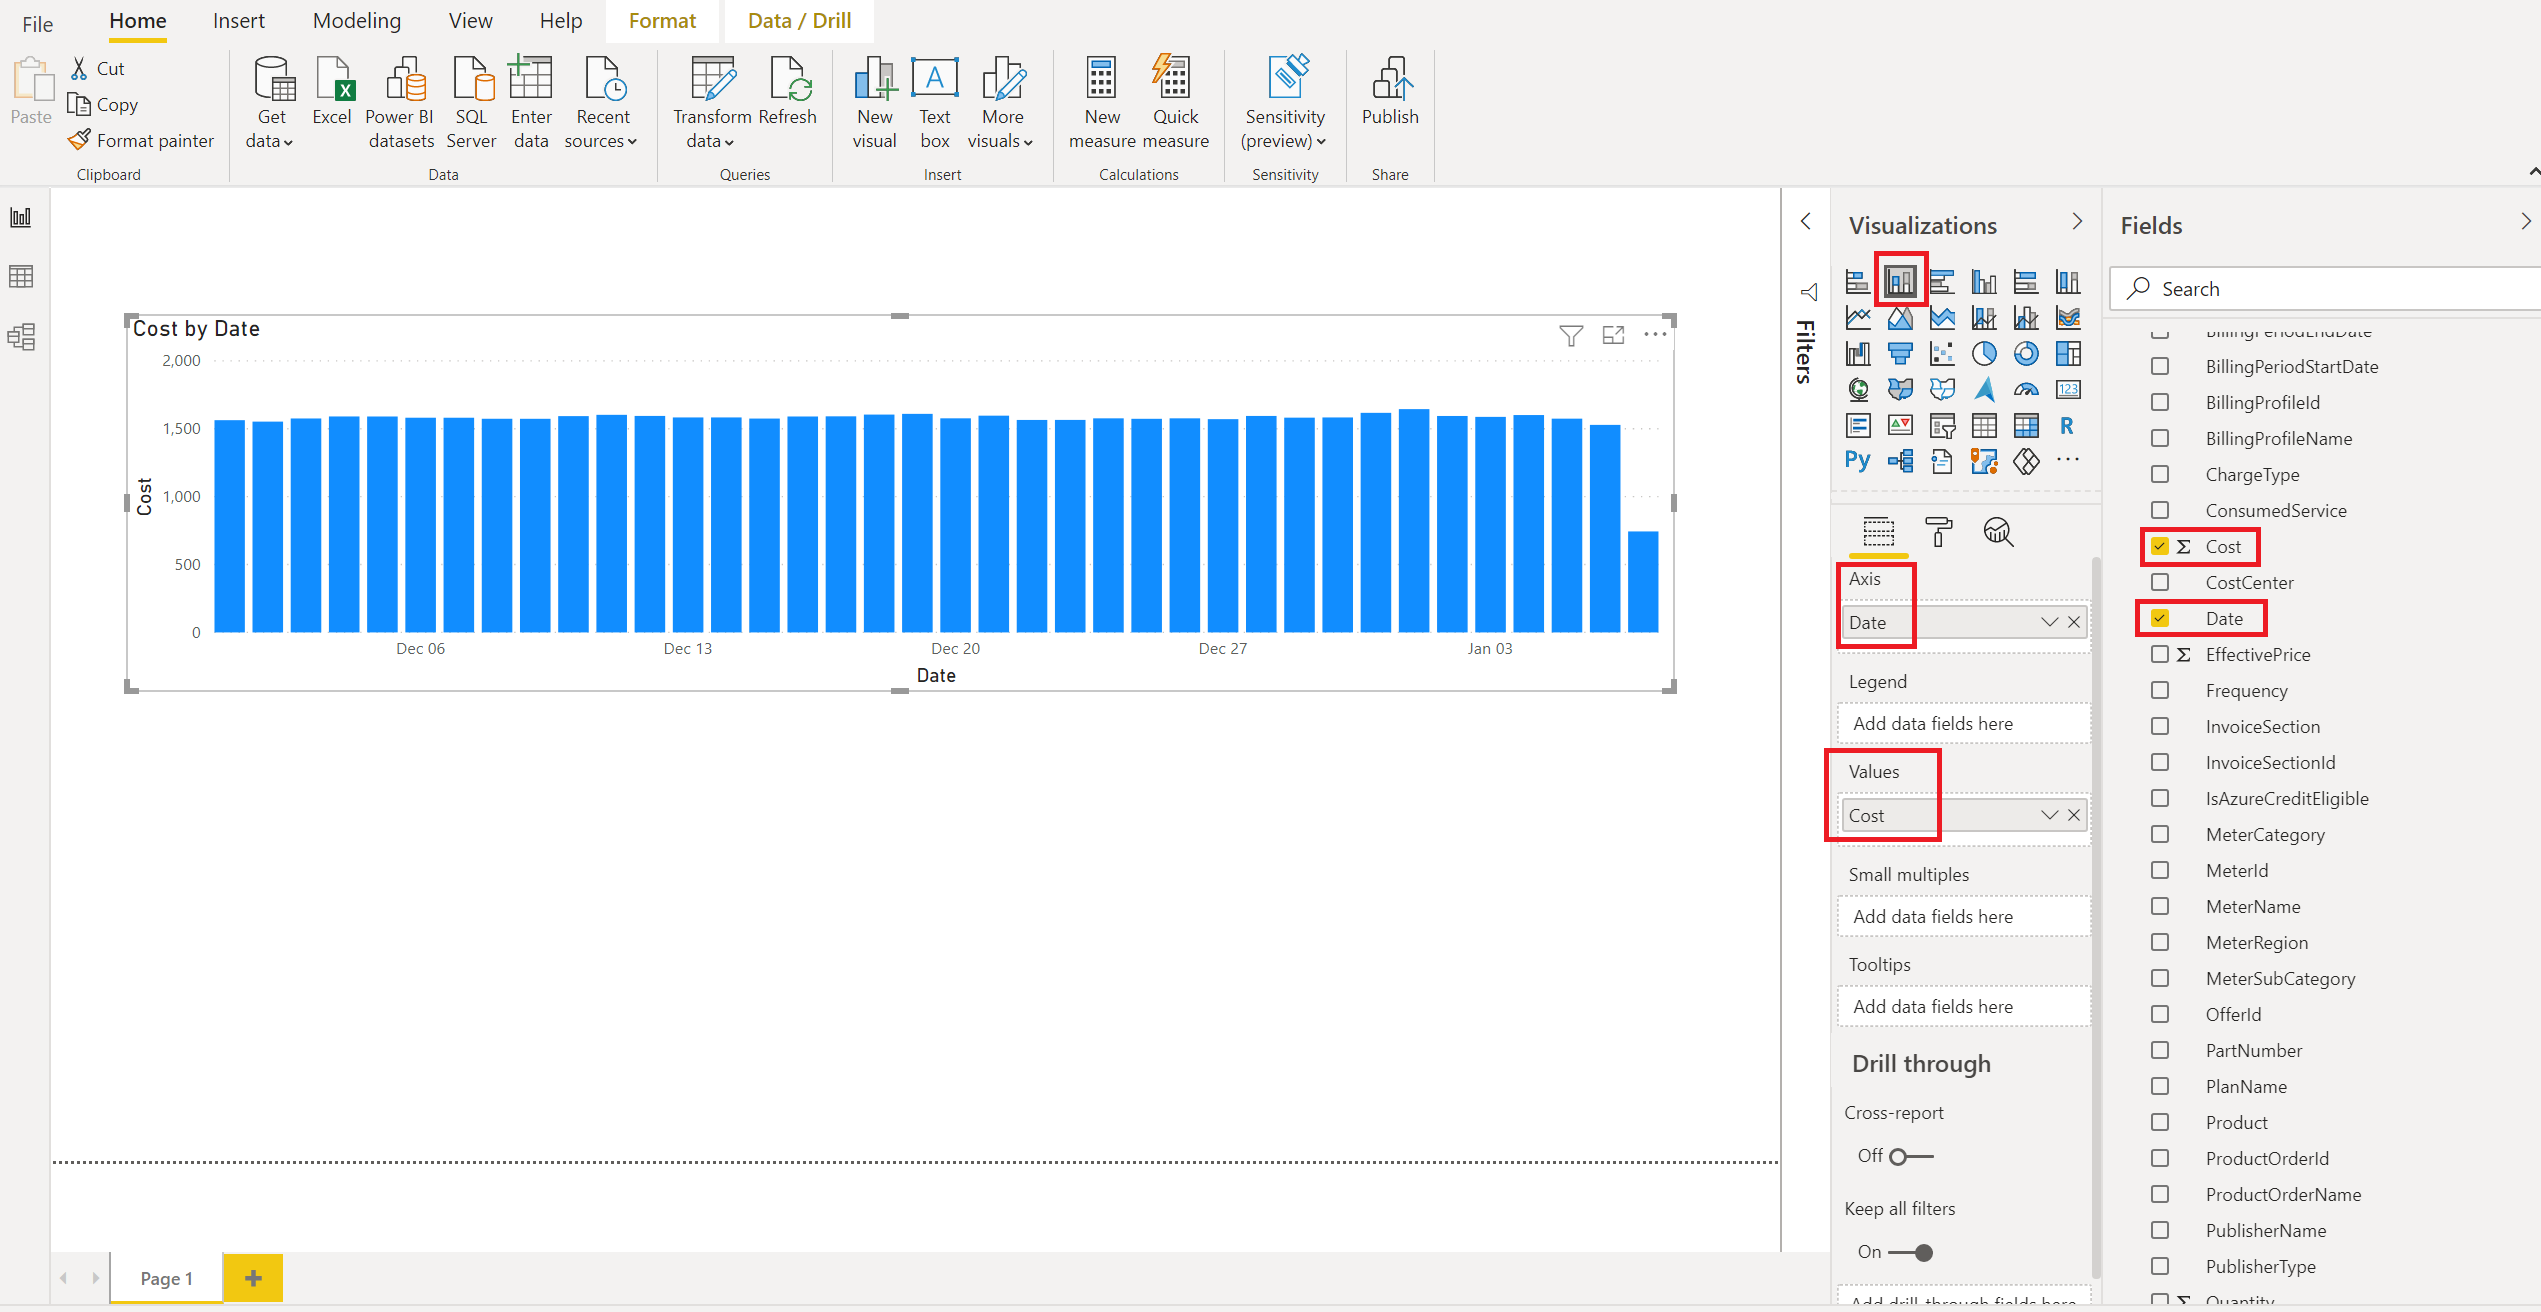
The Load box shows the status of your data import. It might take some time to load all your data. When the data is done loading, the Load box disappears. - Next, under Visualizations, choose a visualization to view. For this example, select Stacked column chart. Under Visualizations, various items become available. An empty chart is also inserted on to the page.
- In the Fields list, select and drag Cost to the Values area. The chart on the page is updated with data.
- Next, in the Fields list, select and then drag Date to Axis. The chart is updated and now shows costs over time.
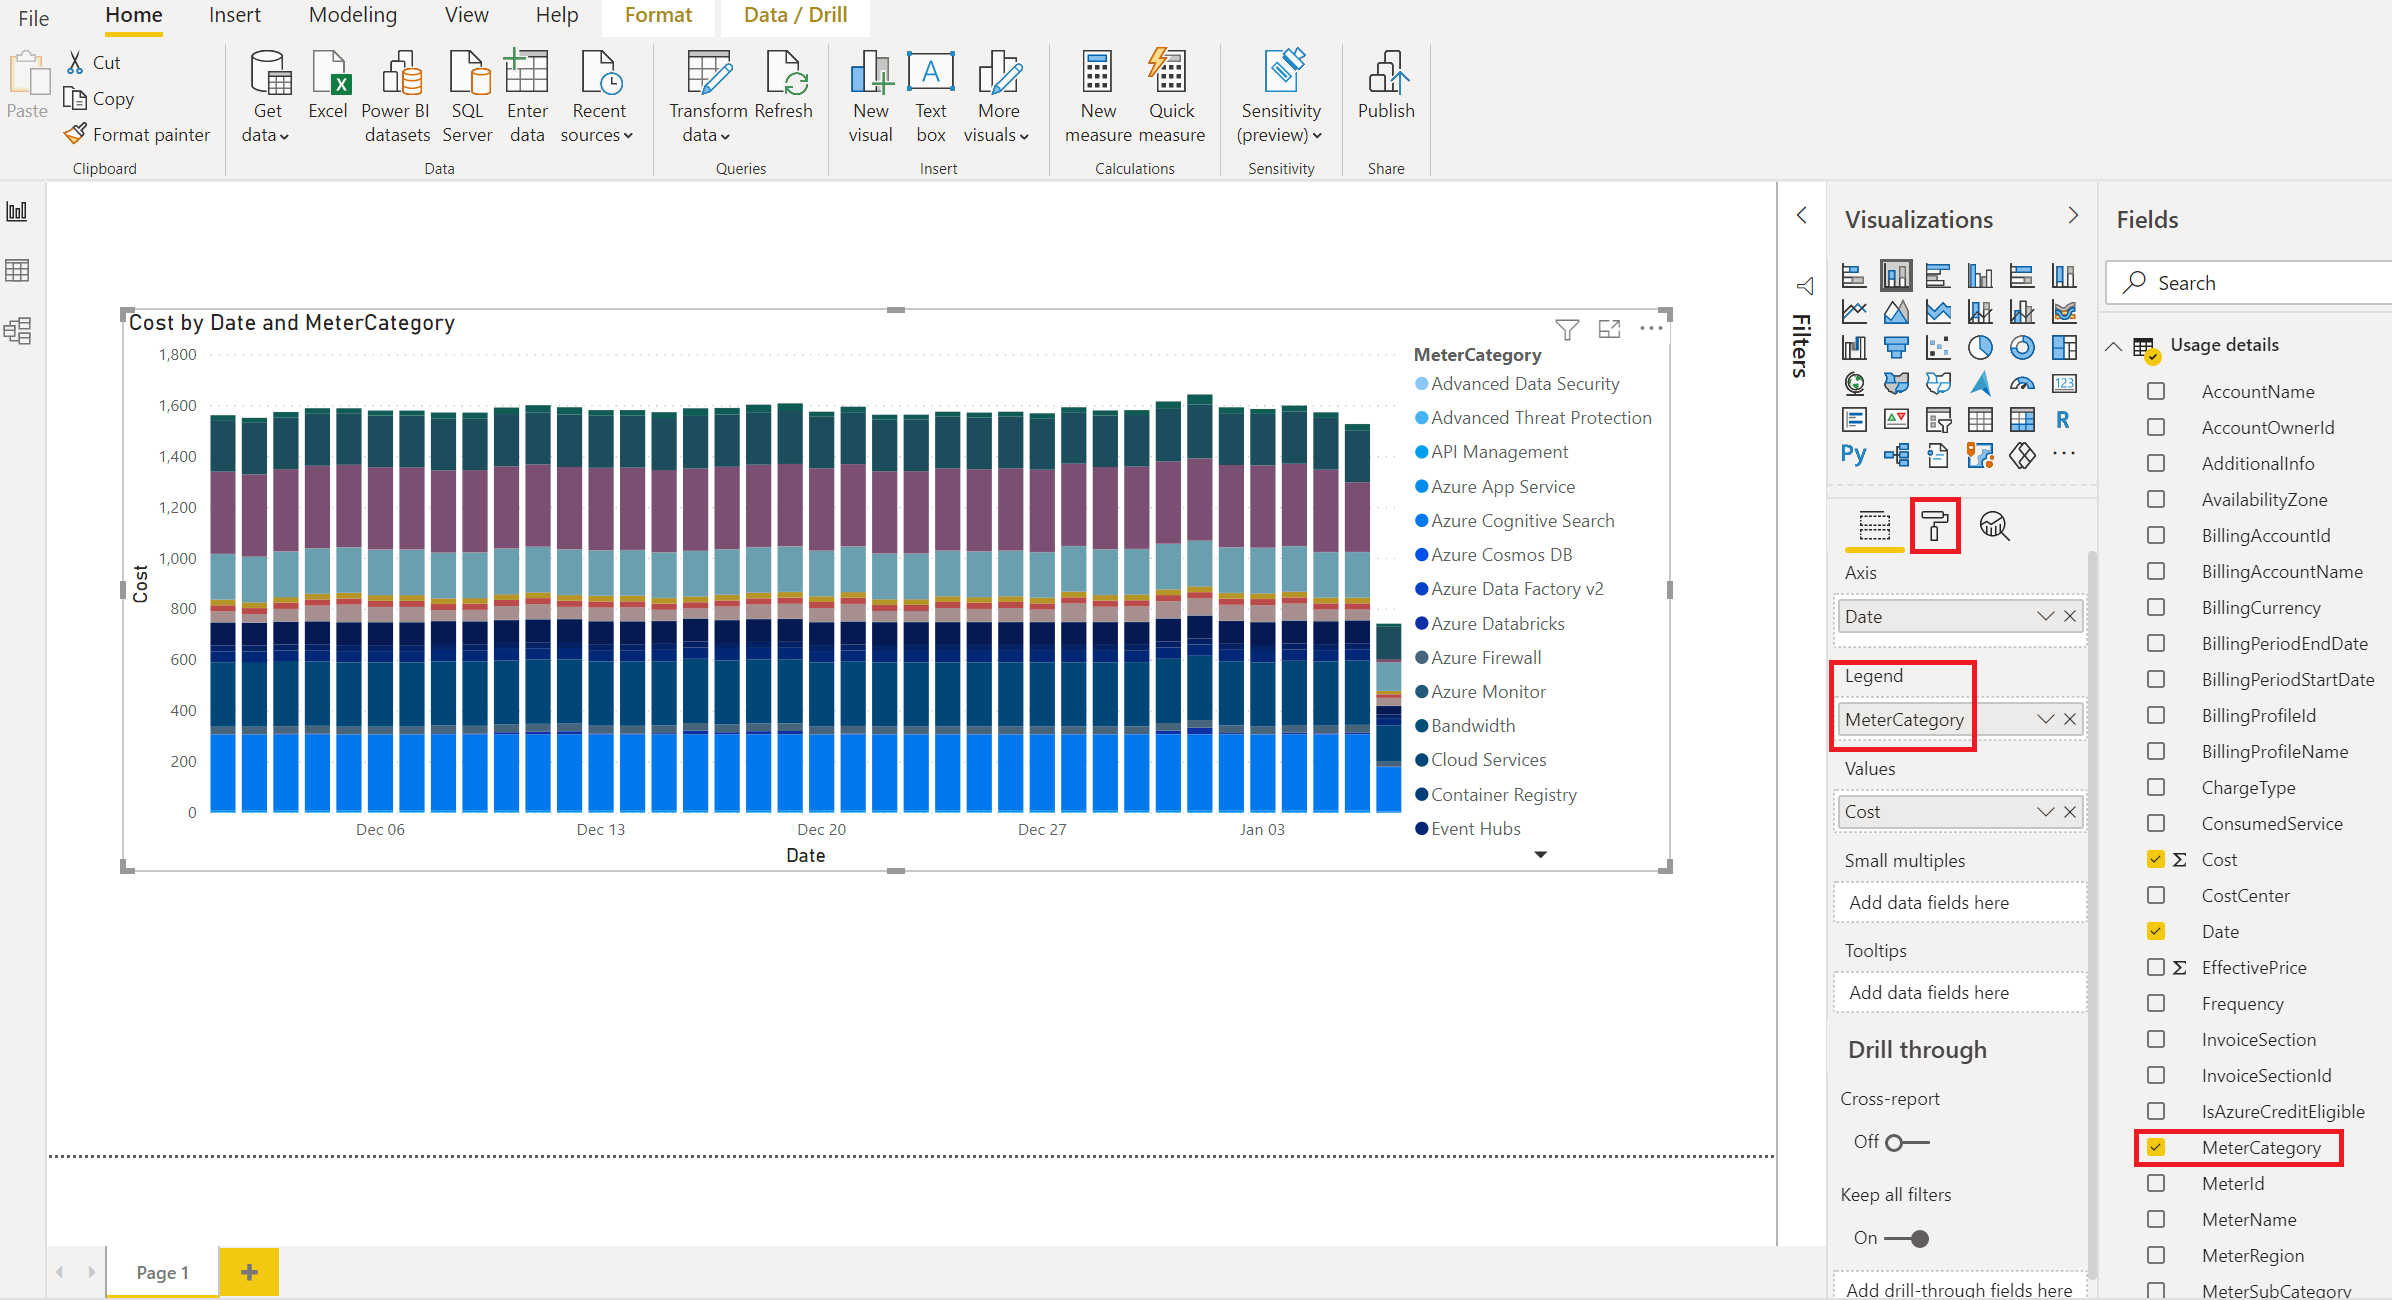
- In the Fields list, select and drag MeterCategory to the Legend area. The chart updates and shows the costs over time where each day shows the cost for each MeterCategory (Azure service).
- To better read values in the Legend, select Format (which looks like a paint roller symbol), then select Legend > Position > Right.
- Optionally, resize the chart if needed.


Now you have a simple report that shows your cost over time. Continue to explore other options and fields on your own to create reports that satisfy your needs.