Diagnose performance issues by using Trace parser
By using Trace parser, you can consume traces, and analyze performance in your finance and operations apps deployment. This ensures that you have an idea of what is currently happening in your deployed environments and helps ensure that business users have the response time that they need for their daily processes.
This unit explores how to use the Trace parser to identify any current issues that are deployed in finance and operations apps environments.
How to use Trace parser
Trace parser is available in the PerfSDK folder on your development environment deployments. When you have located the tool and installed it in your development environment, you can create traces by performing the actions that you want to analyze.
To capture a trace, you must first ensure that you have completed the list of tasks that you need to analyze to avoid having metadata and other tasks included in your trace. You must also add the System tracing user role to the user who needs to complete the trace. In the finance and operations user interface, go to System administration > Users > Users. From there, you can select the user and select Assign roles on the User's roles FastTab.
After you have added the System tracing user role, the assigned user can capture the trace. In the navigation bar at the top-right of the screen, select the question mark icon. In the drop-down menu that appears, select Trace. When the new screen appears, name the trace that you are going to capture and select Start trace. Perform all the actions that you need to capture and analyze before selecting Stop trace.
When you stop the trace, you can select Download trace, which will store the captured trace on your local machine, where you can analyze it with the desktop version of Trace parser; however, it cannot be uploaded later. If you choose Upload trace, Trace parser will store the trace in the cloud to download at a different time, but it will be automatically deleted after seven days. Alternatively, the trace can be manually deleted from the Captured traces page.
Tip
If your sequence of events for a trace takes more than a few minutes, we recommend that you take multiple, smaller traces to minimize the risk of losing data if the trace becomes too large to analyze in a timely manner.
Diagnose issues and analyze performance by using Trace parser
By using Trace Parser, you can identify performance issues. Some of these performance issues may include long-running X++ methods, time-consuming SQL queries, or client server calls.
The captured trace can be opened to diagnose issues and analyze performance of the tasks in multiple ways. The next step after downloading the trace file is to open the Trace parser on your developer environment or VHD. Trace parser is installed by default and is located in C:\Program Files (x86)\MicrosoftDynamicsAX\Microsoft.Dynamics.AX.Tracing.TraceParser.exe .
Note
Trace parser is only available on DevTest topology deployed environments, it is not available in Demo topology environments.
In the Trace parser, you can download and import the previously captured events. To do this, select the Download and import button in the Trace parser to import the ETL file.
To view the traces and analyze them, select the Timeline tab to see the timeline view. You can use the Select Grouping drop-down menu to group content that is based on a variety of categories and event types, such as Customer ID, username, Session name, and so on. The groupings will display timestamps of each event, total number of events, and the lowest event level in the grouping. You can also see the list of all events in a threaded or unthreaded view. Go to the Property grid for a selected event to see a timeline chart for all the selected events, filter events, and session analysis notes. In the Call tree view, under the Call tree tab, you will find the call tree for all X++ methods for the captured events. Additionally, on the X++ tab is a list of all the X++ methods, and you can sort them by fields such as inclusive/exclusive durations, RPC, or database calls.
Scenario:
Contoso USA users are experiencing performance issues when they try to post a payment journal. The time it has been taking for the journal to post is taking much longer than it should. As a developer for Contoso USA, you have been tasked to diagnose why posting payment journals is taking so long.
Follow these steps to investigate the performance issues:
- Login to finance and operations apps and start a trace from the Help and support menu.
- Name the trace.
- Select Start.
- Perform the business operation that you are diagnosing. In this case, you would post a payment journal.
- Stop the trace.
- Download the trace. It is important to keep in mind that when the trace is downloaded, it will be deleted.
- Select Upload trace. You should receive a message in the Action center that the trace has been uploaded.
- Return to the Tracing main menu
- Select Captured traces. The captured traces page will open with the trace you just captured.
- Now you can launch Trace Parser, import the trace and analyze.
Before you can analyze a trace, you need to download the Trace Parser. To download the trace parser application, follow these steps:
In your developer virtual machine, open File Explorer.
Find the Trace Parser .exe file. In most Tier 1 boxes, the download can be found in E:\AppRing3\10.0.8.10012\retail\Services\PerfSDK\Scripts.
When Trace Parser is downloaded, start it.
Register the database. To do this, specify the server name, and then name the database. See the following example:
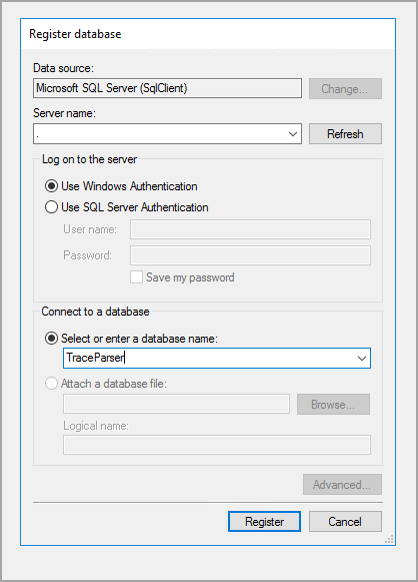
Select Register.
Select Yes when you are asked if you want to create the database.