Azure Stack HCI observability
Applies to: Azure Stack HCI, version 23H2
This article describes observability in Azure Stack HCI and the data sources through which it is achieved.
What is Azure Stack HCI observability?
Azure Stack HCI observability refers to the ability to monitor and understand the behavior of the Azure Stack HCI system.
Observability in Azure Stack HCI is important because it enables the collection of telemetry and diagnostic information from the system. This information helps Microsoft gain valuable insights into the system's behavior, which can be used to identify and fix potential problems.
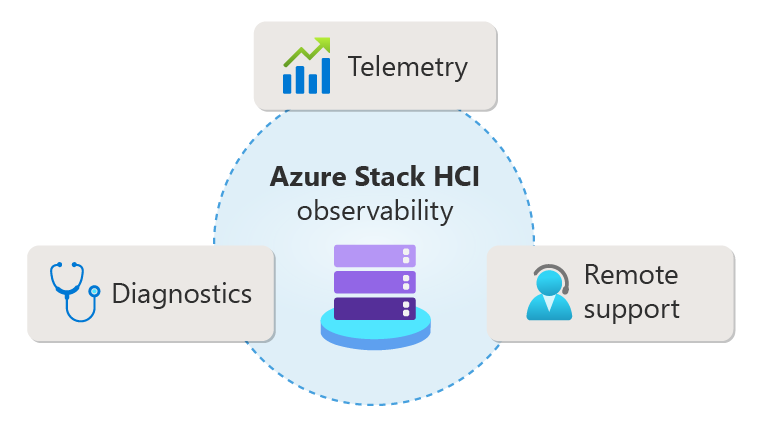
Observability in Azure Stack HCI is achieved through the following data sources:
Telemetry. This includes collection of telemetry and diagnostic information, which helps Microsoft gain valuable insights into the system's behavior. See Telemetry.
Remote support. This allows support engineers to get read-only remote access to clusters for first-step remediation. See Remote support.
Diagnostics. This includes the ability to collect diagnostic logs. See Diagnostics.

How is observability installed?
Observability and remote support are installed as part of the Azure Stack HCI deployment process. This allows the orchestrator automate many of the steps involved in the deployment process. The goal is to offer a simple setup process that takes care of all the components, including observability.
What is observability pipeline?
The observability pipeline uses telemetry, diagnostics, and monitoring to collect data from devices. It extends Azure’s observability assets to these devices while staying within the compliance and security constraints imposed due to customer ownership, geo-location, and operation of these devices.
The Observability pipeline is split into these broad areas:
Telemetry. The telemetry section provides a continual flow of curated critical events from Azure Stack HCI to Azure.
Diagnostics. The diagnostics section provides an episodic or on-demand flow of data from Azure Stack HCI to Azure.
Monitoring. The monitoring section provides a continual flow of curated metrics from Azure Stack HCI to Azure. After the data reaches Azure, it's consumed and utilized in different aspects of the product life cycle, such as product development, customer support, case deflection, and trend analysis.
The following diagram depicts the observability pipeline and data flow from Azure stack HCI to Azure:

Telemetry
Telemetry in Azure Stack HCI refers to the collection of data about the system's performance, functionality, and overall well-being. This data is collected through the Telemetry and Diagnostics extension, which enables the collection of telemetry and diagnostic information from the customer environment. See Azure Stack HCI telemetry and diagnostics extension.
Telemetry is important for Azure Stack HCI because it enables Microsoft to gain valuable insights into the system's behavior. This information can be used to improve the product, troubleshoot issues, and provide better support to customers. Telemetry data can also be used to proactively identify and mitigate potential issues, reducing the likelihood of downtime or other disruptions. Additionally, telemetry data can help Microsoft understand how customers are using Azure Stack HCI, which can inform future development and improvements to the product.
Remote support
You can use remote support to allow a Microsoft support professional to solve your support case faster by permitting access to your device remotely and performing limited troubleshooting and repair. For instructions about how to get remote support, see Get remote support for Azure Stack HCI.
For remote support during the pre-deployment or pre-registration of your Azure Stack HCI cluster, see Get remote support.
Diagnostics
Diagnostics in Azure Stack HCI helps identify and troubleshoot issues that may arise in the system. With the help of diagnostics, administrators can monitor the performance and health of their Azure Stack HCI environment and take proactive measures to prevent issues from occurring. Additionally, diagnostics can provide valuable insights into the behavior of the system, which can help optimize its performance and improve the overall user experience.
Compare log collection methods
The following table provides a comparison of different methods of log collection in Azure Stack HCI:
| Log collection method | Purpose | How to collect logs | Use cases |
|---|---|---|---|
| On-demand log collection | Manually collect and send diagnostic logs for Azure Stack HCI to Microsoft. | Use Send-DiagnosticData cmdlet from any Azure Stack HCI server node. Logs are temporarily copied locally, parsed, sent, and then deleted. For detailed instructions on how to perform on-demand log collection, see Collect logs. |
- Non-registration failures. - Log collection request from Microsoft Support based on an open case. - Log collection when a cluster is registered and connected. - Log collection when the Observability components are installed and functional. - Log collection when a cluster is partially registered. |
| Standalone log collection | Send diagnostic data to Microsoft if observability components aren't deployed or if there are issues during the cluster registration process. | Save data locally and use Send-AzStackHciDiagnosticData command to send data to Microsoft. For detailed instructions on standalone log collections, see Perform standalone log collection. |
- Deployment failures. - Registration failures. - Log collection request from Microsoft Support based on an open case. - Log collection when a cluster is not registered and doesn't have connectivity. - Log collection when a cluster is partially registered. - Log collection when the Observability components aren't available. |
Data privacy
Azure Stack HCI implements data governance procedures to ensure the safety and intended use of customer data. Customers have access to controls to customize features and adjust privacy settings at any time.
Our commitments to data security include:
- Prioritizing customer security and privacy considerations.
- Being transparent with customers about the types of data collected and how it is used.
- Providing customers with autonomy to alter their own privacy settings.
- Using customer data to improve customer experience.
How Microsoft uses data
Customer data helps Microsoft to better understand how our customers use features and services to achieve their business goals. These insights help prioritize engineering investments in areas that may directly impact customer experiences. Customer use of networking or storage settings, as well as their update status, are a few examples of the types of data collected. The insights also drive improvements to the Azure Stack HCI monitoring and support ecosystem. These improvements will eventually make problem diagnosis easier and faster for Microsoft support and customers.
Data collection and residency
Azure Stack HCI data:
- Is not sent to Microsoft until the product is registered with Azure. When Azure Stack HCI is unregistered, this data collection stops. All data is logged to an Azure Stack HCI analytic service.
- Is routed to a protected cloud storage location.
- Is accessible only to Microsoft employees who have a legitimate business reason for viewing the data. All data is handled in accordance with Microsoft privacy policies.
Details about collected data
The following table describes the types of data, their storage location, default settings, and methods for viewing:
| Types Of data | Description | Data storage location | Default setting | Retention period | How data can be viewed |
|---|---|---|---|---|---|
| Telemetry | Telemetry data includes performance metrics, usage patterns, and other information related to user behavior and system health. It doesn't contain any personally identifiable information. | Telemetry data is always stored within the US. | It is enabled by default. To change the default setting, see Telemetry and diagnostics settings. | The data is retained for up to two years. | You can view data in \\<NodeName>\c$\GMACache\TelemetryCache\Tables/*.tsf. |
| Diagnostics | Diagnostics data helps Microsoft detect, diagnose, and fix problems to restore service health and improve products. | Diagnostics data is stored either globally or in the EU, based on the customer’s deployment choice. | Various methods exist to transmit diagnostic data. For details, see Diagnostics | Typically retained for 30 days, potentially longer for ongoing support issues. | You can view data in the C:\observability folder of every node. |
| Metrics | Metrics are numerical values collected at regular intervals, describing aspects of a system. | Metrics data is sent to the respective region in which resource is deployed. | Enabled by default and can be disabled anytime. | Platform metrics are stored for 93 days, however, you can only query (in the Metrics tile) for a maximum of 30 days' worth of data on any single chart. | You can use metrics explorer to interactively analyze the data in your metric database. |
| Billing and census | Billing and census data help visualize and bill resources in the Azure portal. | Billing and census data is sent to the respective resource region where the customer registered the device. | Always enabled and can't be disabled, as it's considered functional. | Data is deleted when the resource is deleted, except for billing data, which is retained. | You can view data in the Azure portal. |
Next steps
Tilbakemeldinger
Kommer snart: Gjennom 2024 faser vi ut GitHub Issues som tilbakemeldingsmekanisme for innhold, og erstatter det med et nytt system for tilbakemeldinger. Hvis du vil ha mer informasjon, kan du se: https://aka.ms/ContentUserFeedback.
Send inn og vis tilbakemelding for