Monitor Azure Stack HCI with Azure Monitor Metrics
Applies to: Azure Stack HCI, version 23H2
This article describes how to monitor your Azure Stack HCI clusters with Azure Monitor Metrics. It also provides a comprehensive list of metrics collected for compute, storage, and network resources in Azure Stack HCI.
When you have critical applications and business processes that rely on Azure resources, it's important to monitor those resources for their availability, performance, and operation. The integration of Azure Monitor Metrics with Azure Stack HCI enables you to store numeric data from your clusters in a dedicated time-series database. This database is automatically created for each Azure subscription. Use metrics explorer to analyze data from your Azure Stack HCI system and assess its health and utilization.
Take a few moments to watch the video walkthrough on creating metric charts in metrics explorer and alerts using Metrics:
Benefits
Here are the benefits of using Metrics for Azure Stack HCI:
No additional cost. These metrics are standard, out-of-the-box features that are automatically collected and provided to you at no extra cost.
Near real-time insights. You have the capability to observe out-of-the-box metrics and correlate trends using near real-time data.
Customization. You can create your own graphs and customize them through aggregation and filter functionality. The task of saving and sharing your metric charts via Excel, workbooks, or sending them to Grafana is straightforward.
Custom alert rules. You can write custom alert rules on the metrics to efficiently monitor the health of your Azure Stack HCI cluster.
Prerequisites
Here are the prerequisites of using Metrics for Azure Stack HCI:
You must have access to a cluster that is running Azure Stack HCI, version 23H2 (Build version: 2311) or later. The cluster must be deployed and registered with Azure.
The
AzureEdgeTelemetryAndDiagnosticsextension must be installed to collect telemetry and diagnostics information from your Azure Stack HCI system. For more information about the extension, see Azure Stack HCI telemetry and diagnostics extension overview.
Monitor Azure Stack HCI through the Monitoring tab
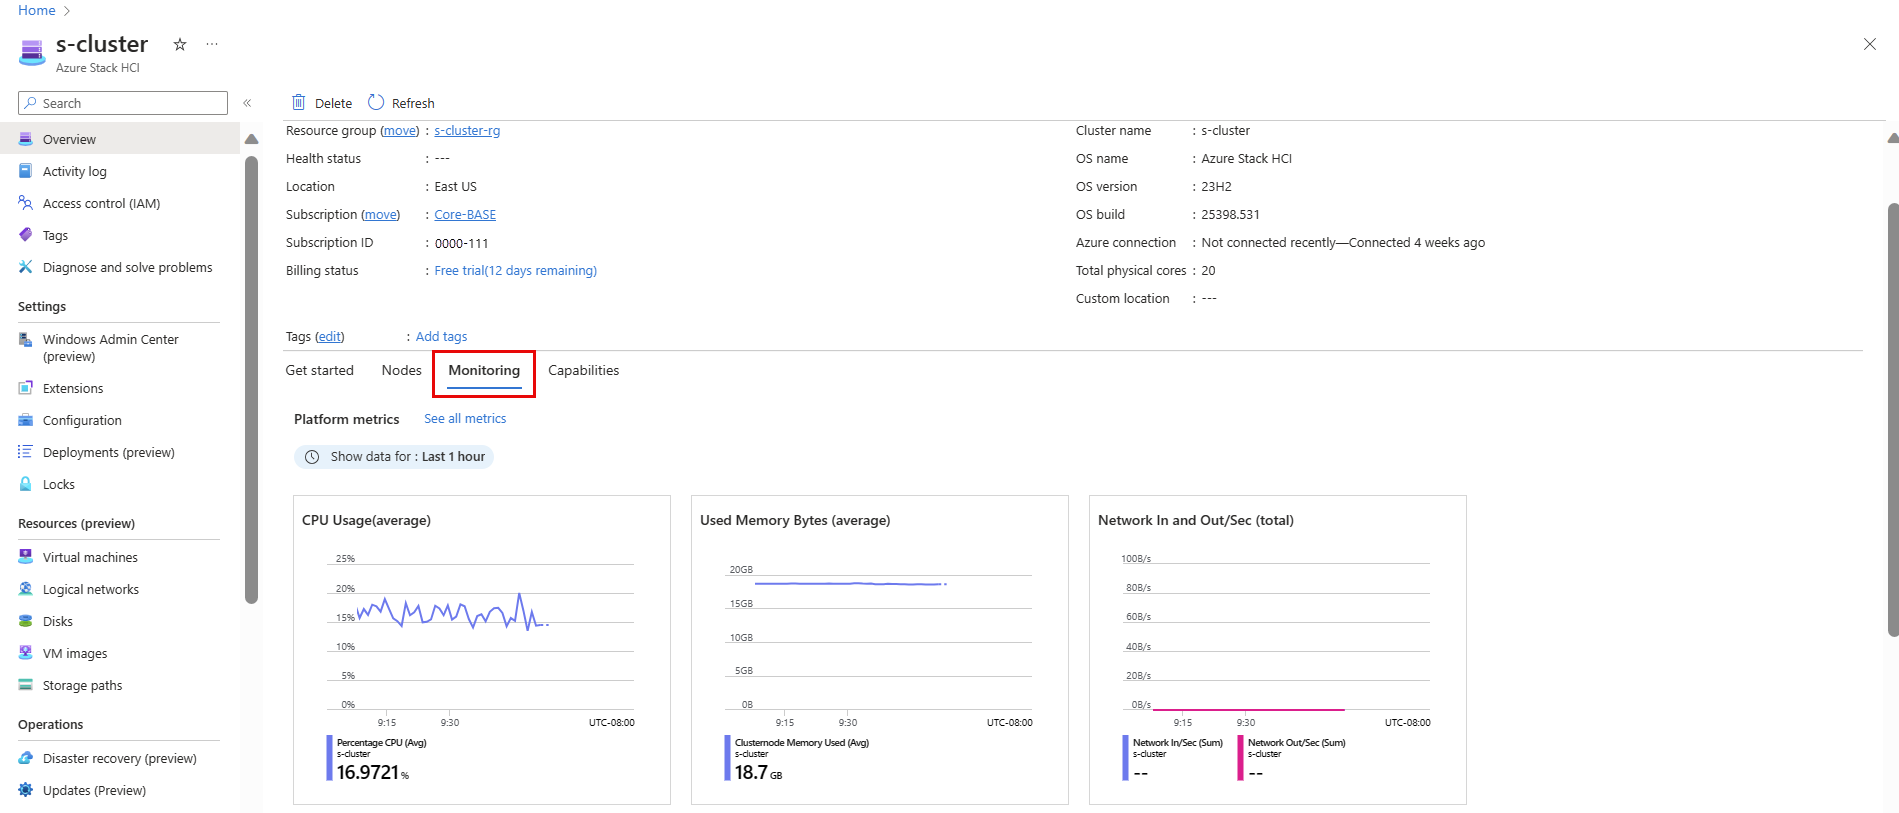
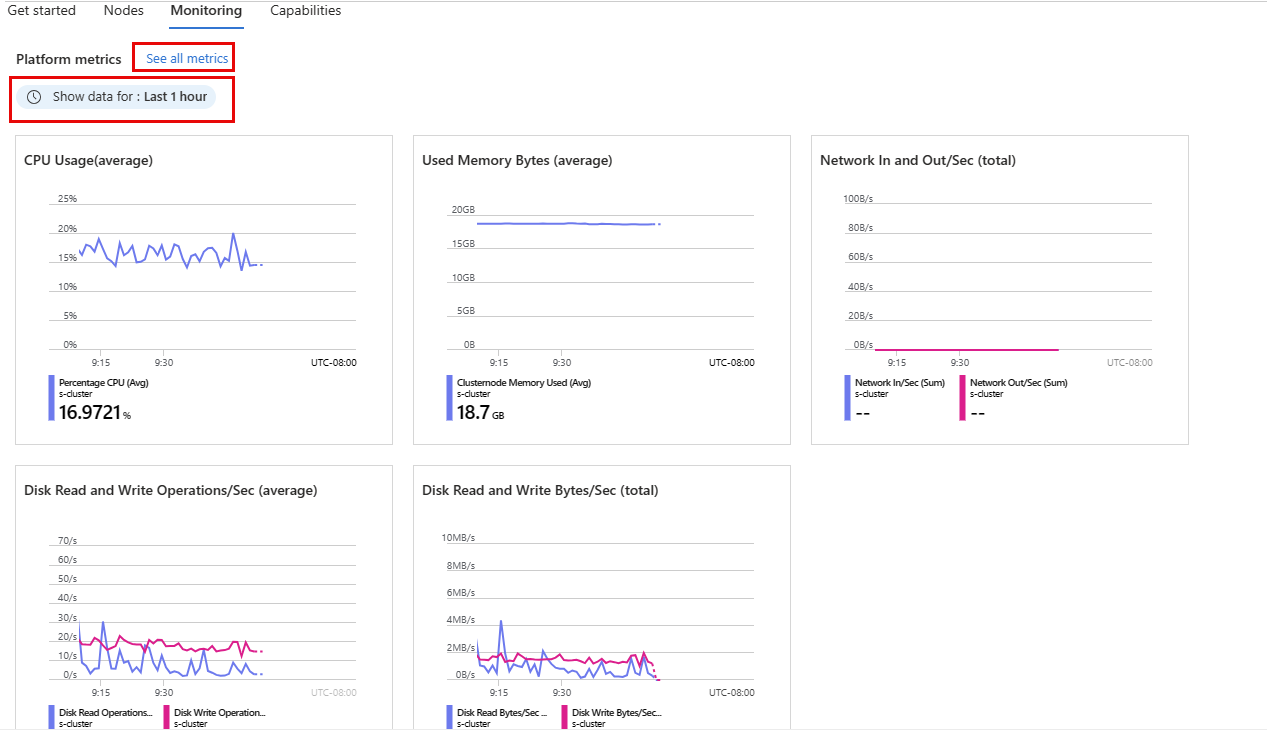
In the Azure portal, you can monitor platform metrics of your cluster by navigating to the Monitoring tab on your cluster’s Overview page. This tab offers a quick way to view graphs for different platform metrics. You can select any of the graphs to further analyze the data in metrics explorer.
Follow these steps to monitor platform metrics of your cluster in the Azure portal:
Go to your Azure Stack HCI cluster resource page and select your cluster.
On the Overview page of your cluster, select the Monitoring tab.
On the Platform metrics pane, review the graphs displaying platform metrics. To know the metrics that Azure Monitor collects to populate these graphs, see Metrics for the Monitoring tab graphs.
At the top of the pane, select a duration to change the time range for the graphs.
Select the See all metrics link to analyze metrics using metrics explorer. See Analyze metrics.
Select any of the graphs to open them in metrics explorer to drill down further or to create an alert rule. See Create metrics alerts.
Analyze metrics
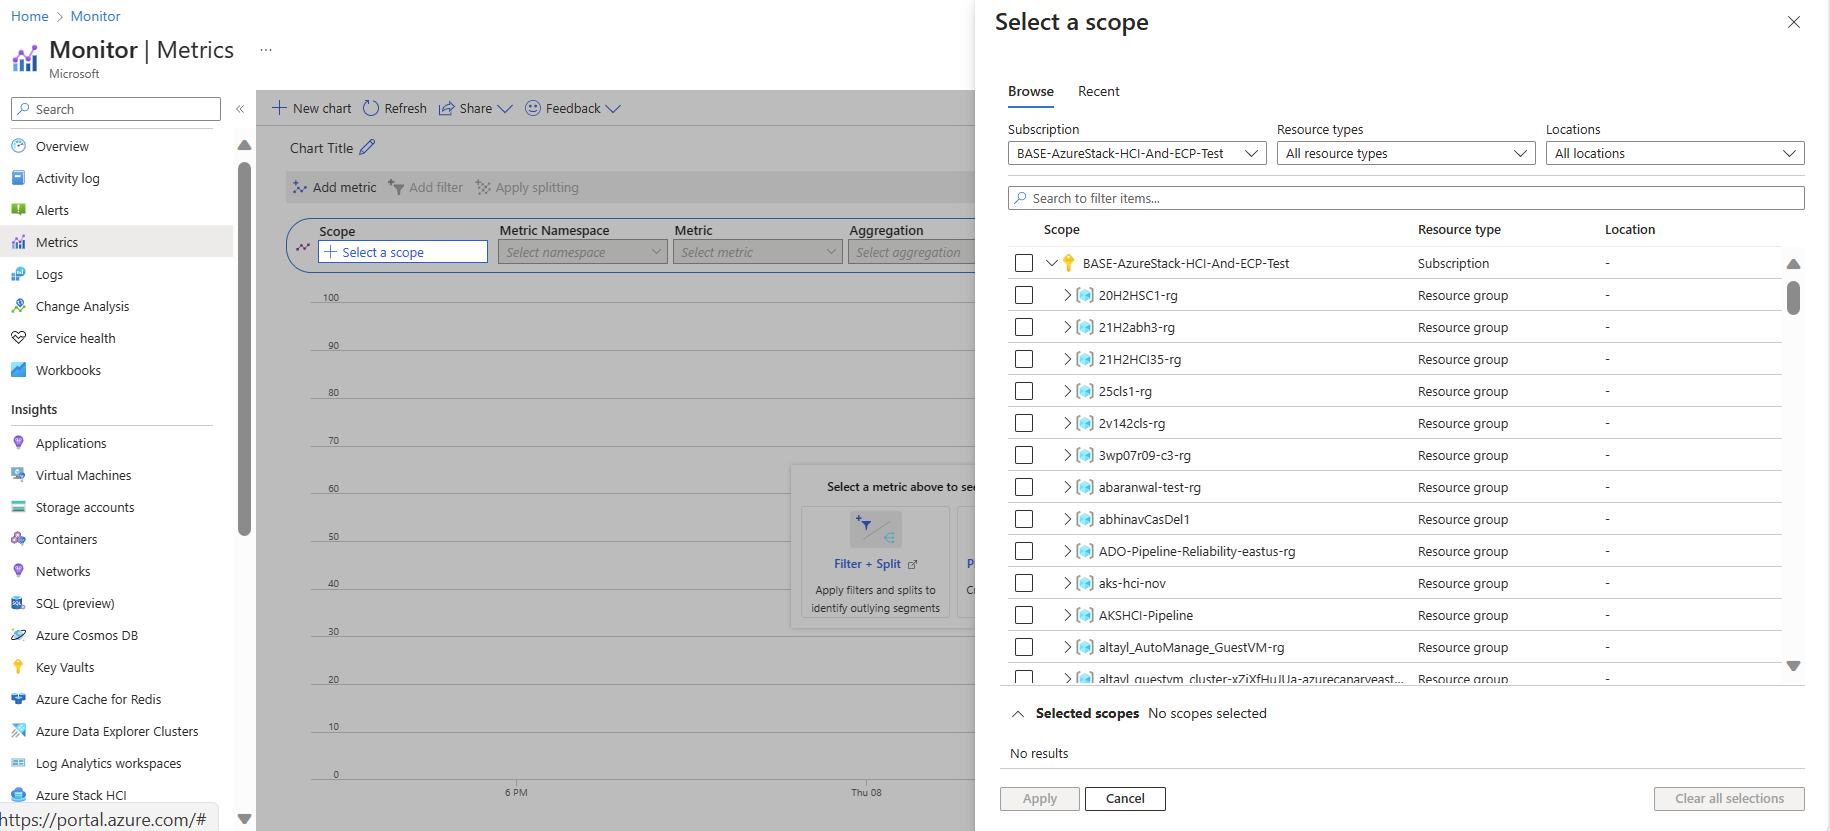
You can use metrics explorer to interactively analyze the data in your metric database and chart the values of multiple metrics over time. To open the metrics explorer in the Azure portal, select Metrics under the Monitoring section.
You can also access Metrics directly from the menu for the Azure Stack HCI services.
With Metrics, you can create charts from metric values and visually correlate trends. You can also create a metric alert rule or pin a chart to an Azure dashboard to view them with other visualizations. For a tutorial on using this tool, see Analyze metrics for an Azure resource.
Platform metrics are stored for 93 days, however, you can only query (in the Metrics tile) for a maximum of 30 days' worth of data on any single chart. To know more about data retention, see Metrics in Azure Monitor.
Analyze metrics for a specific cluster
Follow these steps to analyze metrics for a specific Azure Stack HCI cluster in the Azure portal:
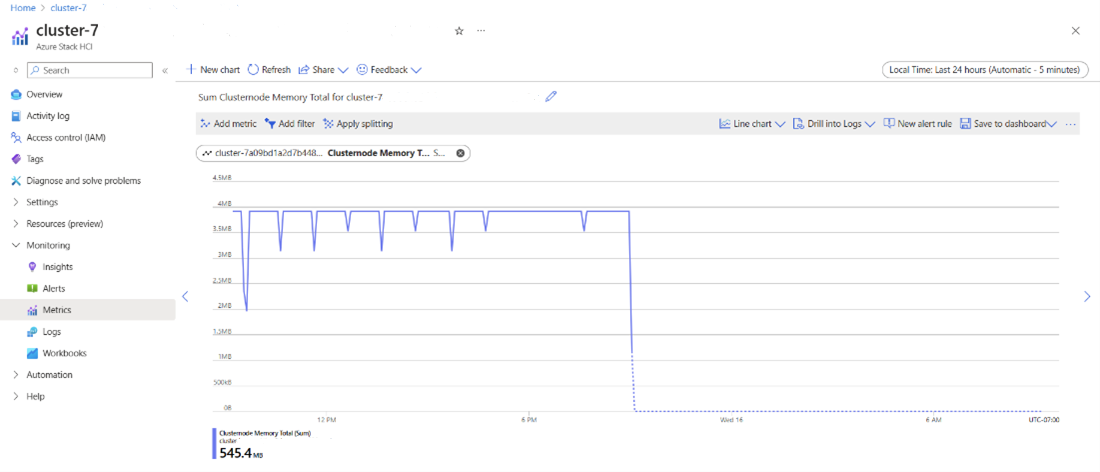
Go to your Azure Stack HCI cluster and navigate to the Monitoring section.
To analyze metrics, select the Metrics option. Your cluster will already be populated in the scope section. Select the metric you want to analyze.
To create alerts, select the Alerts option and set up alerts as described in Create metric alerts.
What metrics are collected?
This section lists the platform metrics that are collected for the Azure Stack HCI cluster, the aggregation types, and the dimensions available for each metric. For more information about metric dimensions, see Multi-dimensional metrics.
Metrics for the Monitoring tab graphs
The following table lists the metrics that Azure Monitor collects to populate the graphs on the Monitoring tab:
| Metrics | Unit |
|---|---|
| Percentage CPU | Percent |
| Network In/Sec | BytesPerSecond |
| Network Out/Sec | BytesPerSecond |
| Disk Read Bytes/Sec | BytesPerSecond |
| Disk Write Bytes/Sec | BytesPerSecond |
| Disk Read Operations/Sec | CountPerSecond |
| Disk Write Operations/Sec | CountPerSecond |
| Used Memory Bytes | Bytes |
Metrics for servers
| Metric | Description | Unit | Default Aggregation Type | Supported Aggregation Type | Dimensions |
|---|---|---|---|---|---|
| Percentage CPU | Percentage of processor time that isn't idle. | Percent | Maximum | Minimum, Maximum, Average, Sum, Count | ClusterName, HostName |
| Percentage CPU Guest | Percentage of processor time used for guest (virtual machine) demand. | Percent | Maximum | Minimum, Maximum, Average, Sum, Count | ClusterName, HostName |
| Percentage CPU Host | Percentage of processor time used for host demand. | Percent | Maximum | Minimum, Maximum, Average, Sum, Count | ClusterName, HostName |
| Cluster node Memory Total | The total physical memory of the server. | Bytes | Sum | Minimum, Maximum, Average | ClusterName, HostName |
| Cluster node Memory Available | The available memory of the server. | Bytes | Maximum | Minimum, Maximum, Average | ClusterName, HostName |
| Cluster node Memory Used | The used memory of the server. | Bytes | Maximum | Minimum, Maximum | ClusterName, HostName |
| Percentage Memory | The allocated (not available) memory of the server. | Percent | Maximum | Minimum, Maximum, Sum, Count | ClusterName, HostName |
| Percentage Memory Guest | The memory allocated to guest (virtual machine) demand. | Percent | Maximum | Minimum, Maximum, Average, Sum, Count | ClusterName, HostName, LUN, VM |
| Percentage Memory Host | The memory allocated to host demand. | Percent | Maximum | Minimum, Maximum, Sum, Count | ClusterName, HostName |
| Cluster node Csv cache Read Hit | Cache hit PerSecond for read operations. | CountPerSecond | Maximum | Minimum, Maximum, Sum, Count | ClusterName, HostName, LUN |
| Cluster node Csv cache Read Hit rate | Cache hit rate for read operations. | Percent | Maximum | Minimum, Maximum, Sum, Count | ClusterName, HostName, LUN |
| Cluster node Csv cache Read Miss | Cache missPerSecond for read operations. | CountPerSecond | Maximum | Minimum, Maximum, Sum, Count | ClusterName, HostName, LUN |
| Cluster node Storage Degraded | Total number of failed or missing drives in the storage pool. | Bytes | Sum | Minimum, Maximum, Sum, Count | ClusterName, HostName |
Metrics for drives
| Metric | Description | Unit | Default Aggregation Type | Supported Aggregation Type | Dimensions |
|---|---|---|---|---|---|
| Physicaldisk Read Operations/Sec | Number of read operations per second completed by the drive. | CountPerSecond | Maximum | Minimum, Maximum, Average, Sum, Count | ClusterName, HostName, LUN |
| Physicaldisk Write Operations/Sec | Number of write operations per second completed by the drive. | CountPerSecond | Maximum | Minimum, Maximum, Average, Sum, Count | ClusterName, HostName, LUN |
| Physicaldisk Read and Write Operations/Sec | Total number of read or write operations per second completed by the drive. | CountPerSecond | Sum | Minimum, Maximum, Average, Sum, Count | ClusterName, HostName, LUN |
| Physicaldisk Read Bytes/Sec | Quantity of data read from the drive per second. | BytesPerSecond | Maximum | Minimum, Maximum, Average, Sum, Count | ClusterName, HostName, LUN |
| Physicaldisk Write Bytes/Sec | Quantity of data written to the drive per second. | BytesPerSecond | Maximum | Minimum, Maximum, Average, Sum, Count | ClusterName, HostName, LUN |
| Physicaldisk Read and Write | Total quantity of data read from or written to the drive per second. | BytesPerSecond | Sum | Minimum, Maximum, Average, Sum, Count | ClusterName, HostName, LUN |
| Physicaldisk Latency Read | Average latency of read operations from the drive. | Seconds | Maximum | Minimum, Maximum, Average, Sum | ClusterName, HostName, LUN |
| Physicaldisk Latency Write | Average latency of write operations to the drive. | Seconds | Maximum | Minimum, Maximum, Average, Sum | ClusterName, HostName, LUN |
| Physicaldisk Latency Average | Average latency of all operations to or from the drive. | Seconds | Maximum | Minimum, Maximum, Average, Sum | ClusterName, HostName, LUN |
| Physicaldisk Capacity Size Total | The total storage capacity of the drive. | Bytes | Sum | Minimum, Maximum, Average | ClusterName, HostName, LUN |
| Physicaldisk Capacity Size Used | The used storage capacity of the drive. | Bytes | Maximum | Minimum, Maximum, Average, Sum, Count | ClusterName, HostName, LUN |
Metrics for network adapters
| Metric | Description | Unit | Default Aggregation Type | Supported Aggregation Type | Dimensions |
|---|---|---|---|---|---|
| Network In/Sec | Rate of data received by the network adapter. | Bytes Per Second | Maximum | Minimum, Maximum, Average, Sum, Count | ClusterName, HostName, Network Adapter, LUN |
| Network Out/Sec | Rate of data sent by the network adapter. | Bytes Per Second | Maximum | Minimum, Maximum, Average, Sum, Count | ClusterName, HostName, Network Adapter, LUN |
| Network Total/Sec | Total rate of data received or sent by the network adapter. | Bytes Per Second | Sum | Minimum, Maximum, Average, Sum, Count | ClusterName, HostName, Network Adapter, LUN |
| Netadapter Bandwidth Rdma Inbound | Rate of data received over RDMA by the network adapter. | Bytes Per Second | Maximum | Minimum, Maximum, Average, Sum, Count | ClusterName, HostName, Network Adapter, LUN |
| Netadapter Bandwidth Rdma Outbound | Rate of data sent over RDMA by the network adapter. | Bytes Per Second | Maximum | Minimum, Maximum, Average, Sum, Count | ClusterName, HostName, Network Adapter, LUN |
| Netadapter Bandwidth Rdma Total | Total rate of data received or sent over RDMA by the network adapter. | Bytes Per Second | Sum | Minimum, Maximum, Sum, Count | ClusterName, HostName, Network Adapter, LUN |
Metrics for VHDs
| Metric | Description | Unit | Default Aggregation Type | Supported Aggregation Type | Dimensions |
|---|---|---|---|---|---|
| VHD Read Operations/Sec | Number of read operations per second completed by the virtual hard disk. | Count Per Second | Maximum | Minimum, Maximum, Average, Sum, Count | ClusterName, HostName, VHD |
| VHD Write Operations/Sec | Number of write operations per second completed by the virtual hard disk. | Count Per Second | Maximum | Minimum, Maximum, Average, Sum, Count | ClusterName, HostName, VHD |
| VHD Read and Write Operations/Sec | Total number of read or write operations per second completed by the virtual hard disk. | Count Per Second | Sum | Minimum, Maximum, Sum, Count | ClusterName, HostName, VHD |
| VHD Read Bytes/Sec | Quantity of data read from the virtual hard disk per second. | Bytes Per Second | Maximum | Minimum, Maximum, Average, Sum, Count | ClusterName, HostName, VHD |
| VHD Write Bytes/Sec | Quantity of data written to the virtual hard disk per second. | Bytes Per Second | Maximum | Minimum, Maximum, Average, Sum, Count | ClusterName, HostName, VHD |
| VHD Read and Write Bytes/Sec | Total quantity of data read from or written to the virtual hard disk per second. | Bytes Per Second | Sum | Minimum, Maximum, Sum, Count | ClusterName, HostName, VHD |
| VHD Latency Average | Average latency of all operations to or from the virtual hard disk. | Seconds | Maximum | Minimum, Maximum, Average, Sum | ClusterName, HostName, VHD |
| VHD Size Current | The current file size of the virtual hard disk, if dynamically expanding. If fixed, the series isn't collected. | Bytes | Maximum | Minimum, Maximum, Average | ClusterName, HostName, Instance |
| VHD Size Maximum | The maximum size of the virtual hard disk, if dynamically expanding. | Bytes | Maximum | Minimum, Maximum, Average | ClusterName, HostName, VHD |
Metrics for VMs
| Metric | Description | Unit | Default Aggregation Type | Supported Aggregation Type | Dimensions |
|---|---|---|---|---|---|
| VM Percentage CPU | Percentage the virtual machine is using of its host server’s processor(s). | Percent | Maximum | Minimum, Maximum, Sum, Count | ClusterName, Hostname, VM |
| VM Memory Assigned | The quantity of memory assigned to the virtual machine. | Bytes | Sum | Minimum, Maximum | ClusterName, HostName, LUN, VM |
| VM Memory Available | The quantity of memory that remains available, of the amount assigned. | Bytes | Maximum | Minimum, Maximum, Sum, Count | ClusterName, HostName, VM, LUN |
| VM Memory Used | VM Memory Used | Bytes | Maximum | Minimum, Maximum | ClusterName, HostName, VM, LUN |
| VM Memory Maximum | If using dynamic memory, this is the maximum quantity of memory that might be assigned to the virtual machine. | Bytes | Maximum | Minimum, Maximum, Average | ClusterName, HostName, LUN, VM |
| VM Memory Minimum | If using dynamic memory, this is the minimum quantity of memory that might be assigned to the virtual machine. | Bytes | Minimum | Minimum, Maximum, Average | ClusterName, HostName, LUN, VM |
| VM Memory Pressure | The ratio of memory demanded by the virtual machine over memory allocated to the virtual machine. | Bytes | Maximum | Minimum, Maximum, Average | ClusterName, HostName, LUN, VM |
| VM Memory Startup | The quantity of memory required for the virtual machine to start. | Bytes | Maximum | Minimum, Maximum, Average | ClusterName, HostName, LUN, VM |
| VM Memory Total | Total memory. | Bytes | Maximum | Minimum, Maximum, Average | ClusterName, HostName, VM, LUN |
| VM network adapter Network In/Sec | Rate of data received by the virtual machine across all its virtual network adapters. | Bits Per Second | Maximum | Minimum, Maximum, Average, Sum, Count | ClusterName, HostName, Virtual Network Adapter |
| VM network adapter Network Out/Sec | Rate of data sent by the virtual machine across all its virtual network adapters. | Bits Per Second | Maximum | Minimum, Maximum, Average, Sum, Count | ClusterName, HostName, Virtual Network Adapter |
| VM network adapter Network In and Out/Sec | Total rate of data received or sent by the virtual machine across all its virtual network adapters. | Bits Per Second | Maximum | Minimum, Maximum, Average, Sum, Count | ClusterName, HostName, Virtual Network Adapter |
Metrics for volumes
| Metric | Description | Unit | Default Aggregation Type | Supported Aggregation Type | Dimensions |
|---|---|---|---|---|---|
| Disk Read Operations/Sec | Number of read operations per second completed by this volume. | Count Per Second | Maximum | Minimum, Maximum, Average, Sum, Count | ClusterName, HostName, LUN |
| Disk Write Operations/Sec | Number of write operations per second completed by this volume. | Count Per Second | Maximum | Minimum, Maximum, Average, Sum, Count | ClusterName, HostName, LUN |
| Disk Read and Write Operations/Sec | Total number of read or write operations per second completed by this volume. | Count Per Second | Sum | Minimum, Maximum, Sum, Count | ClusterName, HostName, LUN |
| Disk Read Bytes/Sec | Quantity of data read from this volume per second. | Bytes Per Second | Maximum | Minimum, Maximum, Average, Sum, Count | ClusterName, HostName, LUN |
| Disk Write Bytes/Sec | Quantity of data written to this volume per second. | Bytes Per Second | Maximum | Minimum, Maximum, Average, Sum, Count | ClusterName, HostName, LUN |
| Disk Read and Write | Total quantity of data read from or written to this volume per second. | Bytes Per Second | Sum | Minimum, Maximum, Sum, Count | ClusterName, HostName, LUN |
| Volume Latency Read | Average latency of read operations from this volume. | Seconds | Maximum | Minimum, Maximum, Average, Sum | ClusterName, HostName, LUN |
| Volume Latency Write | Average latency of write operations to this volume. | Seconds | Maximum | Minimum, Maximum, Average, Sum | ClusterName, HostName, LUN |
| Volume Latency Average | Average latency of all operations to or from this volume. | Seconds | Maximum | Minimum, Maximum, Sum | ClusterName, HostName, LUN |
| Volume Size Total | The total storage capacity of the volume. | Bytes | Sum | Minimum, Maximum, Average | ClusterName, HostName, LUN |
| Volume Size Available | The available storage capacity of the volume. | Bytes | Maximum | Minimum, Maximum, Average, Sum, Count | ClusterName, HostName, LUN |
To see in-depth information about how these metrics are collected, see Performance history for Storage Spaces Direct.
Next steps
Tilbakemeldinger
Kommer snart: Gjennom 2024 faser vi ut GitHub Issues som tilbakemeldingsmekanisme for innhold, og erstatter det med et nytt system for tilbakemeldinger. Hvis du vil ha mer informasjon, kan du se: https://aka.ms/ContentUserFeedback.
Send inn og vis tilbakemelding for


