Dodawanie warstwy liniowej do mapy (zestaw Android SDK)
Uwaga
Wycofanie zestawu AZURE Mapy Android SDK
Zestaw Azure Mapy Native SDK dla systemu Android jest teraz przestarzały i zostanie wycofany w dniu 3.31.25. Aby uniknąć przerw w działaniu usługi, przeprowadź migrację do zestawu Sdk sieci Web usługi Azure Mapy do 31/31/25. Aby uzyskać więcej informacji, zobacz Przewodnik migracji zestawu SDK platformy Azure Mapy Android.
Warstwę liniową można użyć do renderowania LineString i MultiLineString funkcji jako ścieżek lub tras na mapie. Warstwę liniową można również użyć do renderowania Polygon konspektu funkcji i MultiPolygon . Źródło danych jest połączone z warstwą liniową, aby udostępnić dane do renderowania.
Napiwek
Warstwy linii domyślnie renderują współrzędne wielokątów, a także linie w źródle danych. Aby ograniczyć warstwę tak, aby renderowana była tylko funkcja geometrii LineString, ustaw filter opcję warstwy na eq(geometryType(), "LineString"). Jeśli chcesz również uwzględnić funkcje MultiLineString, ustaw filter opcję warstwy na any(eq(geometryType(), "LineString"), eq(geometryType(), "MultiLineString")).
Wymagania wstępne
Pamiętaj, aby wykonać kroki opisane w przewodniku Szybki start: tworzenie dokumentu aplikacji dla systemu Android. Bloki kodu w tym artykule można wstawić do programu obsługi zdarzeń map onReady .
Dodawanie warstwy linii
Poniższy kod pokazuje, jak utworzyć wiersz. Dodaj wiersz do źródła danych, a następnie renderuj go za pomocą warstwy liniowej LineLayer przy użyciu klasy .
//Create a data source and add it to the map.
DataSource source = new DataSource();
map.sources.add(source);

//Create a list of points.
List<Point> points = Arrays.asList(
    Point.fromLngLat(-73.97234, 40.74327),
    Point.fromLngLat(-74.00442, 40.75680));

//Create a LineString geometry and add it to the data source.
source.add(LineString.fromLngLats(points));

//Create a line layer and add it to the map.
LineLayer layer = new LineLayer(source,
    strokeColor("blue"),
    strokeWidth(5f)
);

map.layers.add(layer);
//Create a data source and add it to the map.
val source = DataSource()
map.sources.add(source)

//Create a list of points.
val points = asList(
    Point.fromLngLat(-73.97234, 40.74327),
    Point.fromLngLat(-74.00442, 40.75680)
)

//Create a LineString geometry and add it to the data source.
source.add(LineString.fromLngLats(points))

//Create a line layer and add it to the map.
val layer = LineLayer(
    source,
    strokeColor("blue"),
    strokeWidth(5f)
)

map.layers.add(layer)
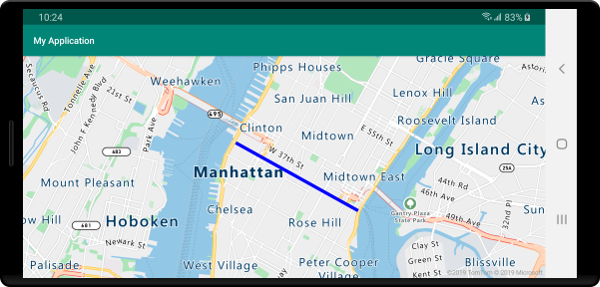
Poniższy zrzut ekranu przedstawia powyższy kod renderujący wiersz w warstwie liniowej.
Styl linii opartej na danych
Poniższy kod tworzy dwie funkcje wiersza i dodaje wartość limitu prędkości jako właściwość do każdego wiersza. Warstwa liniowa używa wyrażenia stylu dysku danych kolor linii na podstawie wartości limitu prędkości. Ponieważ nakładki danych linii wzdłuż dróg, poniższy kod dodaje warstwę liniową poniżej warstwy etykiety, dzięki czemu etykiety dróg mogą być nadal czytelne.
//Create a data source and add it to the map.
DataSource source = new DataSource();
map.sources.add(source);

//Create a line feature.
Feature feature = Feature.fromGeometry(
    LineString.fromLngLats(Arrays.asList(
        Point.fromLngLat(-122.131821, 47.704033),
        Point.fromLngLat(-122.099919, 47.703678))));

//Add a property to the feature.
feature.addNumberProperty("speedLimitMph", 35);

//Add the feature to the data source.
source.add(feature);

//Create a second line feature.
Feature feature2 = Feature.fromGeometry(
    LineString.fromLngLats(Arrays.asList(
        Point.fromLngLat(-122.126662, 47.708265),
        Point.fromLngLat(-122.126877, 47.703980))));

//Add a property to the second feature.
feature2.addNumberProperty("speedLimitMph", 15);

//Add the second feature to the data source.
source.add(feature2);

//Create a line layer and add it to the map.
LineLayer layer = new LineLayer(source,
    strokeColor(
        interpolate(
            linear(),
            get("speedLimitMph"),
            stop(0, color(Color.GREEN)),
            stop(30, color(Color.YELLOW)),
            stop(60, color(Color.RED))
        )
    ),
    strokeWidth(5f)
);

map.layers.add(layer, "labels");
//Create a data source and add it to the map.
val source = DataSource()
map.sources.add(source)

//Create a line feature.
val feature = Feature.fromGeometry(
    LineString.fromLngLats(
        Arrays.asList(
            Point.fromLngLat(-122.131821, 47.704033),
            Point.fromLngLat(-122.099919, 47.703678)
        )
    )
)

//Add a property to the feature.
feature.addNumberProperty("speedLimitMph", 35)

//Add the feature to the data source.
source.add(feature)

//Create a second line feature.
val feature2 = Feature.fromGeometry(
    LineString.fromLngLats(
        Arrays.asList(
            Point.fromLngLat(-122.126662, 47.708265),
            Point.fromLngLat(-122.126877, 47.703980)
        )
    )
)

//Add a property to the second feature.
feature2.addNumberProperty("speedLimitMph", 15)

//Add the second feature to the data source.
source.add(feature2)

//Create a line layer and add it to the map.
val layer = LineLayer(
    source,
    strokeColor(
        interpolate(
            linear(),
            get("speedLimitMph"),
            stop(0, color(Color.GREEN)),
            stop(30, color(Color.YELLOW)),
            stop(60, color(Color.RED))
        )
    ),
    strokeWidth(5f)
)

map.layers.add(layer, "labels")
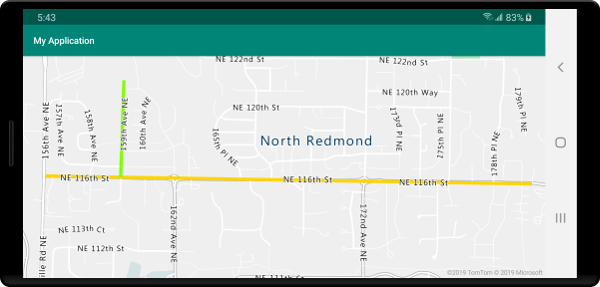
Poniższy zrzut ekranu przedstawia powyższy kod renderujący dwa wiersze w warstwie liniowej— kolor pobrany z wyrażenia stylu opartego na danych na podstawie właściwości w funkcji wiersza.
Dodawanie gradientu pociągnięcia do linii
Możesz zastosować jeden kolor pociągnięcia do linii. Możesz również wypełnić linię gradientem kolorów, aby pokazać przejście z jednego segmentu linii do następnego segmentu wiersza. Na przykład gradienty linii mogą służyć do reprezentowania zmian w czasie i odległości lub różnych temperatur w połączonej linii obiektów. Aby zastosować tę funkcję do linii, źródło danych musi mieć lineMetrics opcję ustawioną na true, a następnie wyrażenie gradientu koloru może zostać przekazane do strokeColor opcji wiersza. Wyrażenie gradientu pociągnięcia musi odwoływać się lineProgress do wyrażenia danych, które uwidacznia metryki linii obliczeniowej w wyrażeniu.
//Create a data source and add it to the map.
DataSource source = new DataSource(
    //Enable line metrics on the data source. This is needed to enable support for strokeGradient.
    withLineMetrics(true)
);
map.sources.add(source);

//Create a line and add it to the data source.
source.add(LineString.fromLngLats(
    Arrays.asList(
        Point.fromLngLat(-122.18822, 47.63208),
        Point.fromLngLat(-122.18204, 47.63196),
        Point.fromLngLat(-122.17243, 47.62976),
        Point.fromLngLat(-122.16419, 47.63023),
        Point.fromLngLat(-122.15852, 47.62942),
        Point.fromLngLat(-122.15183, 47.62988),
        Point.fromLngLat(-122.14256, 47.63451),
        Point.fromLngLat(-122.13483, 47.64041),
        Point.fromLngLat(-122.13466, 47.64422),
        Point.fromLngLat(-122.13844, 47.65440),
        Point.fromLngLat(-122.13277, 47.66515),
        Point.fromLngLat(-122.12779, 47.66712),
        Point.fromLngLat(-122.11595, 47.66712),
        Point.fromLngLat(-122.11063, 47.66735),
        Point.fromLngLat(-122.10668, 47.67035),
        Point.fromLngLat(-122.10565, 47.67498)
    )
));

//Create a line layer and pass in a gradient expression for the strokeGradient property.
map.layers.add(new LineLayer(source,
    strokeWidth(6f),

    //Pass an interpolate or step expression that represents a gradient.
    strokeGradient(
        interpolate(
            linear(),
            lineProgress(),
            stop(0, color(Color.BLUE)),
            stop(0.1, color(Color.argb(255, 65, 105, 225))), //Royal Blue
            stop(0.3, color(Color.CYAN)),
            stop(0.5, color(Color.argb(255,0, 255, 0))), //Lime
            stop(0.7, color(Color.YELLOW)),
            stop(1, color(Color.RED))
        )
    )
));
//Create a data source and add it to the map.
val source = DataSource(
    //Enable line metrics on the data source. This is needed to enable support for strokeGradient.
    withLineMetrics(true)
)
map.sources.add(source)

//Create a line and add it to the data source.
source.add(
    LineString.fromLngLats(
        Arrays.asList(
            Point.fromLngLat(-122.18822, 47.63208),
            Point.fromLngLat(-122.18204, 47.63196),
            Point.fromLngLat(-122.17243, 47.62976),
            Point.fromLngLat(-122.16419, 47.63023),
            Point.fromLngLat(-122.15852, 47.62942),
            Point.fromLngLat(-122.15183, 47.62988),
            Point.fromLngLat(-122.14256, 47.63451),
            Point.fromLngLat(-122.13483, 47.64041),
            Point.fromLngLat(-122.13466, 47.64422),
            Point.fromLngLat(-122.13844, 47.65440),
            Point.fromLngLat(-122.13277, 47.66515),
            Point.fromLngLat(-122.12779, 47.66712),
            Point.fromLngLat(-122.11595, 47.66712),
            Point.fromLngLat(-122.11063, 47.66735),
            Point.fromLngLat(-122.10668, 47.67035),
            Point.fromLngLat(-122.10565, 47.67498)
        )
    )
)

//Create a line layer and pass in a gradient expression for the strokeGradient property.
map.layers.add(
    LineLayer(
        source,
        strokeWidth(6f),

        //Pass an interpolate or step expression that represents a gradient.
        strokeGradient(
            interpolate(
                linear(),
                lineProgress(),
                stop(0, color(Color.BLUE)),
                stop(0.1, color(Color.argb(255, 65, 105, 225))),  //Royal Blue
                stop(0.3, color(Color.CYAN)),
                stop(0.5, color(Color.argb(255, 0, 255, 0))),  //Lime
                stop(0.7, color(Color.YELLOW)),
                stop(1, color(Color.RED))
            )
        )
    )
)
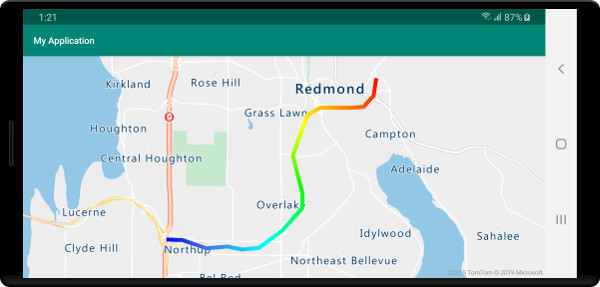
Poniższy zrzut ekranu przedstawia powyższy kod przedstawiający linię renderowaną przy użyciu koloru pociągnięcia gradientu.
Dodawanie symboli wzdłuż linii
W tym przykładzie pokazano, jak dodać ikony strzałek wzdłuż linii na mapie. W przypadku korzystania z warstwy symboli symbolPlacement ustaw opcję na SymbolPlacement.LINE. Spowoduje to renderowanie symboli wzdłuż linii i obraca ikony (0 stopni = prawo).
//Create a data source and add it to the map.
DataSource source = new DataSource();
map.sources.add(source);

//Load a image of an arrow into the map image sprite and call it "arrow-icon".
map.images.add("arrow-icon", R.drawable.purple_arrow_right);

//Create and add a line to the data source.
source.add(LineString.fromLngLats(Arrays.asList(
    Point.fromLngLat(-122.18822, 47.63208),
    Point.fromLngLat(-122.18204, 47.63196),
    Point.fromLngLat(-122.17243, 47.62976),
    Point.fromLngLat(-122.16419, 47.63023),
    Point.fromLngLat(-122.15852, 47.62942),
    Point.fromLngLat(-122.15183, 47.62988),
    Point.fromLngLat(-122.14256, 47.63451),
    Point.fromLngLat(-122.13483, 47.64041),
    Point.fromLngLat(-122.13466, 47.64422),
    Point.fromLngLat(-122.13844, 47.65440),
    Point.fromLngLat(-122.13277, 47.66515),
    Point.fromLngLat(-122.12779, 47.66712),
    Point.fromLngLat(-122.11595, 47.66712),
    Point.fromLngLat(-122.11063, 47.66735),
    Point.fromLngLat(-122.10668, 47.67035),
    Point.fromLngLat(-122.10565, 47.67498)))
);

//Create a line layer and add it to the map.
map.layers.add(new LineLayer(source,
    strokeColor("DarkOrchid"),
    strokeWidth(5f)
));

//Create a symbol layer and add it to the map.
map.layers.add(new SymbolLayer(source,
    //Space symbols out along line.
    symbolPlacement(SymbolPlacement.LINE),

    //Spread the symbols out 100 pixels apart.
    symbolSpacing(100f),

    //Use the arrow icon as the symbol.
    iconImage("arrow-icon"),

    //Allow icons to overlap so that they aren't hidden if they collide with other map elements.
    iconAllowOverlap(true),

    //Center the symbol icon.
    iconAnchor(AnchorType.CENTER),

    //Scale the icon size.
    iconSize(0.8f)
));
//Create a data source and add it to the map.
val source = DataSource()
map.sources.add(source)

//Load a image of an arrow into the map image sprite and call it "arrow-icon".
map.images.add("arrow-icon", R.drawable.purple_arrow_right)

//Create and add a line to the data source.
//Create and add a line to the data source.
source.add(
    LineString.fromLngLats(
        Arrays.asList(
            Point.fromLngLat(-122.18822, 47.63208),
            Point.fromLngLat(-122.18204, 47.63196),
            Point.fromLngLat(-122.17243, 47.62976),
            Point.fromLngLat(-122.16419, 47.63023),
            Point.fromLngLat(-122.15852, 47.62942),
            Point.fromLngLat(-122.15183, 47.62988),
            Point.fromLngLat(-122.14256, 47.63451),
            Point.fromLngLat(-122.13483, 47.64041),
            Point.fromLngLat(-122.13466, 47.64422),
            Point.fromLngLat(-122.13844, 47.65440),
            Point.fromLngLat(-122.13277, 47.66515),
            Point.fromLngLat(-122.12779, 47.66712),
            Point.fromLngLat(-122.11595, 47.66712),
            Point.fromLngLat(-122.11063, 47.66735),
            Point.fromLngLat(-122.10668, 47.67035),
            Point.fromLngLat(-122.10565, 47.67498)
        )
    )
)

//Create a line layer and add it to the map.
map.layers.add(
    LineLayer(
        source,
        strokeColor("DarkOrchid"),
        strokeWidth(5f)
    )
)

//Create a symbol layer and add it to the map.
map.layers.add(
    SymbolLayer(
        source,  //Space symbols out along line.
        symbolPlacement(SymbolPlacement.LINE),  //Spread the symbols out 100 pixels apart.
        symbolSpacing(100f),  //Use the arrow icon as the symbol.
        iconImage("arrow-icon"),  //Allow icons to overlap so that they aren't hidden if they collide with other map elements.
        iconAllowOverlap(true),  //Center the symbol icon.
        iconAnchor(AnchorType.CENTER),  //Scale the icon size.
        iconSize(0.8f)
    )
)
W tym przykładzie poniższy obraz został załadowany do folderu drawable aplikacji.
purple-arrow-right.png |
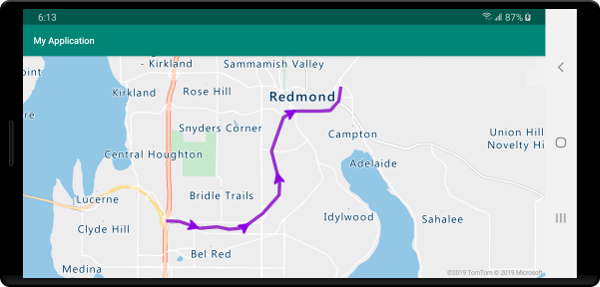
Poniższy zrzut ekranu przedstawia powyższy kod przedstawiający wiersz z wyświetlonymi ikonami strzałek.
Następne kroki
Więcej przykładów kodu do dodania do map można znaleźć w następujących artykułach: