Load data in a Power BI streaming dataset and build a dataflows monitoring report with Power BI
This tutorial demonstrates how to load data in a Power BI streaming dataset to create a dataflows monitoring report in Power BI.
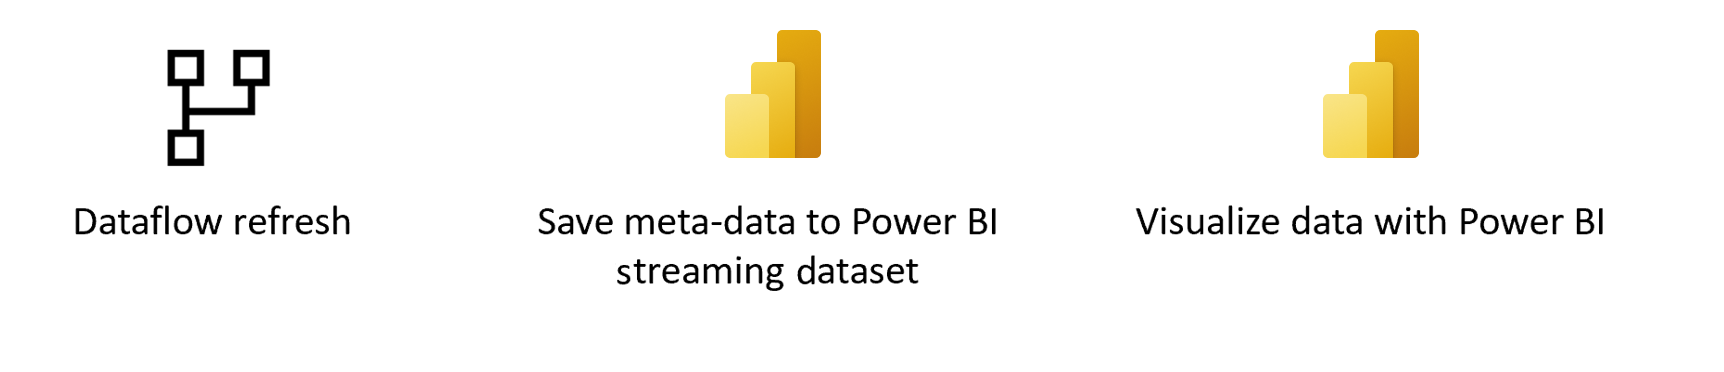
First, you'll create a new streaming dataset in Power BI. This dataset collects all the metadata from the dataflow run, and for every refresh of a dataflow, a record is added to this dataset. You can run multiple dataflows all to the same dataset. Lastly, you can build a Power BI report on the data to visualize the metadata and start monitoring the dataflows.
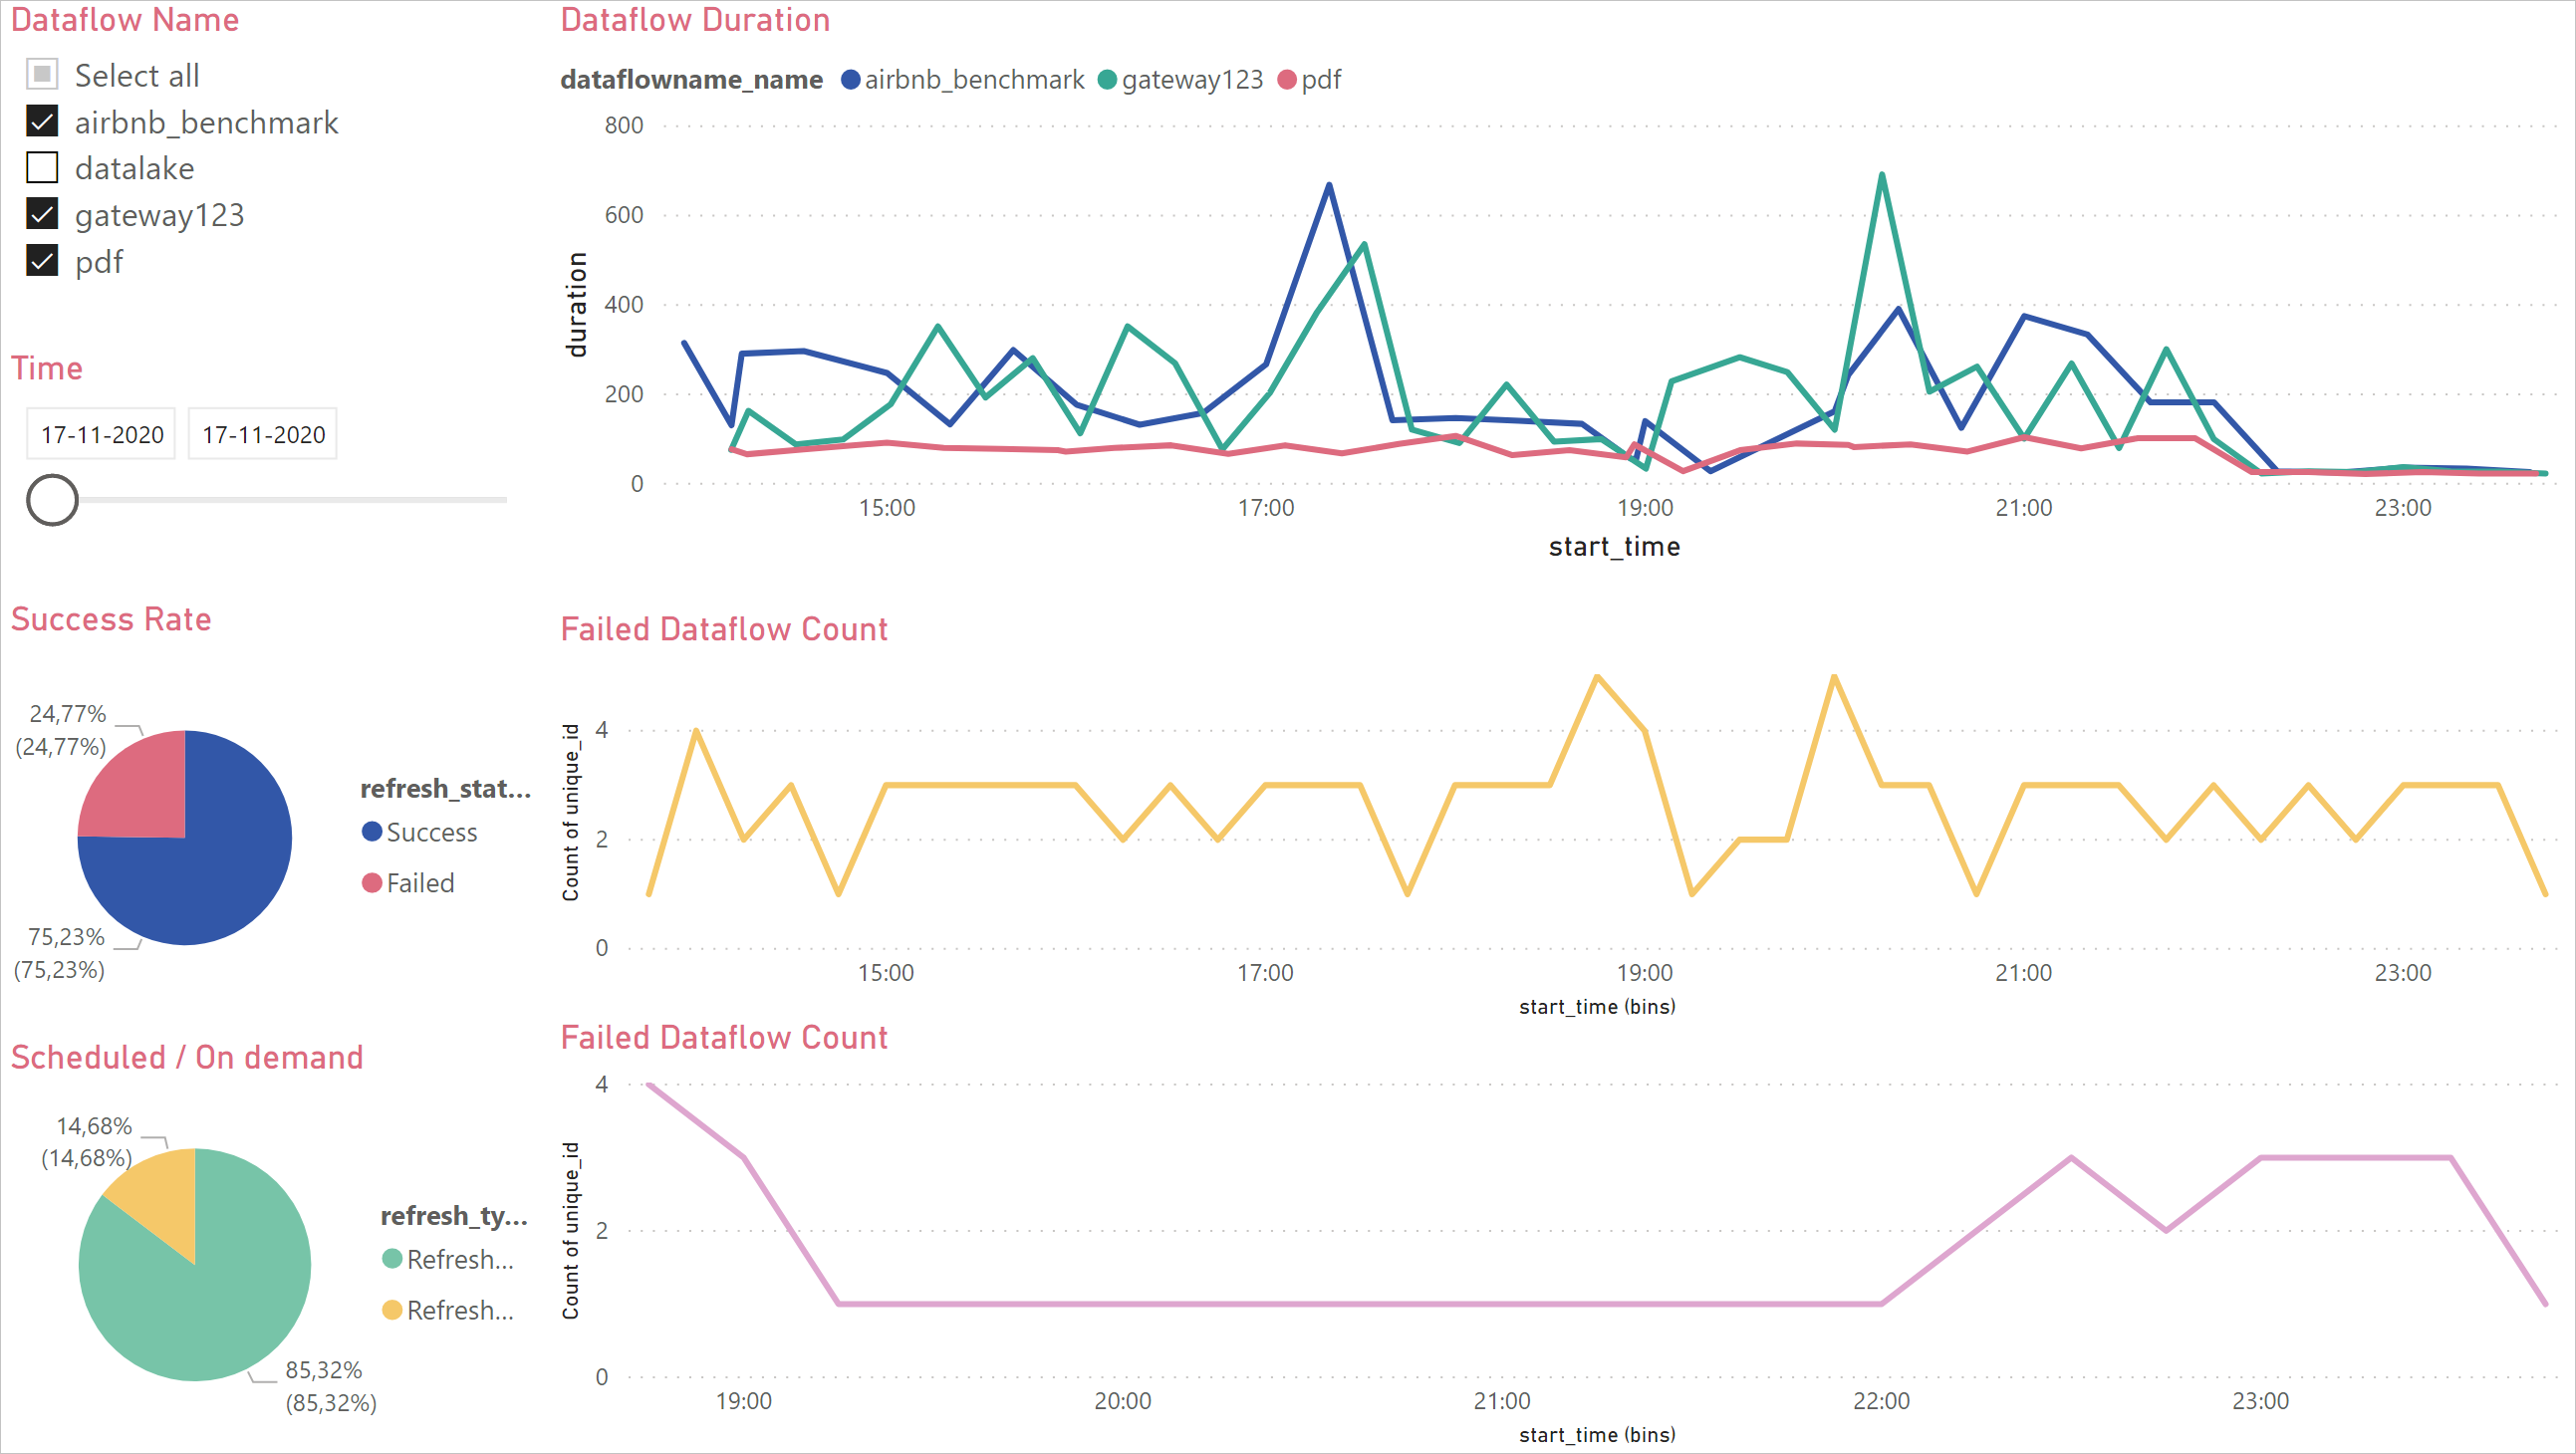
You can use this dashboard to monitor your dataflows' refresh duration and failure count. With this dashboard, you can track any issues with your dataflows performance and share the data with others.
Prerequisites
Create a new streaming dataset in Power BI
Navigate to Power BI.
Open a workspace.
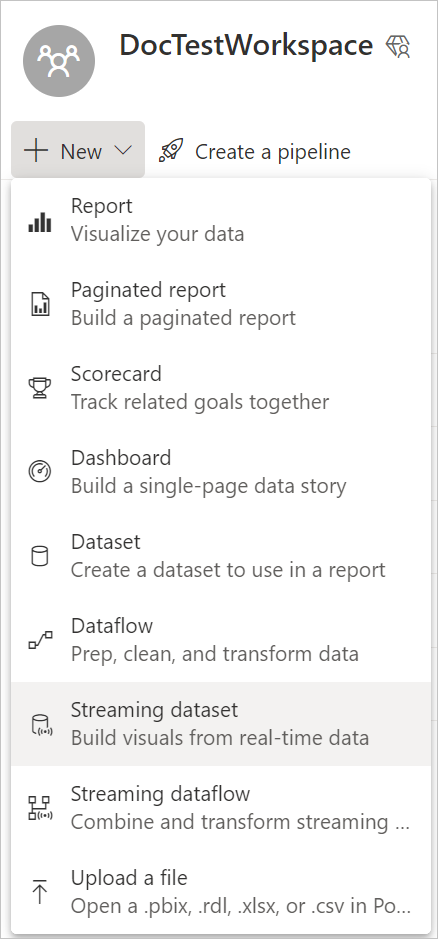
From the workspace, select New > Streaming dataset.
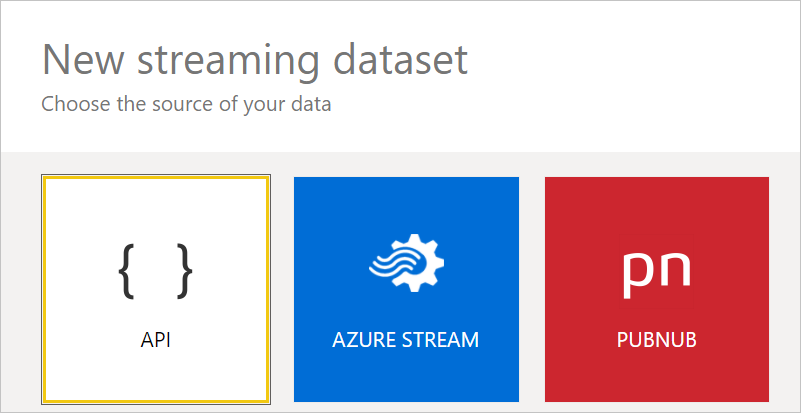
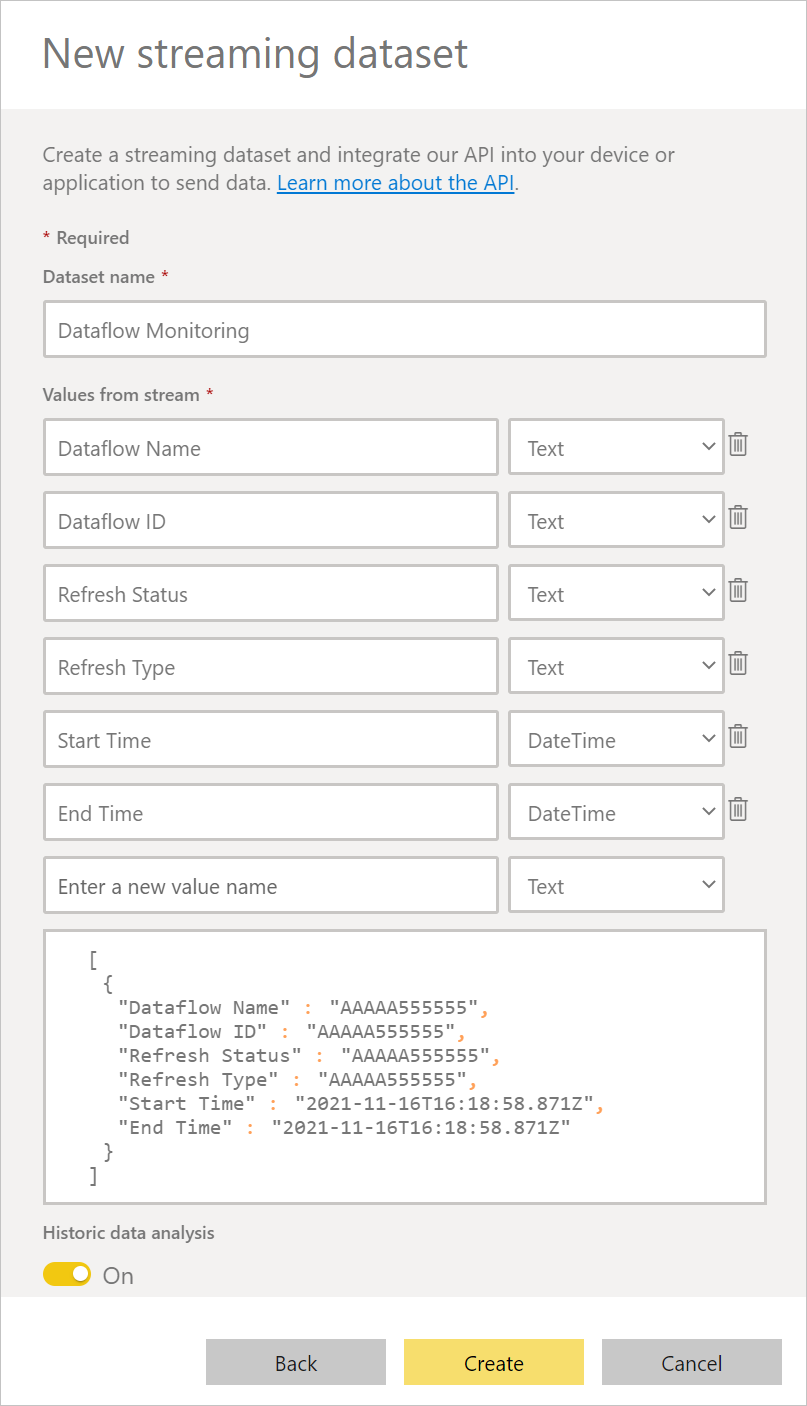
From New streaming dataset, select the API tile, and then select Next.
In the new pane, turn Historic data analysis on.
Enter the following values, and then select Create.
- Dataset Name: "Dataflow Monitoring".
- Value: "Dataflow Name", Data type: Text.
- Value: "Dataflow ID", Data type: Text.
- Value: "Refresh Status", Data type: Text.
- Value: "Refresh Type", Data type: Text.
- Value: "Start Time", Data type: Date and Time.
- Value: "End Time", Data type: Date and Time.
Create a dataflow
If you do not already have one, create a dataflow. You can create a dataflow in either Power BI dataflows or Power Apps dataflows.
Create a flow in Power Automate
Navigate to Power Automate.
Select Create > Automated cloud flow.
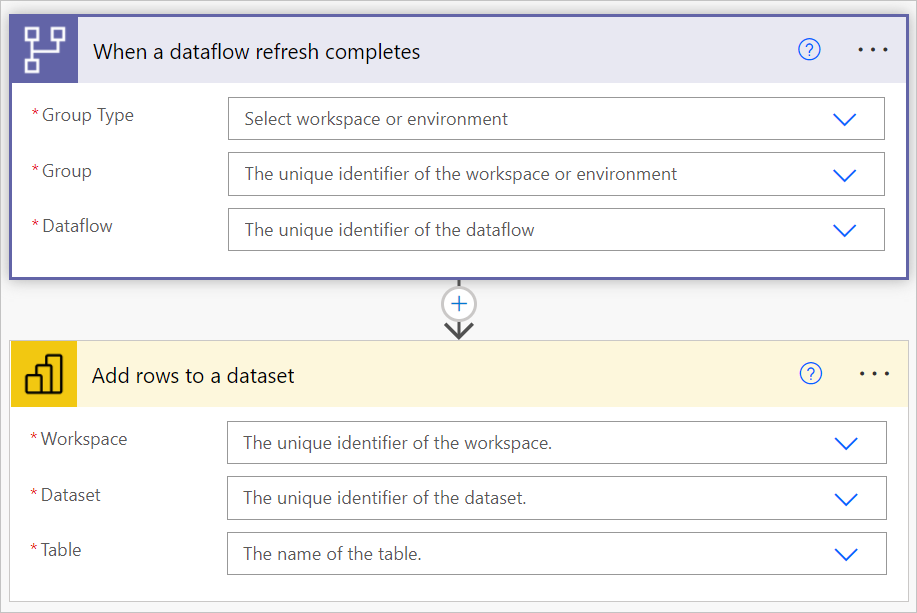
Enter a flow name, and then search for the "When a dataflow refresh completes" connector. Select this connector from the list, and then select Create.
Customize the connector. Enter the following information on your dataflow:
- Group Type: Select Environment when connecting to Power Apps and Workspace when connecting to Power BI.
- Group: Select the Power Apps environment or the Power BI workspace your dataflow is in.
- Dataflow: Select your dataflow by name.
Select new step to add an action to your flow.
Search for the connector "Add rows to a dataset" from Power BI, and then select it.
Customize the connector. Enter the following information:
- Workspace ID: Select the Power BI workspace that contains your streaming dataset.
- Dataset: Select the streaming dataset Dataflow Monitoring that you previously created in Create a new streaming dataset in Power BI.
- Table: Select RealTimeData.
Add dynamic values to the required fields.
For every required field, you need to add a dynamic value. This value is the output of the metadata of the dataflow run.
Select the field next to Dataflow Name and then select the lightning button.
Select Dataflow Name from the Dynamic content context box.
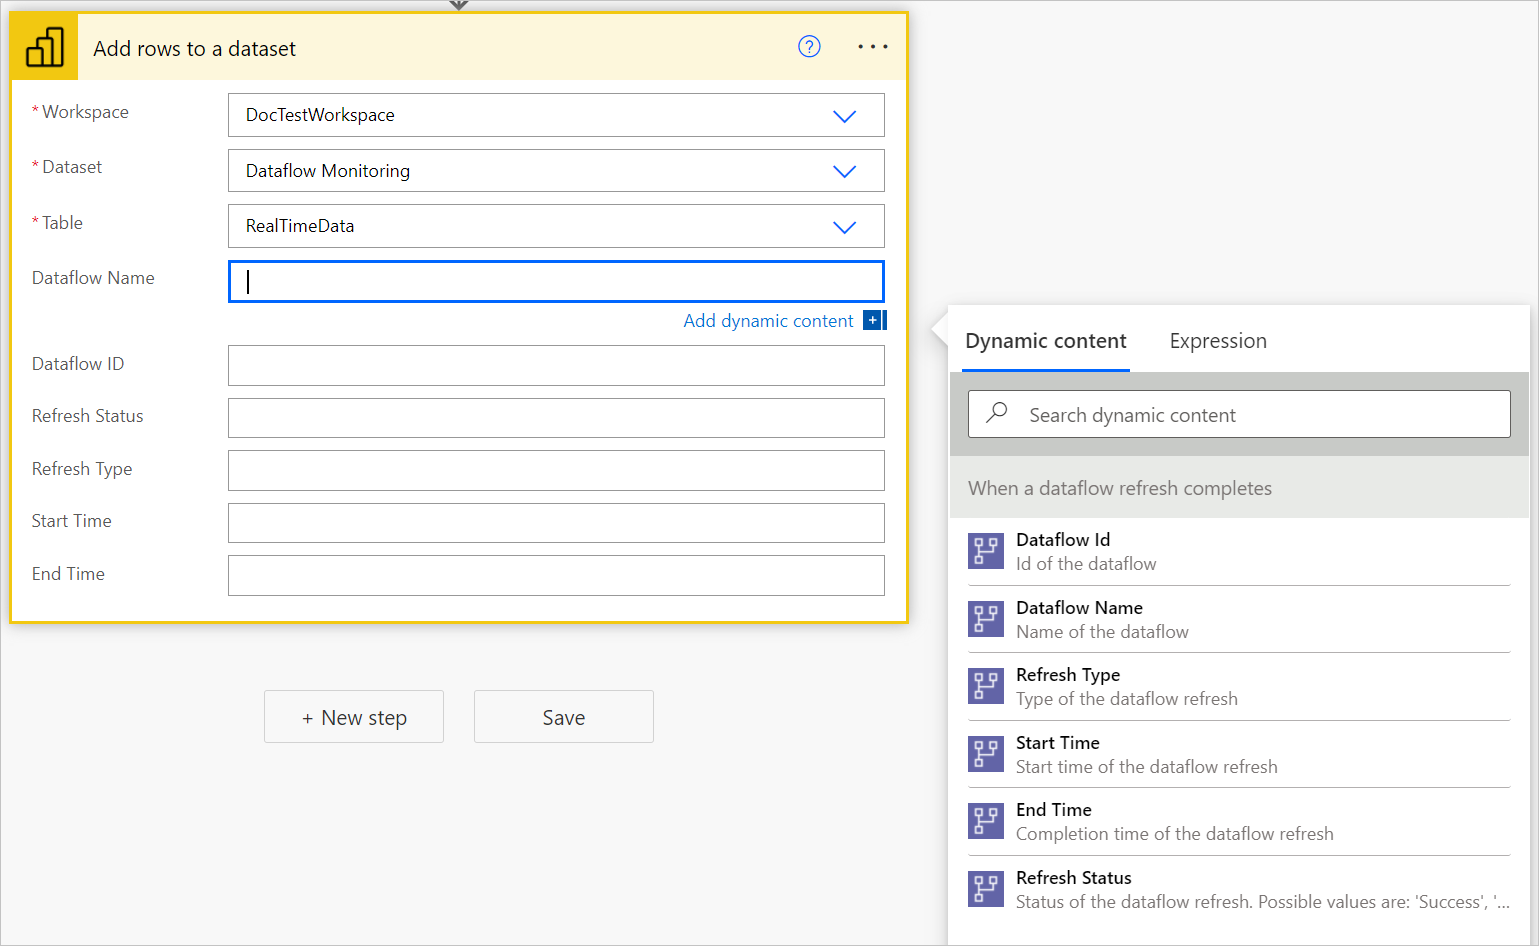
Repeat this process for all required fields.
Save the flow.

Create a Power BI Report
Navigate to Power BI.
Navigate to the streaming dataset (in this example, in the DocTestWorkspace workspace, from the Dataflow Monitoring dataset, select Create Report).
Create your own report on top of this data.
Feedback
Coming soon: Throughout 2024 we will be phasing out GitHub Issues as the feedback mechanism for content and replacing it with a new feedback system. For more information see: https://aka.ms/ContentUserFeedback.
Submit and view feedback for