ทําความเข้าใจการแมปมุมมองข้อมูลในวิชวล Power BI
บทความนี้อธิบายถึงการแมปมุมมองข้อมูลและอธิบายวิธีการใช้บทบาทข้อมูลเพื่อสร้างวิชวลชนิดต่าง ๆ ซึ่งอธิบายวิธีการระบุข้อกําหนดเงื่อนไขสําหรับบทบาทข้อมูลและชนิดที่แตกต่างกันdataMappings
การแมปที่ถูกต้องแต่ละครั้งจะสร้างมุมมองข้อมูล คุณสามารถให้การแมปข้อมูลได้หลายรายการภายใต้เงื่อนไขบางประการ ตัวเลือกการแมปที่สนับสนุนคือ:
"dataViewMappings": [
    {
        "conditions": [ ... ],
        "categorical": { ... },
        "single": { ... },
        "table": { ... },
        "matrix": { ... }
    }
]
Power BI สร้างการแมปไปยังมุมมองข้อมูลเฉพาะเมื่อมีการกําหนดการแมปที่ถูกต้องใน dataViewMappingsด้วย
กล่าวอีกนัย categorical หนึ่งคือ อาจกําหนดใน dataViewMappings แต่การแมปอื่นๆ เช่น table หรือ singleอาจไม่เป็นเช่นนั้น ในกรณีดังกล่าว Power BI สร้างมุมมองข้อมูลด้วยการแมปเดียว categorical ในขณะที่ table การทําแผนที่อื่น ๆ ยังคงไม่ได้ถูกกําหนด ตัวอย่างเช่น:
"dataViewMappings": [
    {
    "categorical": {
        "categories": [ ... ],
        "values": [ ... ]
    },
    "metadata": { ... }
    }
]
เงื่อนไข
ส่วน conditions สร้างกฎสําหรับการแมปข้อมูลที่เฉพาะเจาะจง ถ้าข้อมูลตรงกับชุดของเงื่อนไขที่อธิบายวิชวลจะยอมรับข้อมูลได้ถูกต้อง
สําหรับแต่ละเขตข้อมูล คุณสามารถระบุค่าต่ําสุดและสูงสุดได้ ค่า แสดงถึงจํานวนของเขตข้อมูลที่สามารถผูกกับบทบาทข้อมูลนั้นได้
หมายเหตุ
ถ้ามีการเว้นบทบาทข้อมูลไว้ในเงื่อนไข อาจมีเขตข้อมูลจํานวนเท่ากับจํานวนหนึ่ง
ในตัวอย่าง category ต่อไปนี้ จะจํากัดอยู่เพียงหนึ่งเขตข้อมูล และ measure ถูกจํากัดไว้ที่เขตข้อมูลสองเขต
"conditions": [
    { "category": { "max": 1 }, "measure": { "max": 2 } },
]
คุณยังสามารถตั้งค่าเงื่อนไขหลายเงื่อนไขสําหรับบทบาทข้อมูลได้ ในกรณีดังกล่าว ข้อมูลจะถูกต้องหากเป็นไปตามเงื่อนไขอย่างใดอย่างหนึ่ง
"conditions": [
    { "category": { "min": 1, "max": 1 }, "measure": { "min": 2, "max": 2 } },
    { "category": { "min": 2, "max": 2 }, "measure": { "min": 1, "max": 1 } }
]
ในตัวอย่างก่อนหน้านี้ จําเป็นต้องใช้หนึ่งในสองเงื่อนไขต่อไปนี้:
- เขตข้อมูลประเภทหนึ่งรายการอย่างแน่นอนและหน่วยวัดสองรายการอย่างแน่นอน
- สองประเภทอย่างแน่นอนและหนึ่งหน่วยวัดอย่างแน่นอน
การแมปข้อมูลเดียว
การแมปข้อมูลเดี่ยวเป็นรูปแบบที่ง่ายที่สุดของการแมปข้อมูล ซึ่งเป็นการยอมรับเขตข้อมูลหน่วยวัดเดียวและส่งกลับผลรวม ถ้าเขตข้อมูลเป็นตัวเลข จะส่งกลับผลรวม มิฉะนั้นจะส่งกลับจํานวนของค่าที่ไม่ซ้ํากัน
หากต้องการใช้การแมปข้อมูลเดี่ยว ให้กําหนดชื่อของบทบาทข้อมูลที่คุณต้องการแมป การแมปนี้จะทํางานกับเขตข้อมูลหน่วยวัดเดียวเท่านั้น ถ้ามีการกําหนดเขตข้อมูลที่สอง จะไม่มีการสร้างมุมมองข้อมูล ดังนั้นจึงเป็นแนวทางปฏิบัติที่ดีที่จะรวมเงื่อนไขที่จํากัดข้อมูลไว้ในเขตข้อมูลเดียว
หมายเหตุ
การแมปข้อมูลนี้ไม่สามารถใช้ร่วมกับการแมปข้อมูลอื่น ๆ ได้ ซึ่งหมายถึงการลดข้อมูลให้เป็นค่าตัวเลขเดียว
ตัวอย่างเช่น:
{
    "dataRoles": [
        {
            "displayName": "Y",
            "name": "Y",
            "kind": "Measure"
        }
    ],
    "dataViewMappings": [
        {
            "conditions": [
                {
                    "Y": {
                        "max": 1
                    }
                }
            ],
            "single": {
                "role": "Y"
            }
        }
    ]
}
มุมมองข้อมูลที่เกิดขึ้นยังคงสามารถมีการแมปชนิดอื่น ๆ ได้ เช่น ตารางหรือตามประเภท แต่การแมปแต่ละครั้งจะมีเพียงค่าเดียวเท่านั้น แนวทางปฏิบัติที่ดีที่สุดคือ เข้าถึงค่าเฉพาะในการแมปเดียวเท่านั้น
{
    "dataView": [
        {
            "metadata": null,
            "categorical": null,
            "matrix": null,
            "table": null,
            "tree": null,
            "single": {
                "value": 94163140.3560001
            }
        }
    ]
}
ตัวอย่างโค้ดต่อไปนี้ประมวลผลการแมปมุมมองข้อมูลแบบง่าย:
"use strict";
import powerbi from "powerbi-visuals-api";
import DataView = powerbi.DataView;
import DataViewSingle = powerbi.DataViewSingle;
// standard imports
// ...

export class Visual implements IVisual {
    private target: HTMLElement;
    private host: IVisualHost;
    private valueText: HTMLParagraphElement;

    constructor(options: VisualConstructorOptions) {
        // constructor body
        this.target = options.element;
        this.host = options.host;
        this.valueText = document.createElement("p");
        this.target.appendChild(this.valueText);
        // ...
    }

    public update(options: VisualUpdateOptions) {
        const dataView: DataView = options.dataViews[0];
        const singleDataView: DataViewSingle = dataView.single;

        if (!singleDataView ||
            !singleDataView.value ) {
            return
        }

        this.valueText.innerText = singleDataView.value.toString();
    }
}
ตัวอย่างโค้ดก่อนหน้านี้ส่งผลให้เกิดการแสดงค่าเดียวจาก Power BI:

การแมปข้อมูลจัดกลุ่ม
การแมปข้อมูลจัดกลุ่มถูกใช้เพื่อให้ได้มาซึ่งการจัดกลุ่มหรือประเภทของข้อมูลอิสระ ประเภทยังสามารถจัดกลุ่มเข้าด้วยกันโดยใช้ "จัดกลุ่มตาม" ในการแมปข้อมูล
การแมปข้อมูลจัดกลุ่มพื้นฐาน
พิจารณาบทบาทข้อมูลต่อไปนี้และการแมป:
"dataRoles":[
    {
        "displayName": "Category",
        "name": "category",
        "kind": "Grouping"
    },
    {
        "displayName": "Y Axis",
        "name": "measure",
        "kind": "Measure"
    }
],
"dataViewMappings": {
    "categorical": {
        "categories": {
            "for": { "in": "category" }
        },
        "values": {
            "select": [
                { "bind": { "to": "measure" } }
            ]
        }
    }
}
ตัวอย่างก่อนหน้านี้อ่าน "แมปบทบาทข้อมูลของฉันcategoryเพื่อให้สําหรับทุกเขตข้อมูลที่ฉันลากลงใน categoryข้อมูลจะถูกแมปไปยังcategorical.categories นอกจากนี้ยังแมปบทบาทข้อมูลของฉัน measure ไปยัง categorical.valuesอีกด้วย"
- สำหรับ ใน: รวม รายการทั้งหมดใน บทบาทข้อมูลนี้ในคิวรีข้อมูล
- ผูก ไปยัง: สร้างผลลัพธ์เดียวกับสําหรับ... ใน แต่คาดว่าจะมีบทบาทข้อมูลที่มีเงื่อนไขที่จํากัดให้อยู่ในเขตข้อมูลเดียว
จัดกลุ่มข้อมูลจัดกลุ่ม
ตัวอย่างถัดไปใช้บทบาทข้อมูลสองบทบาทเดียวกันกับตัวอย่างก่อนหน้านี้ และเพิ่มบทบาทข้อมูลอีกสองบทบาทที่ชื่อว่า grouping และmeasure2
"dataRole":[
    {
        "displayName": "Category",
        "name": "category",
        "kind": "Grouping"
    },
    {
        "displayName": "Y Axis",
        "name": "measure",
        "kind": "Measure"
    },
    {
        "displayName": "Grouping with",
        "name": "grouping",
        "kind": "Grouping"
    },
    {
        "displayName": "X Axis",
        "name": "measure2",
        "kind": "Grouping"
    }
],
"dataViewMappings":{
    "categorical": {
        "categories": {
            "for": { "in": "category" }
        },
        "values": {
            "group": {
                "by": "grouping",
                "select":[
                    { "bind": { "to": "measure" } },
                    { "bind": { "to": "measure2" } }
                ]
            }
        }
    }
}
ความแตกต่างระหว่างการแมปนี้กับการแมปพื้นฐานคือวิธีการ categorical.values แมป เมื่อคุณแมป measure บทบาทข้อมูล และ measure2 ไปยังบทบาท groupingข้อมูล แกน x และแกน y สามารถปรับมาตราส่วนได้อย่างเหมาะสม
จัดกลุ่มข้อมูลแบบลําดับชั้น
ในตัวอย่างถัดไป ข้อมูลจัดกลุ่มถูกใช้เพื่อสร้างลําดับชั้น ซึ่งสามารถใช้เพื่อสนับสนุน การดําเนินการดูรายละเอียด แนวลึก
ตัวอย่างต่อไปนี้แสดงบทบาทข้อมูลและการแมป:
"dataRoles": [
    {
        "displayName": "Categories",
        "name": "category",
        "kind": "Grouping"
    },
    {
        "displayName": "Measures",
        "name": "measure",
        "kind": "Measure"
    },
    {
        "displayName": "Series",
        "name": "series",
        "kind": "Measure"
    }
],
"dataViewMappings": [
    {
        "categorical": {
            "categories": {
                "for": {
                    "in": "category"
                }
            },
            "values": {
                "group": {
                    "by": "series",
                    "select": [{
                            "for": {
                                "in": "measure"
                            }
                        }
                    ]
                }
            }
        }
    }
]
พิจารณาข้อมูลตามประเภทต่อไปนี้:
| ประเทศ/ภูมิภาค | 2013 | 2014 | 2015 | 2016 |
|---|---|---|---|---|
| USA | X | X | 650 | 350 |
| แคนาดา | X | 630 | 490 | X |
| เม็กซิโก | 645 | X | x | X |
| สหราชอาณาจักร | X | X | 831 | X |
Power BI สร้างมุมมองข้อมูลแบบจัดกลุ่มด้วยชุดประเภทต่อไปนี้
{
    "categorical": {
        "categories": [
            {
                "source": {...},
                "values": [
                    "Canada",
                    "USA",
                    "UK",
                    "Mexico"
                ],
                "identity": [...],
                "identityFields": [...],
            }
        ]
    }
}
แต่ละcategoryแมปไปยังชุดของvalues valuesแต่ละรายการเหล่านี้จะถูกจัดกลุ่มตาม seriesซึ่งแสดงเป็นปี
ตัวอย่างเช่น อาร์เรย์ แต่ละ values ตัวแสดงถึงหนึ่งปี
นอกจากนี้ อาร์เรย์ แต่ละรายการ values ยังมีค่าสี่ค่า: Canada, USA, UK และ Mexico
{
    "values": [
        // Values for year 2013
        {
            "source": {...},
            "values": [
                null, // Value for `Canada` category
                null, // Value for `USA` category
                null, // Value for `UK` category
                645 // Value for `Mexico` category
            ],
            "identity": [...],
        },
        // Values for year 2014
        {
            "source": {...},
            "values": [
                630, // Value for `Canada` category
                null, // Value for `USA` category
                null, // Value for `UK` category
                null // Value for `Mexico` category
            ],
            "identity": [...],
        },
        // Values for year 2015
        {
            "source": {...},
            "values": [
                490, // Value for `Canada` category
                650, // Value for `USA` category
                831, // Value for `UK` category
                null // Value for `Mexico` category
            ],
            "identity": [...],
        },
        // Values for year 2016
        {
            "source": {...},
            "values": [
                null, // Value for `Canada` category
                350, // Value for `USA` category
                null, // Value for `UK` category
                null // Value for `Mexico` category
            ],
            "identity": [...],
        }
    ]
}
ตัวอย่างโค้ดต่อไปนี้มีไว้สําหรับการประมวลผลการแมปมุมมองข้อมูลแบบจัดกลุ่ม ตัวอย่างนี้สร้างโครงสร้างแบบลําดับชั้น ค่าปี>ของประเทศ/ภูมิภาค>
"use strict";
import powerbi from "powerbi-visuals-api";
import DataView = powerbi.DataView;
import DataViewCategorical = powerbi.DataViewCategorical;
import DataViewValueColumnGroup = powerbi.DataViewValueColumnGroup;
import PrimitiveValue = powerbi.PrimitiveValue;
// standard imports
// ...

export class Visual implements IVisual {
    private target: HTMLElement;
    private host: IVisualHost;
    private categories: HTMLElement;

    constructor(options: VisualConstructorOptions) {
        // constructor body
        this.target = options.element;
        this.host = options.host;
        this.categories = document.createElement("pre");
        this.target.appendChild(this.categories);
        // ...
    }

    public update(options: VisualUpdateOptions) {
        const dataView: DataView = options.dataViews[0];
        const categoricalDataView: DataViewCategorical = dataView.categorical;

        if (!categoricalDataView ||
            !categoricalDataView.categories ||
            !categoricalDataView.categories[0] ||
            !categoricalDataView.values) {
            return;
        }

        // Categories have only one column in data buckets
        // To support several columns of categories data bucket, iterate categoricalDataView.categories array.
        const categoryFieldIndex = 0;
        // Measure has only one column in data buckets.
        // To support several columns on data bucket, iterate years.values array in map function
        const measureFieldIndex = 0;
        let categories: PrimitiveValue[] = categoricalDataView.categories[categoryFieldIndex].values;
        let values: DataViewValueColumnGroup[] = categoricalDataView.values.grouped();

        let data = {};
        // iterate categories/countries-regions
        categories.map((category: PrimitiveValue, categoryIndex: number) => {
            data[category.toString()] = {};
            // iterate series/years
            values.map((years: DataViewValueColumnGroup) => {
                if (!data[category.toString()][years.name] && years.values[measureFieldIndex].values[categoryIndex]) {
                    data[category.toString()][years.name] = []
                }
                if (years.values[0].values[categoryIndex]) {
                    data[category.toString()][years.name].push(years.values[measureFieldIndex].values[categoryIndex]);
                }
            });
        });

        this.categories.innerText = JSON.stringify(data, null, 6);
        console.log(data);
    }
}
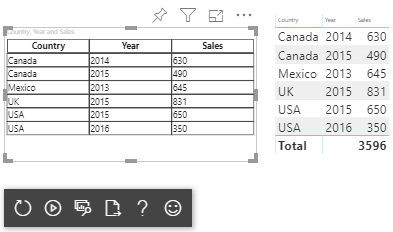
นี่คือวิชวลผลลัพธ์:

การแมปตาราง
มุมมอง ข้อมูลตาราง เป็นรายการของจุดข้อมูลที่สามารถรวมจุดข้อมูลตัวเลขได้เป็นหลัก
ตัวอย่างเช่น ใช้ ข้อมูลเดียวกันในส่วนก่อนหน้า แต่ด้วยความสามารถต่อไปนี้:
"dataRoles": [
    {
        "displayName": "Column",
        "name": "column",
        "kind": "Grouping"
    },
    {
        "displayName": "Value",
        "name": "value",
        "kind": "Measure"
    }
],
"dataViewMappings": [
    {
        "table": {
            "rows": {
                "select": [
                    {
                        "for": {
                            "in": "column"
                        }
                    },
                    {
                        "for": {
                            "in": "value"
                        }
                    }
                ]
            }
        }
    }
]
แสดงภาพมุมมองข้อมูลตารางดังตัวอย่างนี้:
| ประเทศ/ภูมิภาค | Year | การขาย |
|---|---|---|
| USA | 2016 | 100 |
| USA | 2015 | 50 |
| แคนาดา | 2015 | 200 |
| แคนาดา | 2015 | 50 |
| เม็กซิโก | 2013 | 300 |
| สหราชอาณาจักร | 2014 | 150 |
| USA | 2015 | 75 |
การผูกข้อมูล:

Power BI จะแสดงข้อมูลของคุณเป็นมุมมองข้อมูลตาราง อย่าสันนิษฐานว่ามีการสั่งซื้อข้อมูลแล้ว
{
    "table" : {
        "columns": [...],
        "rows": [
            [
                "Canada",
                2014,
                630
            ],
            [
                "Canada",
                2015,
                490
            ],
            [
                "Mexico",
                2013,
                645
            ],
            [
                "UK",
                2014,
                831
            ],
            [
                "USA",
                2015,
                650
            ],
            [
                "USA",
                2016,
                350
            ]
        ]
    }
}
เมื่อต้องการรวมข้อมูล ให้เลือกเขตข้อมูลที่ต้องการ จากนั้นเลือกผลรวม

ตัวอย่างโค้ดเพื่อประมวลผลการแมปมุมมองข้อมูลแบบตาราง
"use strict";
import "./../style/visual.less";
import powerbi from "powerbi-visuals-api";
// ...
import DataViewMetadataColumn = powerbi.DataViewMetadataColumn;
import DataViewTable = powerbi.DataViewTable;
import DataViewTableRow = powerbi.DataViewTableRow;
import PrimitiveValue = powerbi.PrimitiveValue;
// standard imports
// ...

export class Visual implements IVisual {
    private target: HTMLElement;
    private host: IVisualHost;
    private table: HTMLParagraphElement;

    constructor(options: VisualConstructorOptions) {
        // constructor body
        this.target = options.element;
        this.host = options.host;
        this.table = document.createElement("table");
        this.target.appendChild(this.table);
        // ...
    }

    public update(options: VisualUpdateOptions) {
        const dataView: DataView = options.dataViews[0];
        const tableDataView: DataViewTable = dataView.table;

        if (!tableDataView) {
            return
        }
        while(this.table.firstChild) {
            this.table.removeChild(this.table.firstChild);
        }

        //draw header
        const tableHeader = document.createElement("th");
        tableDataView.columns.forEach((column: DataViewMetadataColumn) => {
            const tableHeaderColumn = document.createElement("td");
            tableHeaderColumn.innerText = column.displayName
            tableHeader.appendChild(tableHeaderColumn);
        });
        this.table.appendChild(tableHeader);

        //draw rows
        tableDataView.rows.forEach((row: DataViewTableRow) => {
            const tableRow = document.createElement("tr");
            row.forEach((columnValue: PrimitiveValue) => {
                const cell = document.createElement("td");
                cell.innerText = columnValue.toString();
                tableRow.appendChild(cell);
            })
            this.table.appendChild(tableRow);
        });
    }
}
ไฟล์ style/visual.less สไตล์ของวิชวลประกอบด้วยเค้าโครงสําหรับตาราง:
table {
    display: flex;
    flex-direction: column;
}

tr, th {
    display: flex;
    flex: 1;
}

td {
    flex: 1;
    border: 1px solid black;
}
วิชวลผลลัพธ์จะมีลักษณะดังนี้:
การแมปข้อมูลเมทริกซ์
การแมปข้อมูลเมทริกซ์ คล้ายกับการแมปข้อมูลตาราง แต่มีการแสดงแถวแบบลําดับชั้น ค่าบทบาทข้อมูลใด ๆ สามารถใช้เป็นค่าส่วนหัวคอลัมน์ได้
{
    "dataRoles": [
        {
            "name": "Category",
            "displayName": "Category",
            "displayNameKey": "Visual_Category",
            "kind": "Grouping"
        },
        {
            "name": "Column",
            "displayName": "Column",
            "displayNameKey": "Visual_Column",
            "kind": "Grouping"
        },
        {
            "name": "Measure",
            "displayName": "Measure",
            "displayNameKey": "Visual_Values",
            "kind": "Measure"
        }
    ],
    "dataViewMappings": [
        {
            "matrix": {
                "rows": {
                    "for": {
                        "in": "Category"
                    }
                },
                "columns": {
                    "for": {
                        "in": "Column"
                    }
                },
                "values": {
                    "select": [
                        {
                            "for": {
                                "in": "Measure"
                            }
                        }
                    ]
                }
            }
        }
    ]
}
โครงสร้างแบบลําดับชั้นของข้อมูลเมทริกซ์
Power BI สร้างโครงสร้างข้อมูลแบบลําดับชั้น รากของลําดับชั้นต้นไม้ประกอบด้วยข้อมูลจาก คอลัมน์ โหนดแม่ ของ Category บทบาทข้อมูลที่มีโหนดลูกจาก คอลัมน์ โหนดลูก ของตารางบทบาทข้อมูล
แบบจําลองแสดงความหมาย:
| ผู้ปกครอง | รายการรอง | หลานชาย | คอลัมน์ | ค่า |
|---|---|---|---|---|
| Parent1 | Child1 | Grand child1 | Col1 | 5 |
| Parent1 | Child1 | Grand child1 | Col2 | 6 |
| Parent1 | Child1 | Grand child2 | Col1 | 7 |
| Parent1 | Child1 | Grand child2 | Col2 | 8 |
| Parent1 | Child2 | Grand child3 | Col1 | 5 |
| Parent1 | Child2 | Grand child3 | Col2 | 3 |
| Parent1 | Child2 | Grand child4 | Col1 | 4 |
| Parent1 | Child2 | Grand child4 | Col2 | 9 |
| Parent1 | Child2 | Grand child5 | Col1 | 3 |
| Parent1 | Child2 | Grand child5 | Col2 | 5 |
| Parent2 | Child3 | Grand child6 | Col1 | 1 |
| Parent2 | Child3 | Grand child6 | Col2 | 2 |
| Parent2 | Child3 | Grand child7 | Col1 | 7 |
| Parent2 | Child3 | Grand child7 | Col2 | 1 |
| Parent2 | Child3 | Grand child8 | Col1 | 10 |
| Parent2 | Child3 | Grand child8 | Col2 | 13 |
วิชวลเมทริกซ์หลักของ Power BI แสดงข้อมูลเป็นตาราง
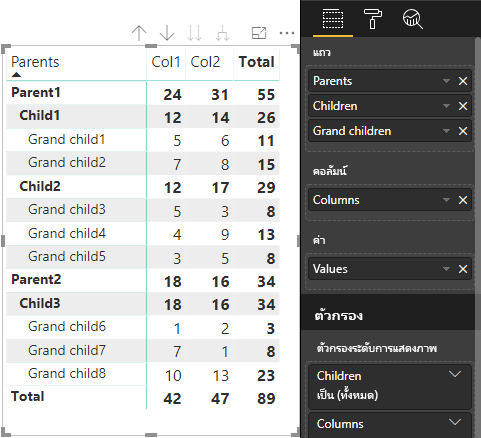
วิชวลได้รับโครงสร้างข้อมูลตามที่อธิบายไว้ในโค้ดต่อไปนี้ (แสดงเฉพาะสองแถวแรกของตารางเท่านั้น):
{
    "metadata": {...},
    "matrix": {
        "rows": {
            "levels": [...],
            "root": {
                "childIdentityFields": [...],
                "children": [
                    {
                        "level": 0,
                        "levelValues": [...],
                        "value": "Parent1",
                        "identity": {...},
                        "childIdentityFields": [...],
                        "children": [
                            {
                                "level": 1,
                                "levelValues": [...],
                                "value": "Child1",
                                "identity": {...},
                                "childIdentityFields": [...],
                                "children": [
                                    {
                                        "level": 2,
                                        "levelValues": [...],
                                        "value": "Grand child1",
                                        "identity": {...},
                                        "values": {
                                            "0": {
                                                "value": 5 // value for Col1
                                            },
                                            "1": {
                                                "value": 6 // value for Col2
                                            }
                                        }
                                    },
                                    ...
                                ]
                            },
                            ...
                        ]
                    },
                    ...
                ]
            }
        },
        "columns": {
            "levels": [...],
            "root": {
                "childIdentityFields": [...],
                "children": [
                    {
                        "level": 0,
                        "levelValues": [...],
                        "value": "Col1",
                        "identity": {...}
                    },
                    {
                        "level": 0,
                        "levelValues": [...],
                        "value": "Col2",
                        "identity": {...}
                    },
                    ...
                ]
            }
        },
        "valueSources": [...]
    }
}
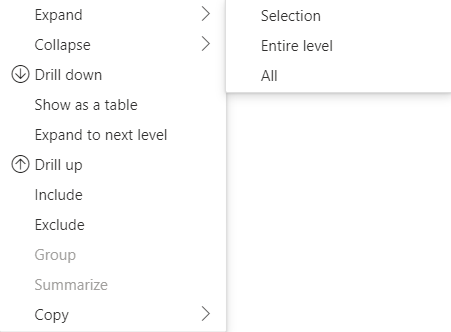
ขยายและยุบส่วนหัวของแถว
สําหรับ API 4.1.0 หรือใหม่กว่า ข้อมูลเมทริกซ์สนับสนุน การขยายและการยุบส่วนหัวของแถว จาก API 4.2 คุณสามารถขยาย/ยุบทั้งระดับโดยทางโปรแกรมได้ คุณลักษณะขยายและยุบจะปรับให้เหมาะสมในการดึงข้อมูลไปยัง dataView โดยอนุญาตให้ผู้ใช้ขยายหรือยุบแถวโดยไม่ต้องดึงข้อมูลทั้งหมดสําหรับระดับถัดไป ซึ่งจะดึงข้อมูลสําหรับแถวที่เลือกเท่านั้น สถานะการขยายของส่วนหัวของแถวยังคงสอดคล้องกันระหว่างบุ๊กมาร์กและแม้กระทั่งในรายงานที่บันทึกไว้ ซึ่งไม่ได้เฉพาะเจาะจงสําหรับวิชวลแต่ละภาพ
สามารถเพิ่มคําสั่งขยายและยุบไปยังเมนูบริบทได้โดยการจัดหา dataRoles พารามิเตอร์ไปยัง showContextMenu เมธอด
หากต้องการขยายจํานวนมากของจุดข้อมูล ให้ใช้ API ดึงข้อมูลเพิ่มเติมด้วย API แบบขยาย/ยุบ
คุณลักษณะ API
องค์ประกอบต่อไปนี้ถูกเพิ่มไปยัง API เวอร์ชัน 4.1.0 เพื่อเปิดใช้งานการขยายและการยุบส่วนหัวของแถว:
ค่า
isCollapsedสถานะในDataViewTreeNode:interface DataViewTreeNode { //... /** * TRUE if the node is Collapsed * FALSE if it is Expanded * Undefined if it cannot be Expanded (e.g. subtotal) */ isCollapsed?: boolean; }toggleExpandCollapseวิธีการในISelectionMangerอินเทอร์เฟซ:interface ISelectionManager { //... showContextMenu(selectionId: ISelectionId, position: IPoint, dataRoles?: string): IPromise<{}>; // dataRoles is the name of the role of the selected data point toggleExpandCollapse(selectionId: ISelectionId, entireLevel?: boolean): IPromise<{}>; // Expand/Collapse an entire level will be available from API 4.2.0 //... }ค่า
canBeExpandedสถานะใน DataViewHierarchyLevel:interface DataViewHierarchyLevel { //... /** If TRUE, this level can be expanded/collapsed */ canBeExpanded?: boolean; }
ข้อกําหนดของวิชวล
เมื่อต้องการเปิดใช้งานคุณลักษณะขยายการยุบบนวิชวลโดยใช้มุมมองข้อมูลเมทริกซ์:
เพิ่มโค้ดต่อไปนี้ลงในไฟล์ capabilities.json:
   "expandCollapse": {
    "roles": ["Rows"], //”Rows” is the name of rows data role
    "addDataViewFlags": {
        "defaultValue": true //indicates if the DataViewTreeNode will get the isCollapsed flag by default
    }
},
ยืนยันว่าบทบาทสามารถเจาะได้:
    "drilldown": {
    "roles": ["Rows"]
},
สําหรับแต่ละโหนด ให้สร้างอินสแตนซ์ของตัวสร้างการเลือกโดยการ
withMatrixNodeเรียกใช้วิธีการ ในระดับลําดับชั้นโหนดที่เลือกและสร้างselectionIdตัวอย่างเช่น:let nodeSelectionBuilder: ISelectionIdBuilder = visualHost.createSelectionIdBuilder(); // parantNodes is a list of the parents of the selected node. // node is the current node which the selectionId is created for. parentNodes.push(node); for (let i = 0; i < parentNodes.length; i++) { nodeSelectionBuilder = nodeSelectionBuilder.withMatrixNode(parentNodes[i], levels); } const nodeSelectionId: ISelectionId = nodeSelectionBuilder.createSelectionId();สร้างอินสแตนซ์ของตัวจัดการการเลือก และใช้
selectionManager.toggleExpandCollapse()วิธีการ ด้วยพารามิเตอร์ของselectionIdที่คุณสร้างขึ้นสําหรับโหนดที่เลือก ตัวอย่างเช่น:// handle click events to apply expand\collapse action for the selected node button.addEventListener("click", () => { this.selectionManager.toggleExpandCollapse(nodeSelectionId); });
หมายเหตุ
- ถ้าโหนดที่เลือกไม่ใช่โหนดแถว PowerBI จะละเว้นการเรียกขยายและยุบ และคําสั่งขยายและยุบจะถูกลบออกจากเมนูบริบท
- พารามิเตอร์
dataRolesจําเป็นสําหรับshowContextMenuเมธอด เฉพาะเมื่อวิชวลdrilldownรองรับหรือexpandCollapseคุณลักษณะ หากวิชวลรองรับคุณลักษณะเหล่านี้ แต่ไม่มี dataRoles ให้ ข้อผิดพลาดจะแสดงผลไปยังคอนโซลเมื่อใช้วิชวลของนักพัฒนาหรือหากดีบักวิชวลสาธารณะด้วยการเปิดใช้งานโหมดดีบัก
ข้อควรพิจารณาและข้อจำกัด
- หลังจากที่คุณขยายโหนด ขีดจํากัดข้อมูลใหม่จะถูกนําไปใช้กับ DataView DataView ใหม่อาจไม่มีโหนดบางโหนดที่แสดงใน DataView ก่อนหน้านี้
- เมื่อใช้การขยายหรือยุบ จะมีการเพิ่มผลรวมแม้ว่าวิชวลไม่ได้ร้องขอ
- ไม่สนับสนุนการขยายและการยุบคอลัมน์
เก็บคอลัมน์เมตาดาต้าทั้งหมด
สําหรับ API 5.1.0 หรือใหม่กว่า การทําให้คอลัมน์เมตาดาต้าทั้งหมดได้รับการสนับสนุน คุณลักษณะนี้ช่วยให้วิชวลได้รับเมตาดาต้าสําหรับคอลัมน์ทั้งหมดไม่ว่าการฉายภาพที่ใช้งานอยู่คืออะไร
เพิ่มบรรทัดต่อไปนี้ลงในไฟล์ capabilities.json ของคุณ:
"keepAllMetadataColumns": {
    "type": "boolean",
    "description": "Indicates that visual is going to receive all metadata columns, no matter what the active projections are"
}
การตั้งค่าคุณสมบัติ true นี้จะส่งผลให้ได้รับเมตาดาต้าทั้งหมด รวมถึงจากคอลัมน์ที่ยุบ การตั้งค่าไป false หรือปล่อยไว้โดยไม่ได้กําหนดไว้จะส่งผลให้ได้รับเมตาดาต้าเฉพาะในคอลัมน์ที่มีโปรเจคชันที่ใช้งานอยู่เท่านั้น (ตัวอย่างเช่น ขยาย)
อัลกอริทึมในการลดข้อมูล
อัลกอริทึมการลดข้อมูลจะควบคุมว่าข้อมูลใดและจะได้รับข้อมูลเท่าใดในมุมมองข้อมูล
จํานวนถูกตั้งค่าเป็นจํานวนสูงสุดของค่าที่มุมมองข้อมูลสามารถยอมรับได้ ถ้ามีค่าจํานวนมากกว่า อัลกอริทึมการลดมิติข้อมูลจะกําหนดค่าที่ควรได้รับ
ประเภทของอัลกอริทึมในการลดข้อมูล
มีการตั้งค่าอัลกอริธึมการลดข้อมูลสี่ประเภท:
top: ค่าจํานวนแรกจะถูกนํามาจากแบบจําลองความหมายbottom: ค่าจํานวนสุดท้ายจะถูกนํามาจากแบบจําลองความหมายsample: มีการรวมรายการแรกและสุดท้าย และ นับ จํานวนหน่วยข้อมูลที่มีช่วงที่เท่ากันระหว่างกัน ตัวอย่างเช่น ถ้าคุณมีแบบจําลองความหมาย [0, 1, 2, ... 100] และ count เป็น 9 คุณจะได้รับค่า [0, 10, 20 ... 100].window: โหลดหน้าต่างของจุดข้อมูลหนึ่งรายการในช่วงเวลาที่มีองค์ประกอบ count ในปัจจุบันtopและwindowเทียบเท่ากัน ในอนาคต การตั้งค่าหน้าต่างจะรองรับอย่างสมบูรณ์
ตามค่าเริ่มต้น วิชวล Power BI ทั้งหมดมีอัลกอริทึมการลดข้อมูลสูงสุดที่ใช้กับ count ซึ่งตั้งค่าเป็นจุดข้อมูล 1,000 จุด ค่าเริ่มต้นนี้จะเทียบเท่ากับการตั้งค่าคุณสมบัติต่อไปนี้ใน ไฟล์ capabilities.json :
"dataReductionAlgorithm": {
    "top": {
        "count": 1000
    }
}
คุณสามารถปรับเปลี่ยน ค่า count เป็นค่าจํานวนเต็มใดก็ตามได้สูงถึง 30000 วิชวล Power BI ที่ใช้ภาษา R สามารถรองรับได้ถึง 150000 แถว
การใช้งานอัลกอริทึมในการลดข้อมูล
อัลกอริธึมการลดมิติข้อมูลสามารถใช้ในการแมปมุมมองข้อมูลจัดกลุ่ม ตาราง หรือเมทริกซ์ได้
ในการแมปข้อมูลจัดกลุ่ม คุณสามารถเพิ่มอัลกอริทึมไปยังส่วน "ประเภท" และ/หรือ "กลุ่ม" ของ values สําหรับการแมปข้อมูลแบบจัดกลุ่มได้
"dataViewMappings": {
    "categorical": {
        "categories": {
            "for": { "in": "category" },
            "dataReductionAlgorithm": {
                "window": {
                    "count": 300
                }
            }
        },
        "values": {
            "group": {
                "by": "series",
                "select": [{
                        "for": {
                            "in": "measure"
                        }
                    }
                ],
                "dataReductionAlgorithm": {
                    "top": {
                        "count": 100
                    }
                }
            }
        }
    }
}
ในการแมปมุมมองข้อมูลแบบตาราง ใช้อัลกอริทึมการลดมิติข้อมูลกับ rows ส่วน ของตารางการแมปมุมมองข้อมูล
"dataViewMappings": [
    {
        "table": {
            "rows": {
                "for": {
                    "in": "values"
                },
                "dataReductionAlgorithm": {
                    "top": {
                        "count": 2000
                    }
                }
            }
        }
    }
]
คุณสามารถใช้อัลกอริธึมการลดมิติข้อมูลกับ rows ส่วน และ columns ของเมทริกซ์การแมปมุมมองข้อมูล
เนื้อหาที่เกี่ยวข้อง
คำติชม
เร็วๆ นี้: ตลอดปี 2024 เราจะขจัดปัญหา GitHub เพื่อเป็นกลไกคำติชมสำหรับเนื้อหา และแทนที่ด้วยระบบคำติชมใหม่ สำหรับข้อมูลเพิ่มเติม ให้ดู: https://aka.ms/ContentUserFeedback
ส่งและดูข้อคิดเห็นสำหรับ