使用 Office 脚本和 Power Automate 通过电子邮件发送图表和表格的图像
此示例使用 Office 脚本和 Power Automate 创建图表。 然后,它会通过电子邮件发送图表及其基表的图像。
示例方案
- 计算以获取最新结果。
- 创建图表。
- 获取图表和表格图像。
- 使用 Power Automate Email图像。
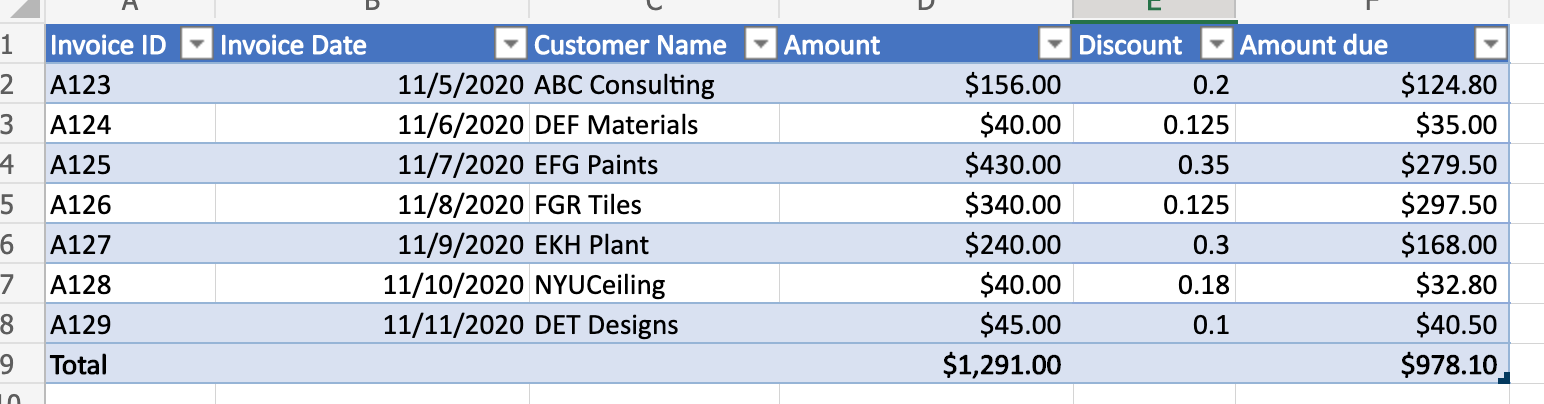
输入数据
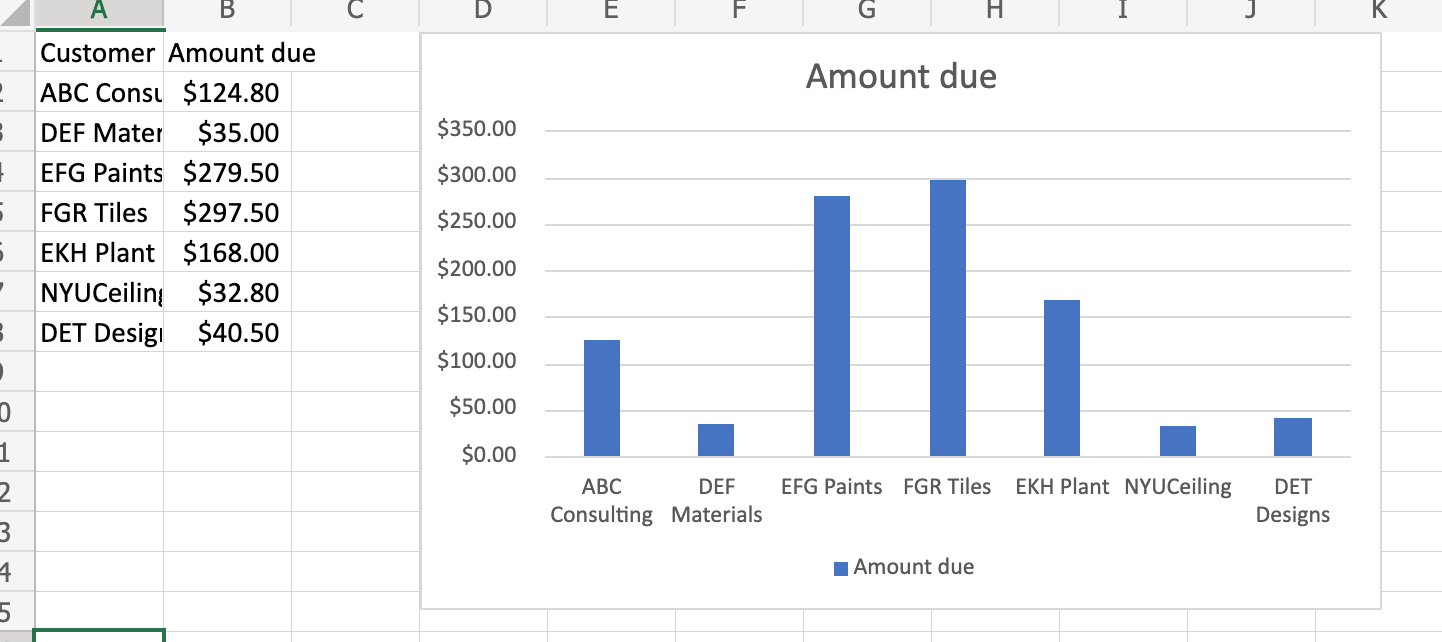
输出图表
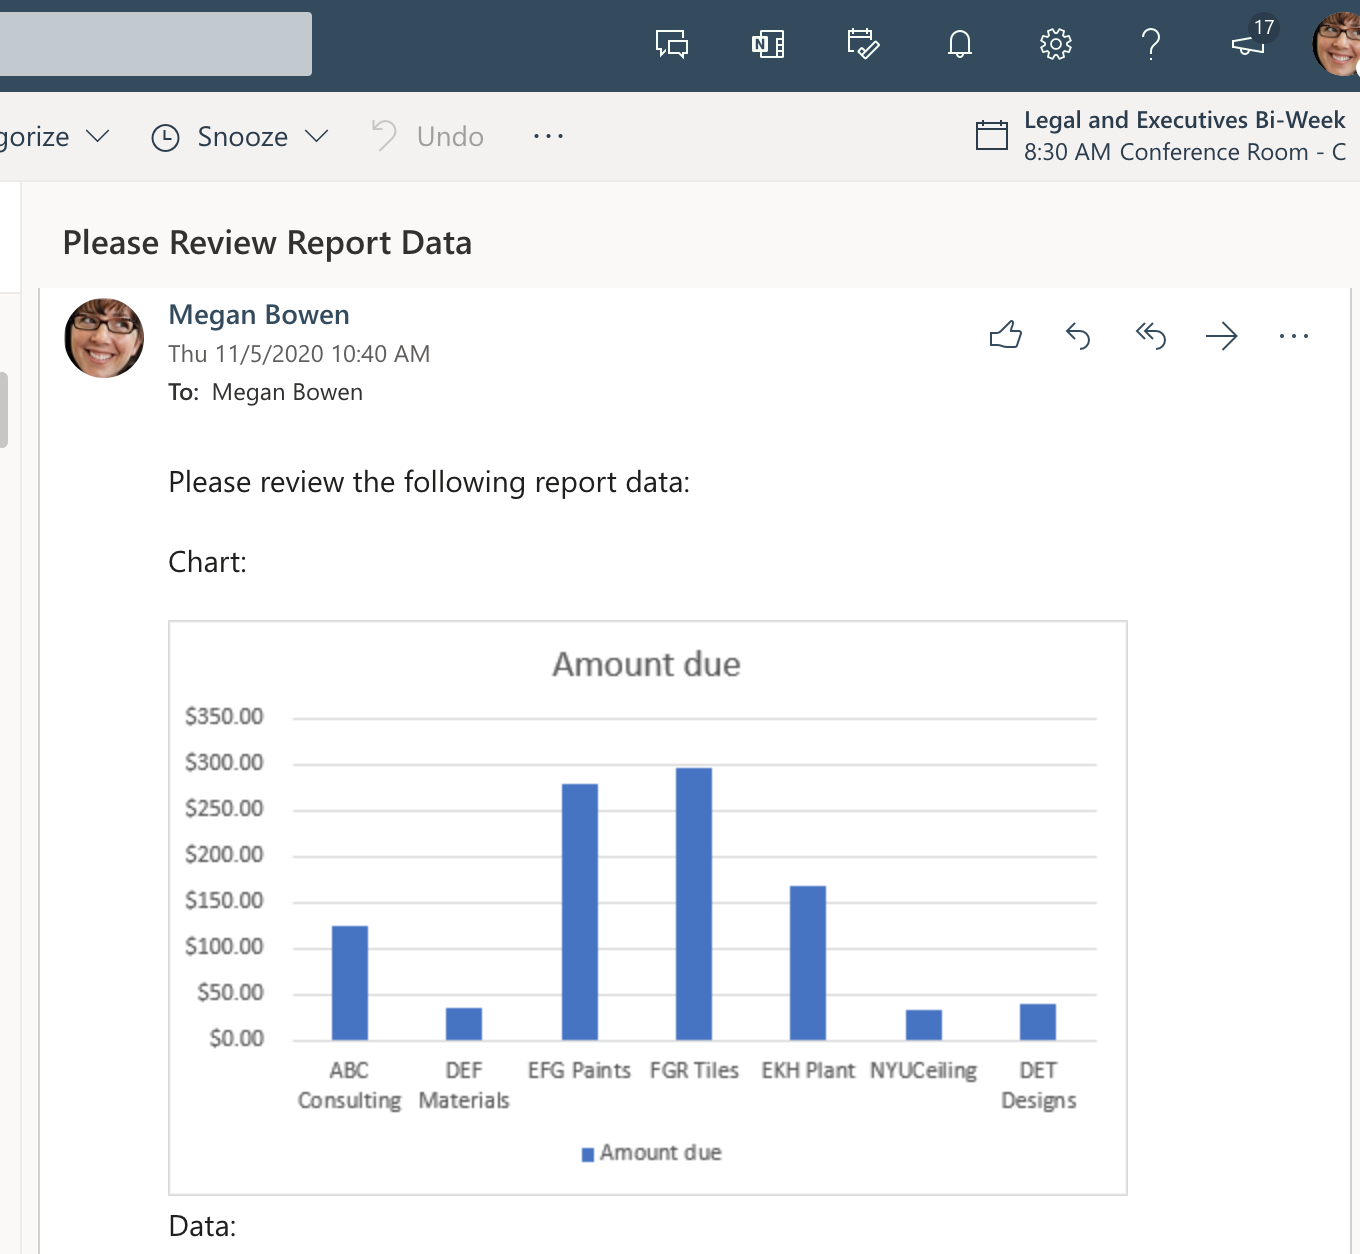
通过 Power Automate 流接收的Email
解决方案
此解决方案包含两个部分:
- 用于计算和提取 Excel 图表和表格的 Office 脚本
- 一个 Power Automate 流,用于调用脚本并通过电子邮件发送结果。 有关如何执行此操作的示例,请参阅 使用 Power Automate 创建自动化工作流。
设置:示例 Excel 文件
此工作簿包含脚本所需的数据、对象和格式设置。
示例代码:计算和提取 Excel 图表和表格
将以下脚本添加到示例工作簿。 在 Excel 中,使用 “自动化>新脚本” 粘贴代码并保存脚本。 将其保存为 “获取图表图像 ”,然后亲自尝试该示例!
function main(workbook: ExcelScript.Workbook): ReportImages {
  // Recalculate the workbook to ensure all tables and charts are updated.
  workbook.getApplication().calculate(ExcelScript.CalculationType.full);

  // Get the data from the "InvoiceAmounts" table.
  const sheet1 = workbook.getWorksheet("Sheet1");
  const table = workbook.getWorksheet('InvoiceAmounts').getTables()[0];
  const rows = table.getRange().getTexts();

  // Get only the "Customer Name" and "Amount due" columns, then remove the "Total" row.
  const selectColumns = rows.map((row) => {
    return [row[2], row[5]];
  });
  table.setShowTotals(true);
  selectColumns.splice(selectColumns.length - 1, 1);
  console.log(selectColumns);

  // Delete the "ChartSheet" worksheet if it's present, then recreate it.
  workbook.getWorksheet('ChartSheet')?.delete();
  const chartSheet = workbook.addWorksheet('ChartSheet');

  // Add the selected data to the new worksheet.
  const targetRange = chartSheet.getRange('A1').getResizedRange(selectColumns.length - 1, selectColumns[0].length - 1);
  targetRange.setValues(selectColumns);

  // Insert the chart on sheet 'ChartSheet' at cell "D1".
  const chart = chartSheet.addChart(ExcelScript.ChartType.columnClustered, targetRange);
  chart.setPosition('D1');

  // Get images of the chart and table, then return them for a Power Automate flow.
  const chartImage = chart.getImage();
  const tableImage = table.getRange().getImage();
  return { chartImage, tableImage };
}

// The interface for table and chart images.
interface ReportImages {
  chartImage: string
  tableImage: string
}
Power Automate 流:Email图表和表格图像
此流运行脚本并通过电子邮件发送返回的图像。
创建新的 即时云流。
选择 “手动触发流 ”,然后选择“ 创建”。
此示例需要 新的流设计器 中不支持的 Power Automate 功能, (向电子邮件) 添加 HTML。 使用屏幕右上角的切换开关切换到旧设计器。
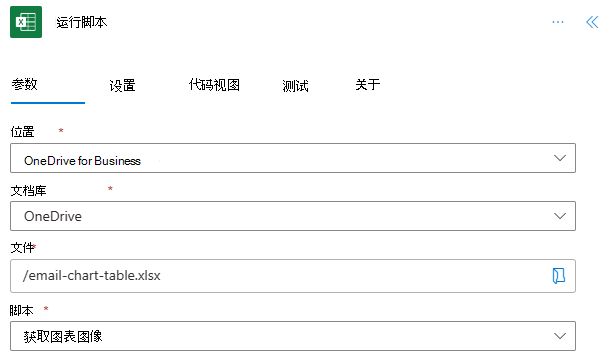
添加使用 Excel Online (Business) 连接器和“运行脚本”操作的新步骤。 对操作使用以下值。
- 位置:OneDrive for Business
- 文档库:OneDrive
- 文件:使用 文件选择器) 选择了 email-chart-table.xlsx (
- 脚本:获取图表图像
此示例使用 Outlook 作为电子邮件客户端。 可以使用 Power Automate 支持的任何电子邮件连接器,但其余步骤假定你选择了 Outlook。 添加使用 Office 365 Outlook 连接器和发送和电子邮件 (V2) 操作的新步骤。 对操作使用以下值。
- 目标:测试电子邮件帐户 (或个人电子邮件)
- 主题:请查看报表数据
- 对于“ 正文 ”字段,请选择“代码视图” (
</>) 并输入以下内容:
<p>Please review the following report data:<br>
<br>
Chart:<br>
<br>
<img src="data:image/png;base64,@{outputs('Run_script')?['body/result/chartImage']}"/>
<br>
Data:<br>
<br>
<img src="data:image/png;base64,@{outputs('Run_script')?['body/result/tableImage']}"/>
<br>
</p>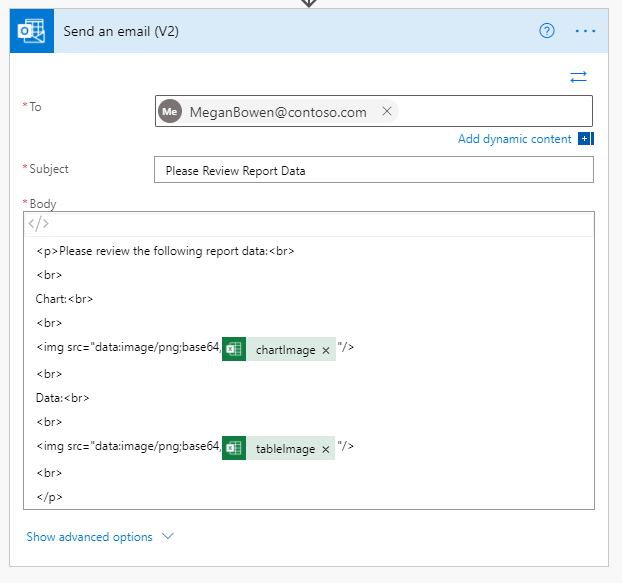
保存流并试用。使用流编辑器页上的“ 测试 ”按钮,或通过“我的流”选项卡运行 流 。请务必在出现提示时允许访问。
培训视频:提取图表和表格的图像并通过电子邮件发送图像
反馈
即将发布:在整个 2024 年,我们将逐步淘汰作为内容反馈机制的“GitHub 问题”,并将其取代为新的反馈系统。 有关详细信息,请参阅:https://aka.ms/ContentUserFeedback。
提交和查看相关反馈