Κατανόηση της αντιστοίχισης προβολής δεδομένων σε απεικονίσεις Power BI
Αυτό το άρθρο εξετάζει την αντιστοίχιση προβολής δεδομένων και περιγράφει τον τρόπο με τον οποίο οι ρόλοι δεδομένων χρησιμοποιούνται για τη δημιουργία διαφορετικών τύπων απεικονίσεων. Εξηγεί πώς μπορείτε να καθορίσετε απαιτήσεις υπό όρους για ρόλους δεδομένων και τους διαφορετικούς dataMappings τύπους.
Κάθε έγκυρη αντιστοίχιση παράγει μια προβολή δεδομένων. Μπορείτε να παρέχετε πολλές αντιστοιχίσεις δεδομένων υπό ορισμένες συνθήκες. Οι υποστηριζόμενες επιλογές αντιστοίχισης είναι οι εξής:
"dataViewMappings": [
    {
        "conditions": [ ... ],
        "categorical": { ... },
        "single": { ... },
        "table": { ... },
        "matrix": { ... }
    }
]
Το Power BI δημιουργεί μια αντιστοίχιση σε μια προβολή δεδομένων μόνο εάν η έγκυρη αντιστοίχιση έχει οριστεί επίσης στο dataViewMappings.
Με άλλα λόγια, μπορεί να έχει οριστεί σεdataViewMappings, categorical αλλά άλλες αντιστοιχίσεις, όπως table ή single, μπορεί να μην έχουν οριστεί. Σε αυτή την περίπτωση, το Power BI παράγει μια προβολή δεδομένων με μία μόνο categorical αντιστοίχιση, ενώ table άλλες αντιστοιχίσεις παραμένουν μη καθορισμένες. Για παράδειγμα:
"dataViewMappings": [
    {
    "categorical": {
        "categories": [ ... ],
        "values": [ ... ]
    },
    "metadata": { ... }
    }
]
Προϋποθέσεις
Η conditions ενότητα καθορίζει κανόνες για μια συγκεκριμένη αντιστοίχιση δεδομένων. Εάν τα δεδομένα αντιστοιχούν σε ένα από τα σύνολα συνθηκών που περιγράφονται, η απεικόνιση αποδέχεται τα δεδομένα ως έγκυρα.
Για κάθε πεδίο, μπορείτε να καθορίσετε μια ελάχιστη και μέγιστη τιμή. Η τιμή αντιπροσωπεύει τον αριθμό των πεδίων που μπορούν να συνδεθούν με αυτόν τον ρόλο δεδομένων.
Σημείωμα
Εάν παραλειφθεί ένας ρόλος δεδομένων στη συνθήκη, μπορεί να έχει οποιονδήποτε αριθμό πεδίων.
Στο παρακάτω παράδειγμα, το category περιορίζεται σε ένα πεδίο δεδομένων και το measure περιορίζεται σε δύο πεδία δεδομένων.
"conditions": [
    { "category": { "max": 1 }, "measure": { "max": 2 } },
]
Μπορείτε επίσης να ορίσετε πολλές συνθήκες για έναν ρόλο δεδομένων. Σε αυτή την περίπτωση, τα δεδομένα είναι έγκυρα εάν ικανοποιείται οποιαδήποτε από τις συνθήκες.
"conditions": [
    { "category": { "min": 1, "max": 1 }, "measure": { "min": 2, "max": 2 } },
    { "category": { "min": 2, "max": 2 }, "measure": { "min": 1, "max": 1 } }
]
Στο προηγούμενο παράδειγμα, απαιτείται μία από τις παρακάτω δύο συνθήκες:
- Ακριβώς ένα πεδίο κατηγορίας και ακριβώς δύο μετρήσεις
- Ακριβώς δύο κατηγορίες και ακριβώς μία μέτρηση
Μεμονωμένη αντιστοίχιση δεδομένων
Η μεμονωμένη αντιστοίχιση δεδομένων είναι η απλούστερη μορφή αντιστοίχισης δεδομένων. Αποδέχεται ένα πεδίο μεμονωμένης μέτρησης και επιστρέφει το σύνολο. Εάν το πεδίο είναι αριθμητικό, επιστρέφει το άθροισμα. Διαφορετικά, επιστρέφει το πλήθος των μοναδικών τιμών.
Για να χρησιμοποιήσετε μια μεμονωμένη αντιστοίχιση δεδομένων, καθορίστε το όνομα του ρόλου δεδομένων που θέλετε να αντιστοιχίστε. Αυτή η αντιστοίχιση λειτουργεί μόνο με ένα πεδίο μεμονωμένης μέτρησης. Εάν αντιστοιχιστεί ένα δεύτερο πεδίο, δεν δημιουργείται προβολή δεδομένων, επομένως είναι καλή πρακτική να συμπεριλάβετε μια συνθήκη που περιορίζει τα δεδομένα σε ένα μοναδικό πεδίο.
Σημείωμα
Αυτή η αντιστοίχιση δεδομένων δεν μπορεί να χρησιμοποιηθεί σε συνδυασμό με οποιαδήποτε άλλη αντιστοίχιση δεδομένων. Προορίζεται για να μειώσει τα δεδομένα σε μία μόνο αριθμητική τιμή.
Για παράδειγμα:
{
    "dataRoles": [
        {
            "displayName": "Y",
            "name": "Y",
            "kind": "Measure"
        }
    ],
    "dataViewMappings": [
        {
            "conditions": [
                {
                    "Y": {
                        "max": 1
                    }
                }
            ],
            "single": {
                "role": "Y"
            }
        }
    ]
}
Η προβολή δεδομένων που προκύπτει μπορεί ακόμα να περιέχει άλλους τύπους αντιστοίχισης, όπως πίνακα ή κατηγορικό, αλλά κάθε αντιστοίχιση περιέχει μόνο τη μοναδική τιμή. Η βέλτιστη πρακτική είναι να αποκτήσετε πρόσβαση στην τιμή μόνο σε μεμονωμένη αντιστοίχιση.
{
    "dataView": [
        {
            "metadata": null,
            "categorical": null,
            "matrix": null,
            "table": null,
            "tree": null,
            "single": {
                "value": 94163140.3560001
            }
        }
    ]
}
Το ακόλουθο δείγμα κώδικα επεξεργάζεται απλή αντιστοίχιση προβολών δεδομένων:
"use strict";
import powerbi from "powerbi-visuals-api";
import DataView = powerbi.DataView;
import DataViewSingle = powerbi.DataViewSingle;
// standard imports
// ...

export class Visual implements IVisual {
    private target: HTMLElement;
    private host: IVisualHost;
    private valueText: HTMLParagraphElement;

    constructor(options: VisualConstructorOptions) {
        // constructor body
        this.target = options.element;
        this.host = options.host;
        this.valueText = document.createElement("p");
        this.target.appendChild(this.valueText);
        // ...
    }

    public update(options: VisualUpdateOptions) {
        const dataView: DataView = options.dataViews[0];
        const singleDataView: DataViewSingle = dataView.single;

        if (!singleDataView ||
            !singleDataView.value ) {
            return
        }

        this.valueText.innerText = singleDataView.value.toString();
    }
}
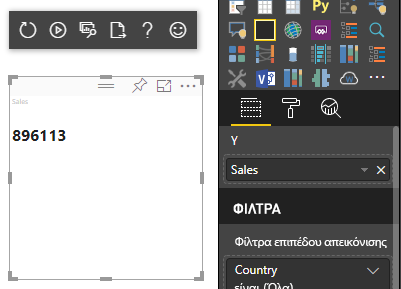
Το προηγούμενο δείγμα κώδικα έχει ως αποτέλεσμα την εμφάνιση μιας μοναδικής τιμής από το Power BI:
Αντιστοίχιση κατηγορικών δεδομένων
Η αντιστοίχιση κατηγορικών δεδομένων χρησιμοποιείται για τη λήψη ανεξάρτητων ομαδοποιήσεων ή κατηγοριών δεδομένων. Οι κατηγορίες μπορούν επίσης να ομαδοποιηθούν χρησιμοποιώντας την επιλογή "ομαδοποίηση κατά" στην αντιστοίχιση δεδομένων.
Βασική αντιστοίχιση κατηγορικών δεδομένων
Εξετάστε τους ακόλουθους ρόλους δεδομένων και αντιστοιχίσεις:
"dataRoles":[
    {
        "displayName": "Category",
        "name": "category",
        "kind": "Grouping"
    },
    {
        "displayName": "Y Axis",
        "name": "measure",
        "kind": "Measure"
    }
],
"dataViewMappings": {
    "categorical": {
        "categories": {
            "for": { "in": "category" }
        },
        "values": {
            "select": [
                { "bind": { "to": "measure" } }
            ]
        }
    }
}
Το προηγούμενο παράδειγμα αναφέρει "Να γίνει αντιστοίχιση του ρόλου δεδομένων μουcategory, έτσι ώστε για κάθε πεδίο που μεταβάλω στο , τα δεδομένα του να αντιστοιχίζονται σε categorycategorical.categories. Επίσης, αντιστοιχίστε τον ρόλο δεδομένων μου measure σε categorical.values."
- Για... in: Περιλαμβάνει όλα τα στοιχεία σε αυτόν τον ρόλο δεδομένων στο ερώτημα δεδομένων.
- Δεσμεύουν... σε: Παράγει το ίδιο αποτέλεσμα με το... στην αλλά αναμένει ο ρόλος δεδομένων να έχει μια συνθήκη που τον περιορίζει σε ένα μοναδικό πεδίο.
Κατηγορικά δεδομένα ομάδας
Το επόμενο παράδειγμα χρησιμοποιεί τους ίδιους δύο ρόλους δεδομένων με το προηγούμενο παράδειγμα και προσθέτει δύο ακόμα ρόλους δεδομένων με το όνομα grouping και measure2.
"dataRole":[
    {
        "displayName": "Category",
        "name": "category",
        "kind": "Grouping"
    },
    {
        "displayName": "Y Axis",
        "name": "measure",
        "kind": "Measure"
    },
    {
        "displayName": "Grouping with",
        "name": "grouping",
        "kind": "Grouping"
    },
    {
        "displayName": "X Axis",
        "name": "measure2",
        "kind": "Grouping"
    }
],
"dataViewMappings":{
    "categorical": {
        "categories": {
            "for": { "in": "category" }
        },
        "values": {
            "group": {
                "by": "grouping",
                "select":[
                    { "bind": { "to": "measure" } },
                    { "bind": { "to": "measure2" } }
                ]
            }
        }
    }
}
Η διαφορά μεταξύ αυτής της αντιστοίχισης και της βασικής αντιστοίχισης είναι ο τρόπος categorical.values αντιστοίχισης. Όταν αντιστοιχίζετε measure τους ρόλους δεδομένων και measure2 στον ρόλο groupingδεδομένων , ο άξονας x και ο άξονας y μπορούν να κλιμακωθούν κατάλληλα.
Ομαδοποίηση ιεραρχικών δεδομένων
Στο επόμενο παράδειγμα, τα κατηγορικά δεδομένα χρησιμοποιούνται για τη δημιουργία μιας ιεραρχίας, η οποία μπορεί να χρησιμοποιηθεί για την υποστήριξη ενεργειών διερεύνησης .
Το παρακάτω παράδειγμα εμφανίζει τους ρόλους και τις αντιστοιχίσεις δεδομένων:
"dataRoles": [
    {
        "displayName": "Categories",
        "name": "category",
        "kind": "Grouping"
    },
    {
        "displayName": "Measures",
        "name": "measure",
        "kind": "Measure"
    },
    {
        "displayName": "Series",
        "name": "series",
        "kind": "Measure"
    }
],
"dataViewMappings": [
    {
        "categorical": {
            "categories": {
                "for": {
                    "in": "category"
                }
            },
            "values": {
                "group": {
                    "by": "series",
                    "select": [{
                            "for": {
                                "in": "measure"
                            }
                        }
                    ]
                }
            }
        }
    }
]
Εξετάστε τα παρακάτω κατηγορικά δεδομένα:
| Χώρα/Περιοχή | 2013 | 2014 | 2015 | 2016 |
|---|---|---|---|---|
| ΗΠΑ | x | x | 650 | 350 |
| Καναδάς | x | 630 | 490 | x |
| Μεξικό | 645 | x | x | x |
| Ηνωμένο Βασίλειο | x | x | 831 | x |
Το Power BI παράγει μια προβολή κατηγορικών δεδομένων με το ακόλουθο σύνολο κατηγοριών.
{
    "categorical": {
        "categories": [
            {
                "source": {...},
                "values": [
                    "Canada",
                    "USA",
                    "UK",
                    "Mexico"
                ],
                "identity": [...],
                "identityFields": [...],
            }
        ]
    }
}
Κάθε category αντιστοιχίζεται σε ένα σύνολο .values Κάθε ένα από αυτά values ομαδοποιείται κατά series, το οποίο εκφράζεται σε έτη.
Για παράδειγμα, κάθε values πίνακας αντιπροσωπεύει ένα έτος.
Επίσης, κάθε values πίνακας έχει τέσσερις τιμές: Καναδάς, ΗΠΑ, Ηνωμένο Βασίλειο και Μεξικό.
{
    "values": [
        // Values for year 2013
        {
            "source": {...},
            "values": [
                null, // Value for `Canada` category
                null, // Value for `USA` category
                null, // Value for `UK` category
                645 // Value for `Mexico` category
            ],
            "identity": [...],
        },
        // Values for year 2014
        {
            "source": {...},
            "values": [
                630, // Value for `Canada` category
                null, // Value for `USA` category
                null, // Value for `UK` category
                null // Value for `Mexico` category
            ],
            "identity": [...],
        },
        // Values for year 2015
        {
            "source": {...},
            "values": [
                490, // Value for `Canada` category
                650, // Value for `USA` category
                831, // Value for `UK` category
                null // Value for `Mexico` category
            ],
            "identity": [...],
        },
        // Values for year 2016
        {
            "source": {...},
            "values": [
                null, // Value for `Canada` category
                350, // Value for `USA` category
                null, // Value for `UK` category
                null // Value for `Mexico` category
            ],
            "identity": [...],
        }
    ]
}
Το ακόλουθο δείγμα κώδικα αφορά την επεξεργασία αντιστοίχισης προβολής κατηγορικών δεδομένων. Αυτό το δείγμα δημιουργεί την ιεραρχική δομή Χώρα/Τιμή έτους περιοχής >>.
"use strict";
import powerbi from "powerbi-visuals-api";
import DataView = powerbi.DataView;
import DataViewCategorical = powerbi.DataViewCategorical;
import DataViewValueColumnGroup = powerbi.DataViewValueColumnGroup;
import PrimitiveValue = powerbi.PrimitiveValue;
// standard imports
// ...

export class Visual implements IVisual {
    private target: HTMLElement;
    private host: IVisualHost;
    private categories: HTMLElement;

    constructor(options: VisualConstructorOptions) {
        // constructor body
        this.target = options.element;
        this.host = options.host;
        this.categories = document.createElement("pre");
        this.target.appendChild(this.categories);
        // ...
    }

    public update(options: VisualUpdateOptions) {
        const dataView: DataView = options.dataViews[0];
        const categoricalDataView: DataViewCategorical = dataView.categorical;

        if (!categoricalDataView ||
            !categoricalDataView.categories ||
            !categoricalDataView.categories[0] ||
            !categoricalDataView.values) {
            return;
        }

        // Categories have only one column in data buckets
        // To support several columns of categories data bucket, iterate categoricalDataView.categories array.
        const categoryFieldIndex = 0;
        // Measure has only one column in data buckets.
        // To support several columns on data bucket, iterate years.values array in map function
        const measureFieldIndex = 0;
        let categories: PrimitiveValue[] = categoricalDataView.categories[categoryFieldIndex].values;
        let values: DataViewValueColumnGroup[] = categoricalDataView.values.grouped();

        let data = {};
        // iterate categories/countries-regions
        categories.map((category: PrimitiveValue, categoryIndex: number) => {
            data[category.toString()] = {};
            // iterate series/years
            values.map((years: DataViewValueColumnGroup) => {
                if (!data[category.toString()][years.name] && years.values[measureFieldIndex].values[categoryIndex]) {
                    data[category.toString()][years.name] = []
                }
                if (years.values[0].values[categoryIndex]) {
                    data[category.toString()][years.name].push(years.values[measureFieldIndex].values[categoryIndex]);
                }
            });
        });

        this.categories.innerText = JSON.stringify(data, null, 6);
        console.log(data);
    }
}
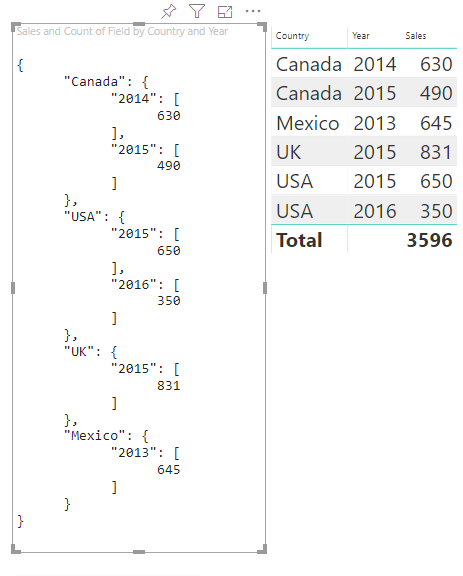
Αυτή είναι η απεικόνιση που προκύπτει:
Αντιστοίχιση πινάκων
Η προβολή δεδομένων πίνακα είναι ουσιαστικά μια λίστα σημείων δεδομένων όπου μπορούν να συγκεντρωθούν αριθμητικά σημεία δεδομένων.
Για παράδειγμα, χρησιμοποιήστε τα ίδια δεδομένα στην προηγούμενη ενότητα, αλλά με τις ακόλουθες δυνατότητες:
"dataRoles": [
    {
        "displayName": "Column",
        "name": "column",
        "kind": "Grouping"
    },
    {
        "displayName": "Value",
        "name": "value",
        "kind": "Measure"
    }
],
"dataViewMappings": [
    {
        "table": {
            "rows": {
                "select": [
                    {
                        "for": {
                            "in": "column"
                        }
                    },
                    {
                        "for": {
                            "in": "value"
                        }
                    }
                ]
            }
        }
    }
]
Απεικονίστε την προβολή δεδομένων πίνακα όπως αυτό το παράδειγμα:
| Χώρα/Περιοχή | Year | Πωλήσεις |
|---|---|---|
| ΗΠΑ | 2016 | 100 |
| ΗΠΑ | 2015 | 50 |
| Καναδάς | 2015 | 200 |
| Καναδάς | 2015 | 50 |
| Μεξικό | 2013 | 300 |
| Ηνωμένο Βασίλειο | 2014 | 150 |
| ΗΠΑ | 2015 | 75 |
Σύνδεση δεδομένων:
Το Power BI εμφανίζει τα δεδομένα σας ως προβολή δεδομένων πίνακα. Μην υποθέσετε ότι τα δεδομένα είναι ταξινομημένα.
{
    "table" : {
        "columns": [...],
        "rows": [
            [
                "Canada",
                2014,
                630
            ],
            [
                "Canada",
                2015,
                490
            ],
            [
                "Mexico",
                2013,
                645
            ],
            [
                "UK",
                2014,
                831
            ],
            [
                "USA",
                2015,
                650
            ],
            [
                "USA",
                2016,
                350
            ]
        ]
    }
}
Για να συγκεντρώσετε τα δεδομένα, επιλέξτε το επιθυμητό πεδίο και, στη συνέχεια, επιλέξτε Άθροισμα.

Δείγμα κώδικα για την επεξεργασία της αντιστοίχισης προβολής δεδομένων πίνακα.
"use strict";
import "./../style/visual.less";
import powerbi from "powerbi-visuals-api";
// ...
import DataViewMetadataColumn = powerbi.DataViewMetadataColumn;
import DataViewTable = powerbi.DataViewTable;
import DataViewTableRow = powerbi.DataViewTableRow;
import PrimitiveValue = powerbi.PrimitiveValue;
// standard imports
// ...

export class Visual implements IVisual {
    private target: HTMLElement;
    private host: IVisualHost;
    private table: HTMLParagraphElement;

    constructor(options: VisualConstructorOptions) {
        // constructor body
        this.target = options.element;
        this.host = options.host;
        this.table = document.createElement("table");
        this.target.appendChild(this.table);
        // ...
    }

    public update(options: VisualUpdateOptions) {
        const dataView: DataView = options.dataViews[0];
        const tableDataView: DataViewTable = dataView.table;

        if (!tableDataView) {
            return
        }
        while(this.table.firstChild) {
            this.table.removeChild(this.table.firstChild);
        }

        //draw header
        const tableHeader = document.createElement("th");
        tableDataView.columns.forEach((column: DataViewMetadataColumn) => {
            const tableHeaderColumn = document.createElement("td");
            tableHeaderColumn.innerText = column.displayName
            tableHeader.appendChild(tableHeaderColumn);
        });
        this.table.appendChild(tableHeader);

        //draw rows
        tableDataView.rows.forEach((row: DataViewTableRow) => {
            const tableRow = document.createElement("tr");
            row.forEach((columnValue: PrimitiveValue) => {
                const cell = document.createElement("td");
                cell.innerText = columnValue.toString();
                tableRow.appendChild(cell);
            })
            this.table.appendChild(tableRow);
        });
    }
}
Το αρχείο style/visual.less στυλ απεικόνισης περιέχει τη διάταξη για τον πίνακα:
table {
    display: flex;
    flex-direction: column;
}

tr, th {
    display: flex;
    flex: 1;
}

td {
    flex: 1;
    border: 1px solid black;
}
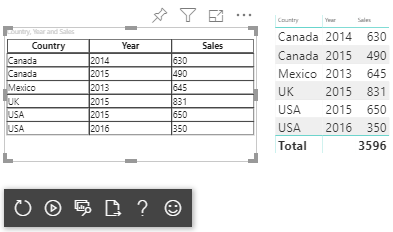
Η απεικόνιση που προκύπτει μοιάζει κάπως έτσι:
Αντιστοίχιση δεδομένων μήτρας
Η αντιστοίχιση δεδομένων μήτρας είναι παρόμοια με την αντιστοίχιση δεδομένων πίνακα, αλλά οι γραμμές παρουσιάζονται με ιεραρχική σειρά. Οποιαδήποτε από τις τιμές ρόλου δεδομένων μπορεί να χρησιμοποιηθεί ως τιμή κεφαλίδας στήλης.
{
    "dataRoles": [
        {
            "name": "Category",
            "displayName": "Category",
            "displayNameKey": "Visual_Category",
            "kind": "Grouping"
        },
        {
            "name": "Column",
            "displayName": "Column",
            "displayNameKey": "Visual_Column",
            "kind": "Grouping"
        },
        {
            "name": "Measure",
            "displayName": "Measure",
            "displayNameKey": "Visual_Values",
            "kind": "Measure"
        }
    ],
    "dataViewMappings": [
        {
            "matrix": {
                "rows": {
                    "for": {
                        "in": "Category"
                    }
                },
                "columns": {
                    "for": {
                        "in": "Column"
                    }
                },
                "values": {
                    "select": [
                        {
                            "for": {
                                "in": "Measure"
                            }
                        }
                    ]
                }
            }
        }
    ]
}
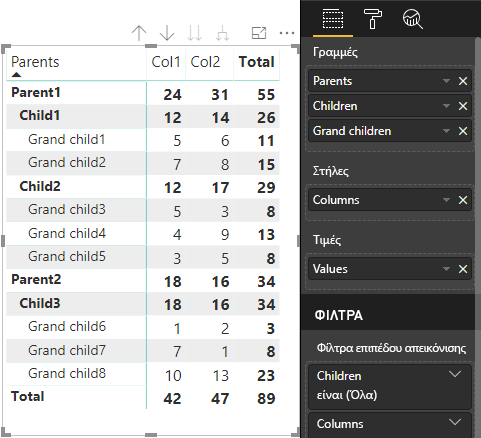
Ιεραρχική δομή δεδομένων μήτρας
Το Power BI δημιουργεί μια ιεραρχική δομή δεδομένων. Η ρίζα της ιεραρχίας δέντρου περιλαμβάνει τα δεδομένα από τη στήλη Γονικά στοιχεία του Category ρόλου δεδομένων με θυγατρικά στοιχεία από τη στήλη Θυγατρικά στοιχεία του πίνακα ρόλου δεδομένων.
Μοντέλο σημασιολογίας:
| Γονείς | Θυγατρικά στοιχεία | Εγγόνια | Στήλες | Τιμές |
|---|---|---|---|---|
| Parent1 | Child1 | Grand child1 | Στ1 | 5 |
| Parent1 | Child1 | Grand child1 | Στήλη2 | 6 |
| Parent1 | Child1 | Grand child2 | Στ1 | 7 |
| Parent1 | Child1 | Grand child2 | Στήλη2 | 8 |
| Parent1 | Child2 | Grand child3 | Στ1 | 5 |
| Parent1 | Child2 | Grand child3 | Στήλη2 | 3 |
| Parent1 | Child2 | Grand child4 | Στ1 | 4 |
| Parent1 | Child2 | Grand child4 | Στήλη2 | 9 |
| Parent1 | Child2 | Grand child5 | Στ1 | 3 |
| Parent1 | Child2 | Grand child5 | Στήλη2 | 5 |
| Parent2 | Child3 | Grand child6 | Στ1 | 1 |
| Parent2 | Child3 | Grand child6 | Στήλη2 | 2 |
| Parent2 | Child3 | Grand child7 | Στ1 | 7 |
| Parent2 | Child3 | Grand child7 | Στήλη2 | 1 |
| Parent2 | Child3 | Grand child8 | Στ1 | 10 |
| Parent2 | Child3 | Grand child8 | Στήλη2 | 13 |
Η απεικόνιση μήτρας πυρήνα του Power BI αποδίδει τα δεδομένα ως πίνακα.
Η απεικόνιση λαμβάνει τη δομή δεδομένων της όπως περιγράφεται στον παρακάτω κώδικα (μόνο οι δύο πρώτες γραμμές πίνακα εμφανίζονται εδώ):
{
    "metadata": {...},
    "matrix": {
        "rows": {
            "levels": [...],
            "root": {
                "childIdentityFields": [...],
                "children": [
                    {
                        "level": 0,
                        "levelValues": [...],
                        "value": "Parent1",
                        "identity": {...},
                        "childIdentityFields": [...],
                        "children": [
                            {
                                "level": 1,
                                "levelValues": [...],
                                "value": "Child1",
                                "identity": {...},
                                "childIdentityFields": [...],
                                "children": [
                                    {
                                        "level": 2,
                                        "levelValues": [...],
                                        "value": "Grand child1",
                                        "identity": {...},
                                        "values": {
                                            "0": {
                                                "value": 5 // value for Col1
                                            },
                                            "1": {
                                                "value": 6 // value for Col2
                                            }
                                        }
                                    },
                                    ...
                                ]
                            },
                            ...
                        ]
                    },
                    ...
                ]
            }
        },
        "columns": {
            "levels": [...],
            "root": {
                "childIdentityFields": [...],
                "children": [
                    {
                        "level": 0,
                        "levelValues": [...],
                        "value": "Col1",
                        "identity": {...}
                    },
                    {
                        "level": 0,
                        "levelValues": [...],
                        "value": "Col2",
                        "identity": {...}
                    },
                    ...
                ]
            }
        },
        "valueSources": [...]
    }
}
Ανάπτυξη και σύμπτυξη κεφαλίδων γραμμών
Για το API 4.1.0 ή νεότερη έκδοση, τα δεδομένα μήτρας υποστηρίζουν ανάπτυξη και σύμπτυξη κεφαλίδων γραμμών. Από το API 4.2 μπορείτε να αναπτύξετε/συμπτύξετε ολόκληρο το επίπεδο μέσω προγραμματισμού. Η δυνατότητα ανάπτυξης και σύμπτυξης βελτιστοποιεί τη λήψη δεδομένων στην dataView, επιτρέποντας στον χρήστη να αναπτύξει ή να συμπτύξετε μια γραμμή χωρίς να λάβει όλα τα δεδομένα για το επόμενο επίπεδο. Λαμβάνει μόνο τα δεδομένα για την επιλεγμένη γραμμή. Η κατάσταση επέκτασης της κεφαλίδας γραμμής παραμένει συνεπής μεταξύ των σελιδοδεικτών και ακόμη και σε όλες τις αποθηκευμένες αναφορές. Δεν αφορά συγκεκριμένα κάθε απεικόνιση.
Οι εντολές ανάπτυξης και σύμπτυξης μπορούν να προστεθούν στο μενού περιβάλλοντος παρέχοντας την dataRoles παράμετρο στη showContextMenu μέθοδο .

Για να αναπτύξετε έναν μεγάλο αριθμό σημείων δεδομένων, χρησιμοποιήστε το API ανάκτησης περισσότερων δεδομένων με το API ανάπτυξης/σύμπτυξης.
Δυνατότητες API
Τα ακόλουθα στοιχεία έχουν προστεθεί στην έκδοση API 4.1.0 για την ενεργοποίηση της ανάπτυξης και σύμπτυξης των κεφαλίδων γραμμών:
Η
isCollapsedσημαία στοDataViewTreeNode:interface DataViewTreeNode { //... /** * TRUE if the node is Collapsed * FALSE if it is Expanded * Undefined if it cannot be Expanded (e.g. subtotal) */ isCollapsed?: boolean; }Η
toggleExpandCollapseμέθοδος στηISelectionMangerδιασύνδεση:interface ISelectionManager { //... showContextMenu(selectionId: ISelectionId, position: IPoint, dataRoles?: string): IPromise<{}>; // dataRoles is the name of the role of the selected data point toggleExpandCollapse(selectionId: ISelectionId, entireLevel?: boolean): IPromise<{}>; // Expand/Collapse an entire level will be available from API 4.2.0 //... }Η
canBeExpandedσημαία στο DataViewHierarchyLevel:interface DataViewHierarchyLevel { //... /** If TRUE, this level can be expanded/collapsed */ canBeExpanded?: boolean; }
Απαιτήσεις απεικόνισης
Για να ενεργοποιήσετε τη δυνατότητα σύμπτυξης ανάπτυξης σε μια απεικόνιση χρησιμοποιώντας την προβολή δεδομένων μήτρας:
Προσθέστε τον παρακάτω κώδικα στο αρχείο capabilities.json:
   "expandCollapse": {
    "roles": ["Rows"], //”Rows” is the name of rows data role
    "addDataViewFlags": {
        "defaultValue": true //indicates if the DataViewTreeNode will get the isCollapsed flag by default
    }
},
Επιβεβαιώστε ότι οι ρόλοι έχουν δυνατότητα διερεύνησης:
    "drilldown": {
    "roles": ["Rows"]
},
Για κάθε κόμβο, δημιουργήστε μια παρουσία της δόμησης επιλογών καλώντας τη
withMatrixNodeμέθοδο στο επίπεδο ιεραρχίας του επιλεγμένου κόμβου και δημιουργώντας έναselectionId. Για παράδειγμα:let nodeSelectionBuilder: ISelectionIdBuilder = visualHost.createSelectionIdBuilder(); // parantNodes is a list of the parents of the selected node. // node is the current node which the selectionId is created for. parentNodes.push(node); for (let i = 0; i < parentNodes.length; i++) { nodeSelectionBuilder = nodeSelectionBuilder.withMatrixNode(parentNodes[i], levels); } const nodeSelectionId: ISelectionId = nodeSelectionBuilder.createSelectionId();Δημιουργήστε μια παρουσία της διαχείρισης επιλογών και χρησιμοποιήστε τη
selectionManager.toggleExpandCollapse()μέθοδο , με την παράμετρο τουselectionId, που δημιουργήσατε για τον επιλεγμένο κόμβο. Για παράδειγμα:// handle click events to apply expand\collapse action for the selected node button.addEventListener("click", () => { this.selectionManager.toggleExpandCollapse(nodeSelectionId); });
Σημείωμα
- Εάν ο επιλεγμένος κόμβος δεν είναι κόμβος γραμμής, το PowerBI θα παραβλέψει τις κλήσεις ανάπτυξης και σύμπτυξης και οι εντολές ανάπτυξης και σύμπτυξης θα καταργηθούν από το μενού περιβάλλοντος.
- Η
dataRolesπαράμετρος απαιτείται για τηshowContextMenuμέθοδο μόνο εάν η απεικόνιση υποστηρίζει ήexpandCollapseδυνατότητεςdrilldown. Εάν η απεικόνιση υποστηρίζει αυτές τις δυνατότητες, αλλά δεν δόθηκαν οι dataRoles, θα παρουσιαστεί σφάλμα στην κονσόλα κατά τη χρήση της απεικόνισης προγραμματιστή ή κατά τον εντοπισμό σφαλμάτων σε μια δημόσια απεικόνιση με ενεργοποιημένη τη λειτουργία εντοπισμού σφαλμάτων.
Ζητήματα προς εξέταση και περιορισμοί
- Αφού αναπτύξετε έναν κόμβο, θα εφαρμοστούν νέα όρια δεδομένων στην DataView. Η νέα DataView ενδέχεται να μην περιλαμβάνει ορισμένους από τους κόμβους που παρουσιάζονται στην προηγούμενη DataView.
- Κατά τη χρήση ανάπτυξης ή σύμπτυξης, προστίθενται σύνολα ακόμη και αν η απεικόνιση δεν τα ζήτησε.
- Δεν υποστηρίζεται ανάπτυξη και σύμπτυξη στηλών.
Διατήρηση όλων των στηλών μετα-δεδομένων
Για το API 5.1.0 ή νεότερη έκδοση, υποστηρίζεται η διατήρηση όλων των στηλών μετα-δεδομένων. Αυτή η δυνατότητα επιτρέπει στην απεικόνιση να λαμβάνει μετα-δεδομένα για όλες τις στήλες, ανεξάρτητα από το ποιες είναι οι ενεργές προβλέψεις τους.
Προσθέστε τις ακόλουθες γραμμές στο αρχείο capabilities.json:
"keepAllMetadataColumns": {
    "type": "boolean",
    "description": "Indicates that visual is going to receive all metadata columns, no matter what the active projections are"
}
Ο ορισμός αυτής της ιδιότητας σε true θα έχει ως αποτέλεσμα τη λήψη όλων των μετα-δεδομένων, συμπεριλαμβανομένων των στηλών σε σύμπτυξη. false Η ρύθμιση του σε ή το να μην έχει ορίζεται θα έχει ως αποτέλεσμα τη λήψη μετα-δεδομένων μόνο σε στήλες με ενεργές προβλέψεις (για παράδειγμα, ανεπτυγμένες).
Αλγόριθμος μείωσης δεδομένων
Ο αλγόριθμος μείωσης δεδομένων ελέγχει ποια δεδομένα και πόσα δεδομένα λαμβάνονται στην προβολή δεδομένων.
Το πλήθος ορίζεται στον μέγιστο αριθμό τιμών που μπορεί να δεχτεί η προβολή δεδομένων. Εάν υπάρχουν περισσότερες από τιμές πλήθους , ο αλγόριθμος μείωσης δεδομένων καθορίζει ποιες τιμές πρέπει να ληφθούν.
Τύποι αλγόριθμου μείωσης δεδομένων
Υπάρχουν τέσσερις τύποι ρυθμίσεων αλγόριθμου μείωσης δεδομένων:
top: Οι πρώτες τιμές πλήθους λαμβάνονται από το μοντέλο σημασιολογίας.bottom: Οι τελευταίες τιμές πλήθους λαμβάνονται από το μοντέλο σημασιολογίας.sample: Περιλαμβάνονται τα πρώτα και τελευταία στοιχεία και πλήθος στοιχείων με ίσα διαστήματα μεταξύ τους. Για παράδειγμα, εάν έχετε ένα σημασιολογικό μοντέλο [0, 1, 2, ... 100] και ένα πλήθος 9, λαμβάνετε τις τιμές [0, 10, 20 ... 100].window: Φορτώνει ένα παράθυρο σημείων δεδομένων τη φορά που περιέχει count στοιχεία. Προς το παρόν,topτα καιwindowείναι ισοδύναμα. Στο μέλλον, θα υποστηρίζεται πλήρως μια ρύθμιση σε παράθυρα.
Από προεπιλογή, σε όλες τις απεικονίσεις Power BI εφαρμόζεται ο αλγόριθμος μείωσης κορυφαίων δεδομένων με την τιμή count να έχει οριστεί στα 1000 σημεία δεδομένων. Αυτή η προεπιλογή ισοδυναμεί με τη ρύθμιση των ακόλουθων ιδιοτήτων στο αρχείο capabilities.json :
"dataReductionAlgorithm": {
    "top": {
        "count": 1000
    }
}
Μπορείτε να τροποποιήσετε την τιμή count σε οποιαδήποτε ακέραια τιμή έως 30000. Οι απεικονίσεις Power BI που βασίζονται σε R μπορούν να υποστηρίζουν έως 150000 γραμμές.
Χρήση αλγόριθμου μείωσης δεδομένων
Ο αλγόριθμος μείωσης δεδομένων μπορεί να χρησιμοποιηθεί στην αντιστοίχιση προβολής δεδομένων κατηγορίας, πίνακα ή μήτρας.
Στην αντιστοίχιση κατηγορικών δεδομένων, μπορείτε να προσθέσετε τον αλγόριθμο στην ενότητα "κατηγορίες" ή/και "ομάδα" της values αντιστοίχισης κατηγορικών δεδομένων.
"dataViewMappings": {
    "categorical": {
        "categories": {
            "for": { "in": "category" },
            "dataReductionAlgorithm": {
                "window": {
                    "count": 300
                }
            }
        },
        "values": {
            "group": {
                "by": "series",
                "select": [{
                        "for": {
                            "in": "measure"
                        }
                    }
                ],
                "dataReductionAlgorithm": {
                    "top": {
                        "count": 100
                    }
                }
            }
        }
    }
}
Στην αντιστοίχιση προβολής δεδομένων πίνακα, εφαρμόστε τον αλγόριθμο μείωσης δεδομένων στην rows ενότητα του πίνακα αντιστοίχισης προβολής δεδομένων.
"dataViewMappings": [
    {
        "table": {
            "rows": {
                "for": {
                    "in": "values"
                },
                "dataReductionAlgorithm": {
                    "top": {
                        "count": 2000
                    }
                }
            }
        }
    }
]
Μπορείτε να εφαρμόσετε τον αλγόριθμο μείωσης δεδομένων στις rows ενότητες και columns της μήτρας αντιστοίχισης προβολής δεδομένων.
Σχετικό περιεχόμενο
Σχόλια
Σύντομα διαθέσιμα: Καθ' όλη τη διάρκεια του 2024 θα καταργήσουμε σταδιακά τα ζητήματα GitHub ως μηχανισμό ανάδρασης για το περιεχόμενο και θα το αντικαταστήσουμε με ένα νέο σύστημα ανάδρασης. Για περισσότερες πληροφορίες, ανατρέξτε στο θέμα: https://aka.ms/ContentUserFeedback.
Υποβολή και προβολή σχολίων για