Troubleshoot MCA billing issues with usage file pivot tables
This article helps you troubleshoot Microsoft Customer Agreement (MCA) billing issues using pivot tables in your usage files. Azure usage files contain all your Azure usage and consumption information. The information in the file can help you understand:
- Understand how Azure reservations are getting used and applied
- Reconcile information in Cost Management with your billed invoice
- Troubleshoot a cost spike
- Calculate a refund amount for a service level agreement
By using the information from your usage files, you can get a better understanding of usage issues and diagnose them. Usage files are generated in comma delimited (CSV) format. Because the usage files might be large CSV files, they're easier to manipulate and view as pivot tables in a spreadsheet application like Excel. Examples in this article use Excel, but you can use any spreadsheet application that you want.
Only Billing profile owners, Contributors, Readers, or Invoice Managers have access to download usage files. For more information, see Download usage for your Microsoft Customer Agreement.
Get the data and format it
Because Azure usage files are in CSV format, you need to prepare the data for use in Excel. Use the following steps to format the data as a table.
- Download the usage file using the instructions at Download usage in Azure portal.
- Open the file in Excel.
- The unformatted data resembles the following example.
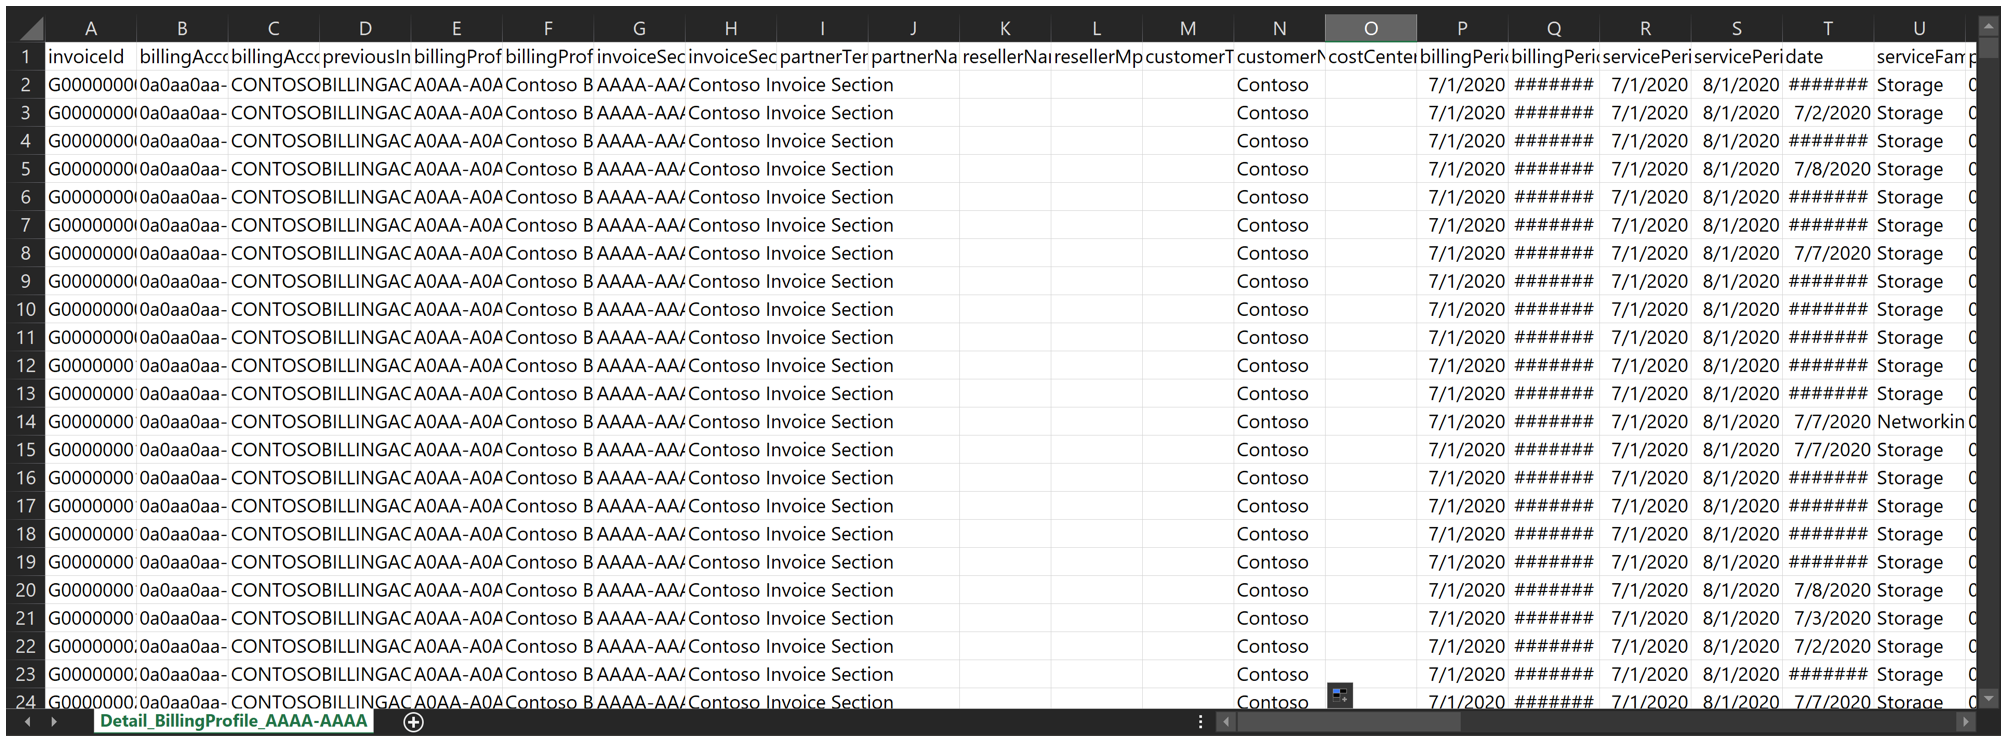
- Select the first field in the table, invoiceID.
- Press Ctrl + Shift + Down arrow and then Ctrl + Shift + Right Arrow to select all the information in the table.
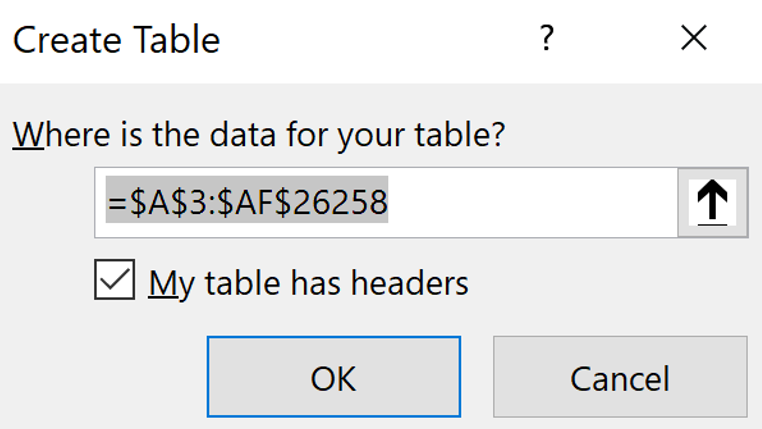
- In the top menu, select Insert > Table. In the Create table box, select My table has headers and then select OK.
- In top menu, select Insert > Pivot Table and then select OK. The action creates a new sheet in the file and takes you to the pivot table area on the right side of the sheet.
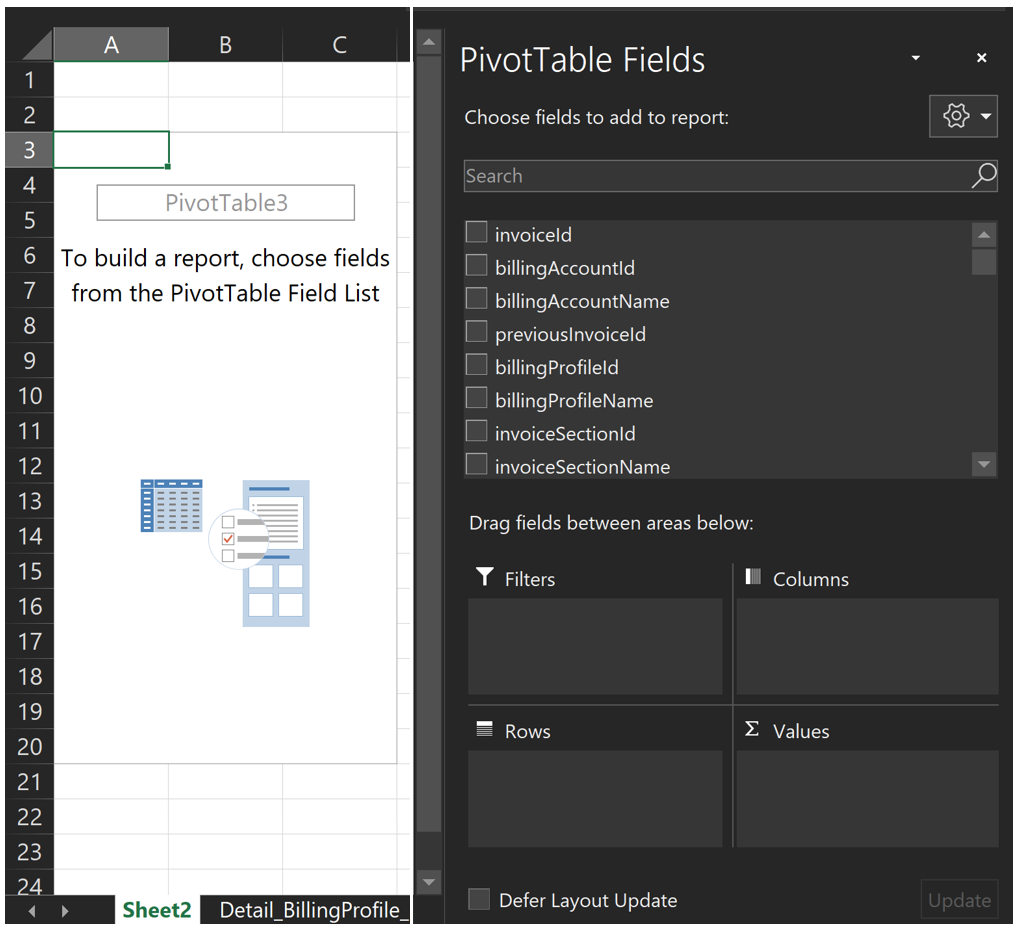


The PivotTable Fields area is a drag-and-drop area. Continue to the next section to create the pivot table.
Create pivot table to view Azure costs by resources
In this section, you create a pivot table where you can troubleshoot overall general Azure usage. The example table can help you investigate which service consumes the most resources. Or you can view the resources that incur the most cost and how a service is getting charged.
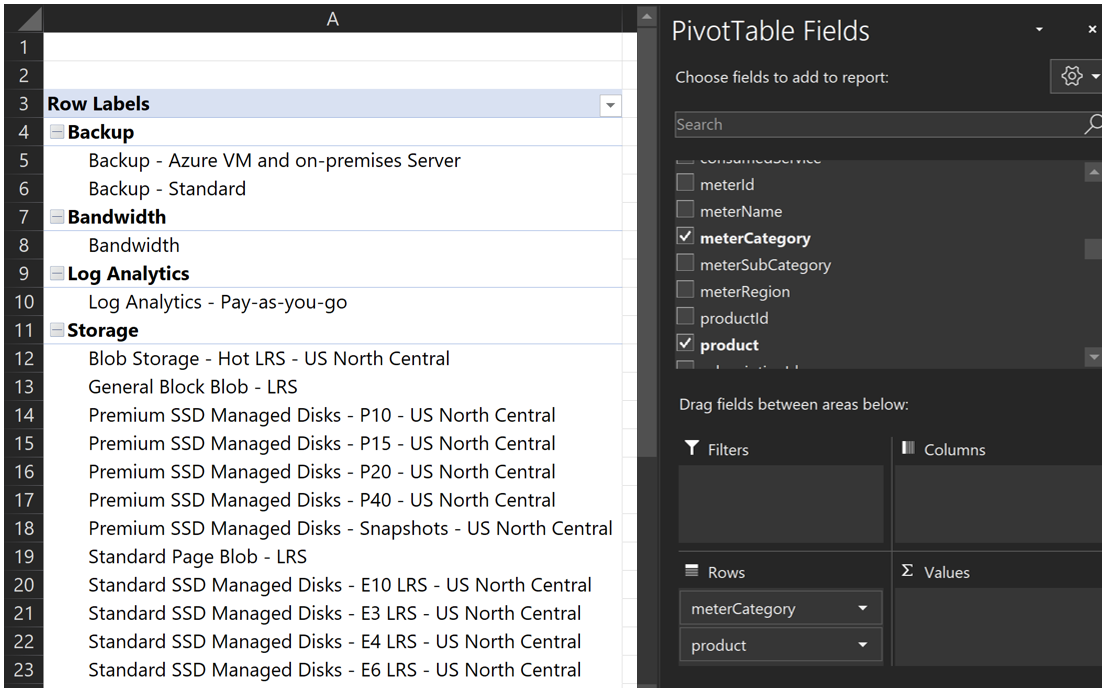
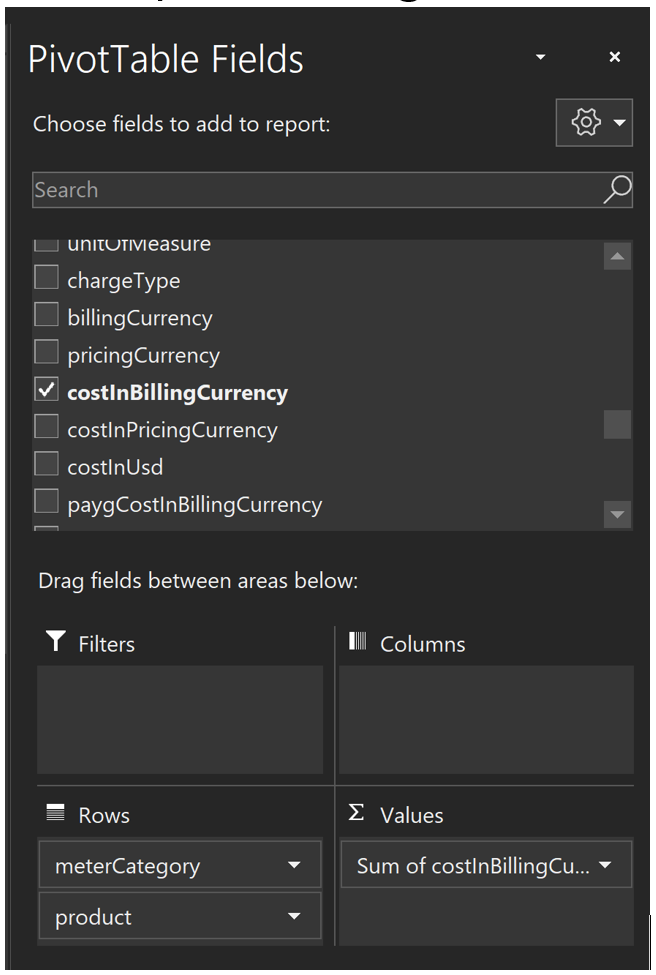
- In the PivotTable Fields area, drag Meter Category and Product to the Rows section. Put Product below Meter Category.
- Next, add the costInBillingCurrenty column to the Values section. You can also use the Quantity column instead to get information about consumption units and transactions. For example, GB and Hours. Or, transactions instead of cost in different currencies like USD, EUR, and INR.
- Now you have a dashboard for generalized consumption investigation. You can filter for a specific service using the filtering options in the pivot table.
 To filter a second level in a pivot table, for example a resource, select a second-level item in the table.

- Drag the ResourceID column to the Rows area under Product to see the cost of each service by resource.
- Add the date column to the Columns area to see daily consumption for the product.

- Expand and collapse months with the + symbols for each month's column.


Adding both the Cost and Quantity columns in the Values area is optional. Doing so creates two columns for each data section below each month and day when the Date column is in the Columns section of the pivot table.
For additional filters, you can add the InvoiceSection, costCenter, SubscriptionID, ResourceGroupName, or Tags to the filters section and select the desired scope.
Create pivot table to view cost for a specific resource
A single resource can incur several charges for different services. For example, a virtual machine can incur Compute charges, OS licensing, Bandwidth (data transfers), RI usage, and storage for snapshots. Whenever you want to review the overall usage for specific resources, the following steps guide you through creating a dashboard to view overall usage with your usage files.
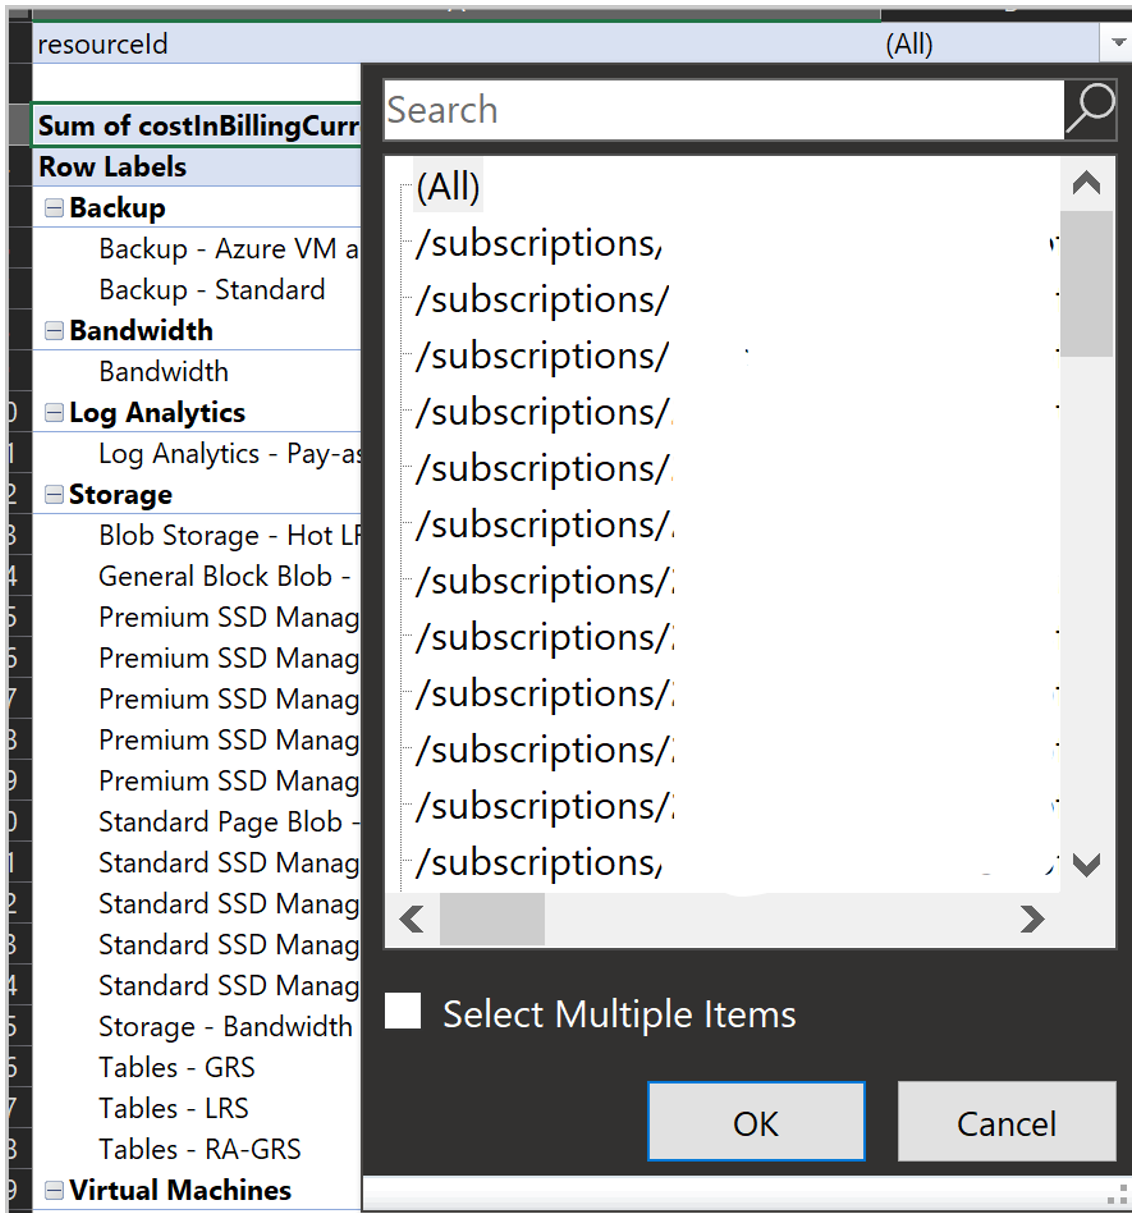
- In the right menu, drag ResourceID to the Filter section in the pivot table menu.
- Select the resource that you want to see the cost for. Type in the Search box to find a resource name.
- Add meterCategory and Product to the Rows area. Put Product below meterCategory.

- Next, add the Extended Cost column to the Values section. You can also use the Consumed Quantity column instead to get information about consumption units and transactions. For example, GB and Hours. Or, transactions instead of cost in different currencies like USD, EUR, and INR. Now you have a dashboard that shows all the services that the resource consumes.
- Add the Date column to the Columns section. It shows the daily consumption.
- You can expand and reduce using the + icons in each month's column.


Transform data before using large usage files
Sometimes your usage or reconciliation file is too large to open. Or, you might need just a portion of the information to troubleshoot an issue. For example, you might want only information only a particular resource or just the consumption for few services or resource groups. You can transform the data to summarize it before you create pivot tables.
Open a blank workbook in Excel.
In the upper menu, select Data > From Text/CSV, select your usage file, and then select Import.
At the bottom of the window, select Transform Data. A new window shows a summary of the data.

If you have a Microsoft Customer Agreement, skip this step and continue to the next because MCA usage files usually have the column titles in the first rows. Prepare the data by creating the table. Remove the top rows, leaving only the titles. Select Remove Rows > Remove Top Rows.
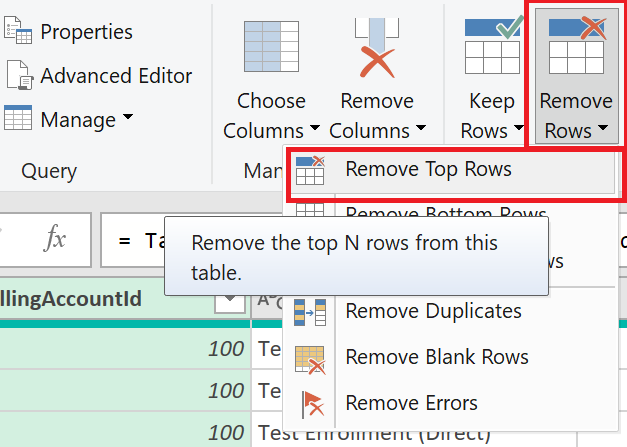
In the Remove Top Rows window, enter the number of rows to remove at the top. For EA usually 2, for CSP usually 1. Select OK.
Select Use First Row as Headers.
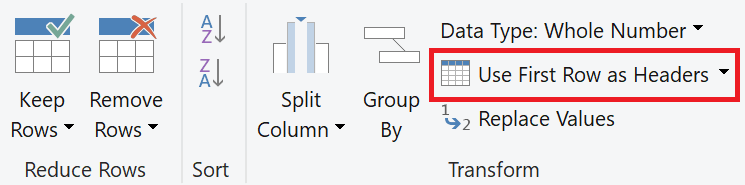
The table view shows column titles at the top.
Next, add a filter. Use the selector arrows at the right of each column title to filter. Suggested filters are Subscription ID, Service Name (Meter category), Instance ID, resource group. You can use multiple filters in the same document. We recommend that you apply all possible filters to reduce the document size and help later work.
After you've applied your filters, select Close & Load.

The file loads and shows a table with filtered usage data. Now you can create a new pivot table to troubleshoot usage issues.
Troubleshoot usage spikes
This section helps you understand how a usage spike appears in your Azure usage file, how to prevent usage spikes, monitor your resources, and when to contact Azure support. It's intended for customers with an Enterprise Agreement (EA) or a Microsoft Customer Agreement. They must have EA Admin or Billing administrator roles. For more information about permissions, see Download or view your Azure billing invoice and daily usage data.
A spike in your Azure usage or unexpected charges for a particular service or resource is often caused by either an incident or unintentional misuse.
In either case, you need to narrow down the affected services and resources before you contact support so that you can choose the right support area.
It's important to understand that it's unlikely that Microsoft can determine the root cause of increased usage and associated charges. So, customers can download their own detailed usage data in the Azure portal.
Microsoft doesn't monitor your deployed Azure resources like virtual machines, networks, or data transfers because of security concerns and customer privacy. However, Microsoft tries to inform you about how you can monitor your Azure usage. Ultimately, it's your responsibility to monitor your own usage.
What a spike looks like in the usage file
After you've applied the filters described in the preceding sections, you can look for abnormal. For example, you might be troubleshooting a spike for the Bandwidth Meter Category).
Place Product and Instance ID (Resource ID for a Microsoft Customer Agreement) in the Rows section of the pivot table tool. Then add Cost in Values, Subscription ID in Filters and Date in Columns. Then filter to show only data for a subscription ID. For example, 111111111111-1111-1111-111111111111.
The following image shows what a spike in Bandwidth (Data Transfers) looks like.

The spike is for a particular resource. In this case, row 7 in the Excel file shows the cost values for the Storage account storageaccountnameazurefile1. On October 1 2020, the cost has a value near zero (0) USD (2.23043E-06, which equals to 0.000002230431449). You can see a large spike on October 2 2020 and October 3 2020, when the cost goes to 10,000 and 28,000 USD. Costs returned to normal on October 4 2020 (9.29E-07).
In this example, you identified the resource that incurred a large bandwidth charge, the dates it occurred, and the specific product (Inter-region – Data Transfer Out – Europe). Determine if the spike resulted from a large data transfer. Use the information in the preceding sections to verify your affected resource.
If you determine that there were no transfers from the resource for the mentioned dates, then engage an Azure technical team. The team can help determine if there's a bug or incident causing the problem. In this example, the affected resource is a Storage account. So, you'd contact the Azure Storage technical team. Similarly, if the spike affected a virtual machine, you'd contact the Azure Virtual Machines technical team to determine if there's an ongoing incident affecting the Virtual Machine service.
If there's an ongoing incident, the Azure technical team would coordinate with the Azure Billing team to review a refund request.
Tools to monitor Azure usage
You can always manage your costs with Azure Cost Management and create budgets. For more information, see:
For Storage usage, we recommend that you use the Storage Analytics tool. It allows you to use per-transaction logging. The logs are detailed, but you can do comprehensive tracing and debugging on your own. For more information, see:
- Storage Analytics
- Storage Analytics log format
- Enable and manage Azure Storage Analytics logs (classic)
For network-related usage, you can use network capture tools like Network Monitoror Fiddler.
For issues related to Virtual Machines with a Windows operating system image, you can use the Windows Event Log.
For Platform as a Service (PaaS) deployments, enable Azure diagnostics in the application.
For Infrastructure as a Service (IaaS) deployments, enable Windows Communication Foundation tracing.
Enable Enhanced Logging for IIS 8.5.
Enable diagnostics logging for web apps in Azure App Service.
For more details and advice for your situation, contact your Microsoft Customer Success Account Manager to request assistance from a Cloud Solution Architect.
Next steps
Feedback
Coming soon: Throughout 2024 we will be phasing out GitHub Issues as the feedback mechanism for content and replacing it with a new feedback system. For more information see: https://aka.ms/ContentUserFeedback.
Submit and view feedback for