Troubleshoot in Visual Studio Code directly from the web client
With Business Central 2023 release wave 2, you can open a new Visual Studio Code session directly from the web client for a specific customer production or sandbox environment. This enables performing troubleshooting, such as debugging, inspecting variables, setting breakpoints and viewing source code.
Depending on the context, Visual Studio Code opens to allow inspecting objects and source, and allows attaching to debug or snapshot debug and profile the current web client session. Whether you can access the source code is gated by the resource exposure profile settings for each extension. For more information, see Resource exposure policy setting.
From the Business Central web client, you can open Visual Studio Code in the following ways:
- Open a page from the Page Inspector
- Troubleshoot the current session from within Help and Support
Open a page from the Page Inspector
From a page in the Business Central web client, you can open the Page Inspection page and explore the code behind it in Visual Studio Code. For more information about Page inspection, see Page inspection.
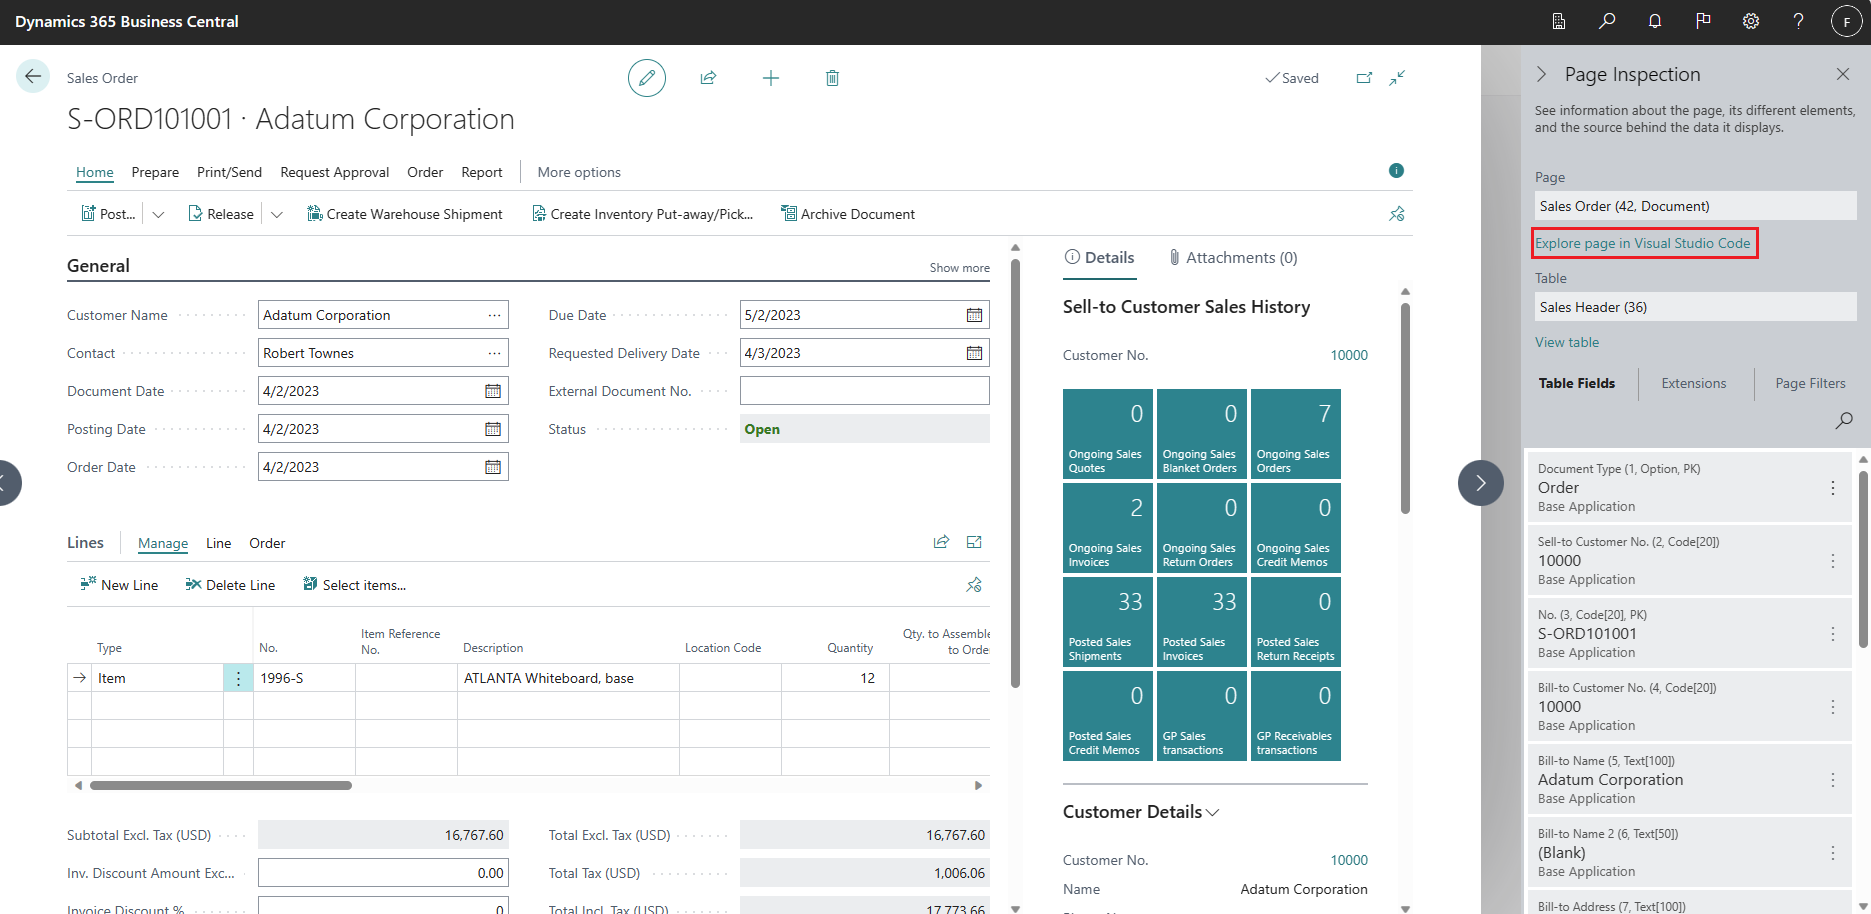
To open and explore a page from the Page Inspector, do the following:
- Locate the page that you want to inspect.
- From that page, run the Page Inspection with Ctrl+Alt+F1.
- Choose the Explore page in Visual Studio Code link.
- Next, to open a Visual Studio Code instance, you must choose the Open button in the Allow an extension to open this URI? dialog. If you already have Visual Studio Code running that instance opens.
- Then, you must specify, if you want to create a new project, or use an existing project. You'll only be asked the first time, and from then on, the Visual Studio Code window that was last active will be used.
- Next, you must decide if you want to download symbols.
Note
If you specify yes, the app.json file will be updated with the dependent extensions of the page, which are shown on the Extensions tab in the Page Inspection page, and the symbols will automatically be downloaded. You can specify no, if you're already working on the specific source code files.
If you say no, and don't have the right symbols downloaded, you will not be able to navigate to the object source code. - Now, you're prompted whether to do a snapshot or regular debugging session, or not to debug, but just view the source code.
Note
For production environments, regular debugging isn't supported.
- If you want to debug, then set breakpoints and go back to the web client to run the task. When the breakpoint is hit, you can inspect the code in Visual Studio Code.
You can also choose to inspect a specific field on a page.
- Locate the page that you want to inspect.
- From that page, run the Page Inspection with Ctrl+Alt+F1.
- Choose the field to inspect, select the dropdown menu, and then choose Explore field in VS Code. The source code for the table field definition behind the page field is now opened.
Troubleshoot from the Help and Support page
In the Business Central web client, you can open the Help and Support page and explore the code behind it in Visual Studio Code.
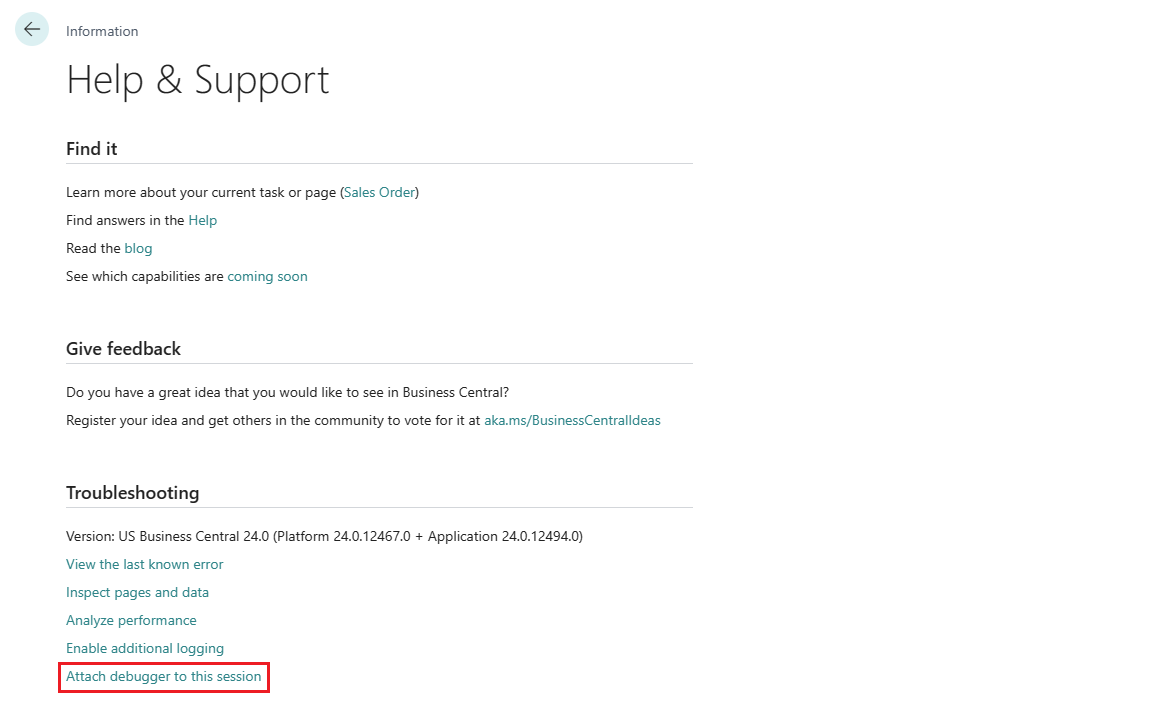
To attach the debugger to a session, do the following:
- Go to the Help and Support page, and then choose the Attach debugger to this session link under the Troubleshooting section.
- Next, to open a Visual Studio Code instance, you must choose the Open button in the Allow an extension to open this URI? dialog. If you already have Visual Studio Code running that instance opens.
- Then, you must specify, if you want to create a new project, or use an existing project. You'll only be asked the first time, and from then on, the Visual Studio Code window that was last active will be used.
- If you want to debug, then set breakpoints and go back to the web client to run the task. When the breakpoint is hit, you can inspect the code in Visual Studio Code.
Note
For production environments, regular debugging isn't supported.
Good to know
- If Visual Studio Code is already open, the last active session is used; otherwise, a new Visual Studio Code session opens. If the AL Language extension isn't installed, the user is asked to install it, and the process ends.
- When invoked, a new project is created, and a matching launch configuration is created, depending on the current environment being a production or sandbox environment.
- If the user chooses to debug, Visual Studio Code attaches to the web client process, which it was invoked from and awaits breaking on error.
- If reusing a project and the source files aren't up to date with the version on the server, the breakpoints won't be hit correctly when debugging. For more information, see Snapshot debugging.
- When you choose to generate new projects, remember to delete the projects occasionally to not accumulate many unused projects.
- Running the web client in a browser, you're typically not running the browser as an administrator, which means that Visual Studio Code also doesn't open in administrator mode. So, for example, if Visual Studio Code prompts you for an update, and you choose yes, you get an error, because you don't have permissions to update. It's then recommended to shut down Visual Studio Code, and reopen it as an administrator and update it. Then, you can continue debugging.
See also
Resource exposure policy setting
Debugging
Snapshot debugging
Page inspection
Feedback
Coming soon: Throughout 2024 we will be phasing out GitHub Issues as the feedback mechanism for content and replacing it with a new feedback system. For more information see: https://aka.ms/ContentUserFeedback.
Submit and view feedback for