What's New in DevTools (Microsoft Edge 80)
To check out the latest features of Microsoft Edge DevTools and the Microsoft Edge DevTools extension for Microsoft Visual Studio Code and Visual Studio, read these announcements.
To stay up to date and get the latest DevTools features, download an Insiders preview version of Microsoft Edge. Whether you're on Windows, Linux, or macOS, consider using Canary (or another preview channel) as your default development browser. The Beta, Dev, and Canary versions of Microsoft Edge run as separate apps, side-by-side with the stable, released version of Microsoft Edge. See Microsoft Edge Insider Channels.
For the latest announcements, follow the Microsoft Edge team on Twitter. To report a problem with DevTools or ask for a new feature, file an issue in the MicrosoftEdge/DevTools repo.
Announcements from the Microsoft Edge DevTools team
Accessibility improvements to the DevTools
The DevTools team has contributed 170 changes to Chromium to address high-impact color contrast, keyboard, and screen reader issues in the DevTools. Every developer building the web should be able to use the DevTools.
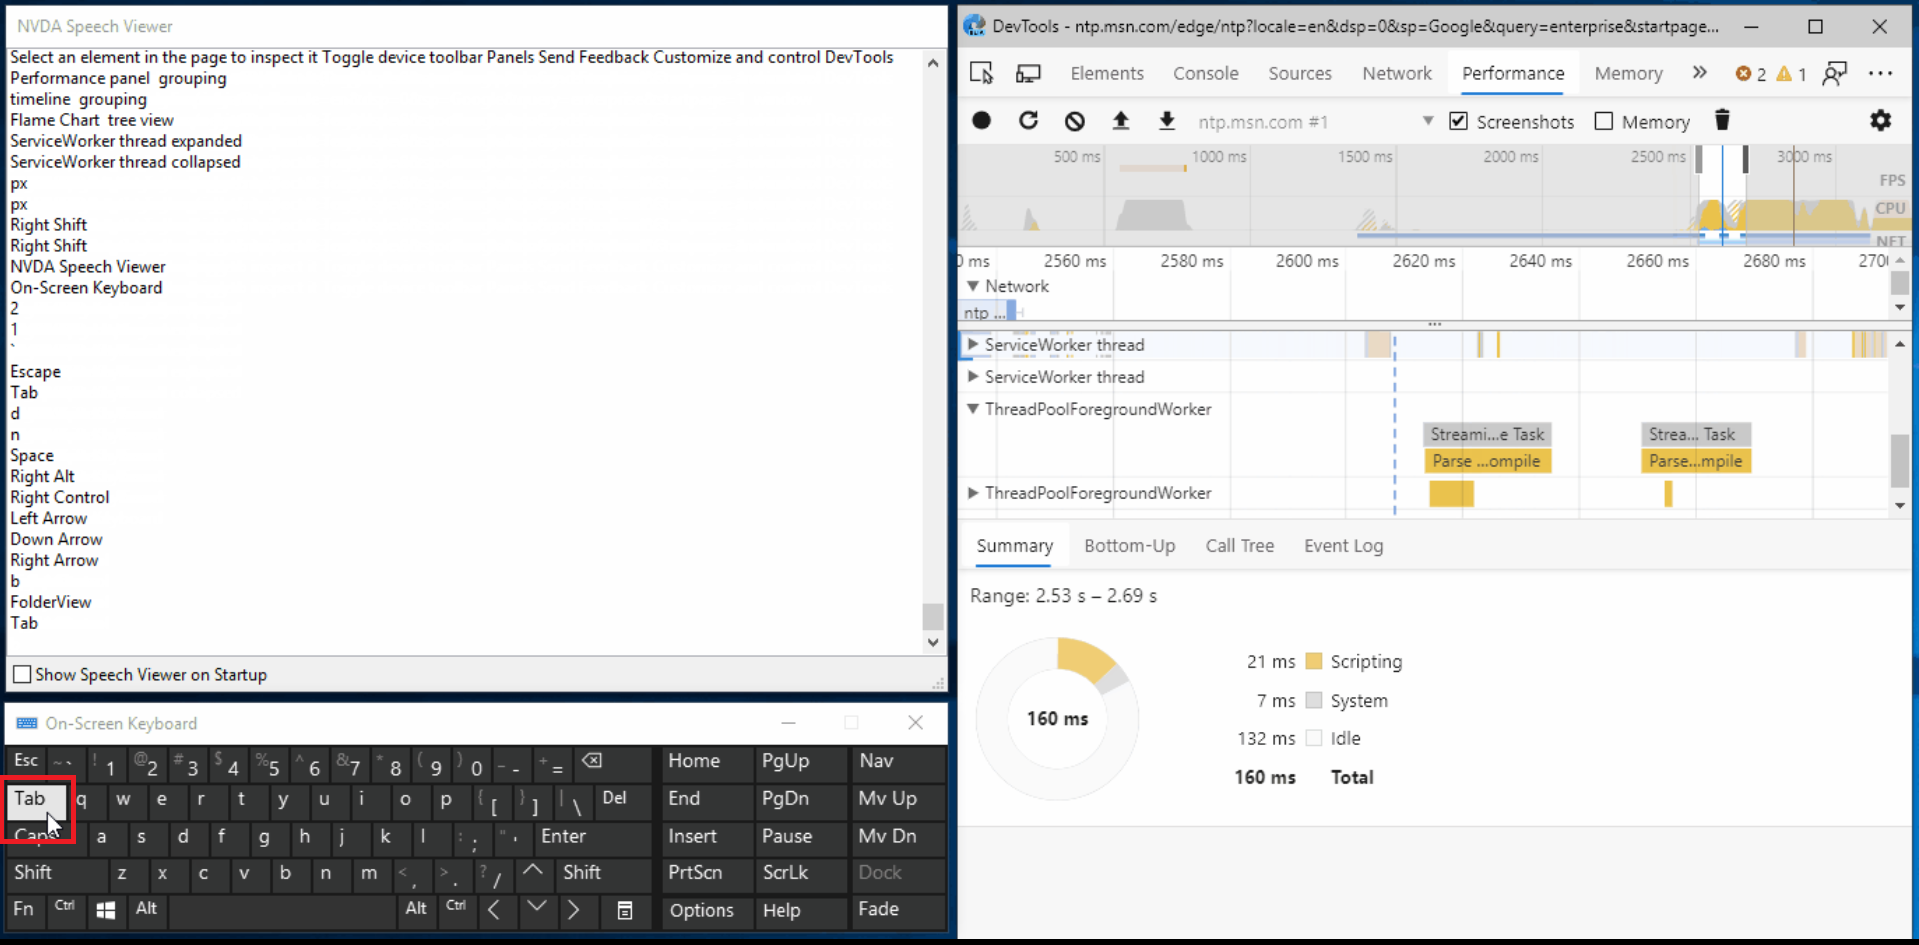
Want to learn how to make your web page accessible to all of your users? Download the Accessibility Insights and webhint extensions for Microsoft Edge to get started.
If you use screen readers or the keyboard to navigate around the DevTools, send your feedback by tweeting at us or selecting the Send Feedback icon!
Chromium issue #963183
See also:
Using the DevTools in other languages
Many developers use other developer tools, like StackOverflow and Visual Studio Code, in their native language, not just in English. We're excited to announce localization for the DevTools, which you can now use in one of 10 languages besides English:
- Chinese (Simplified) - 中文(简体)
- Chinese (Traditional) - 中文(繁體)
- French – français
- German - deutsch
- Italian - italiano
- Japanese - 日本語
- Korean - 한국어
- Portuguese - português
- Russian – русский
- Spanish - español
Go to edge://flags and set the Enable localized Developer Tools flag to Enabled. Also set the Developer Tools experiments flag to Enabled. Restart Microsoft Edge and open the DevTools. The DevTools match the language you use for Microsoft Edge in edge://settings/languages.

If you want to use the DevTools in a different language than the ones that are available, tweet at us or click the Send Feedback icon.
Chromium issue #941561
See also:
webhint Microsoft Edge extension
The webhint Microsoft Edge extension allows you to easily scan your web page and get feedback on accessibility, browser compatibility, security, performance, and more within the DevTools. Read more at https://webhint.io.
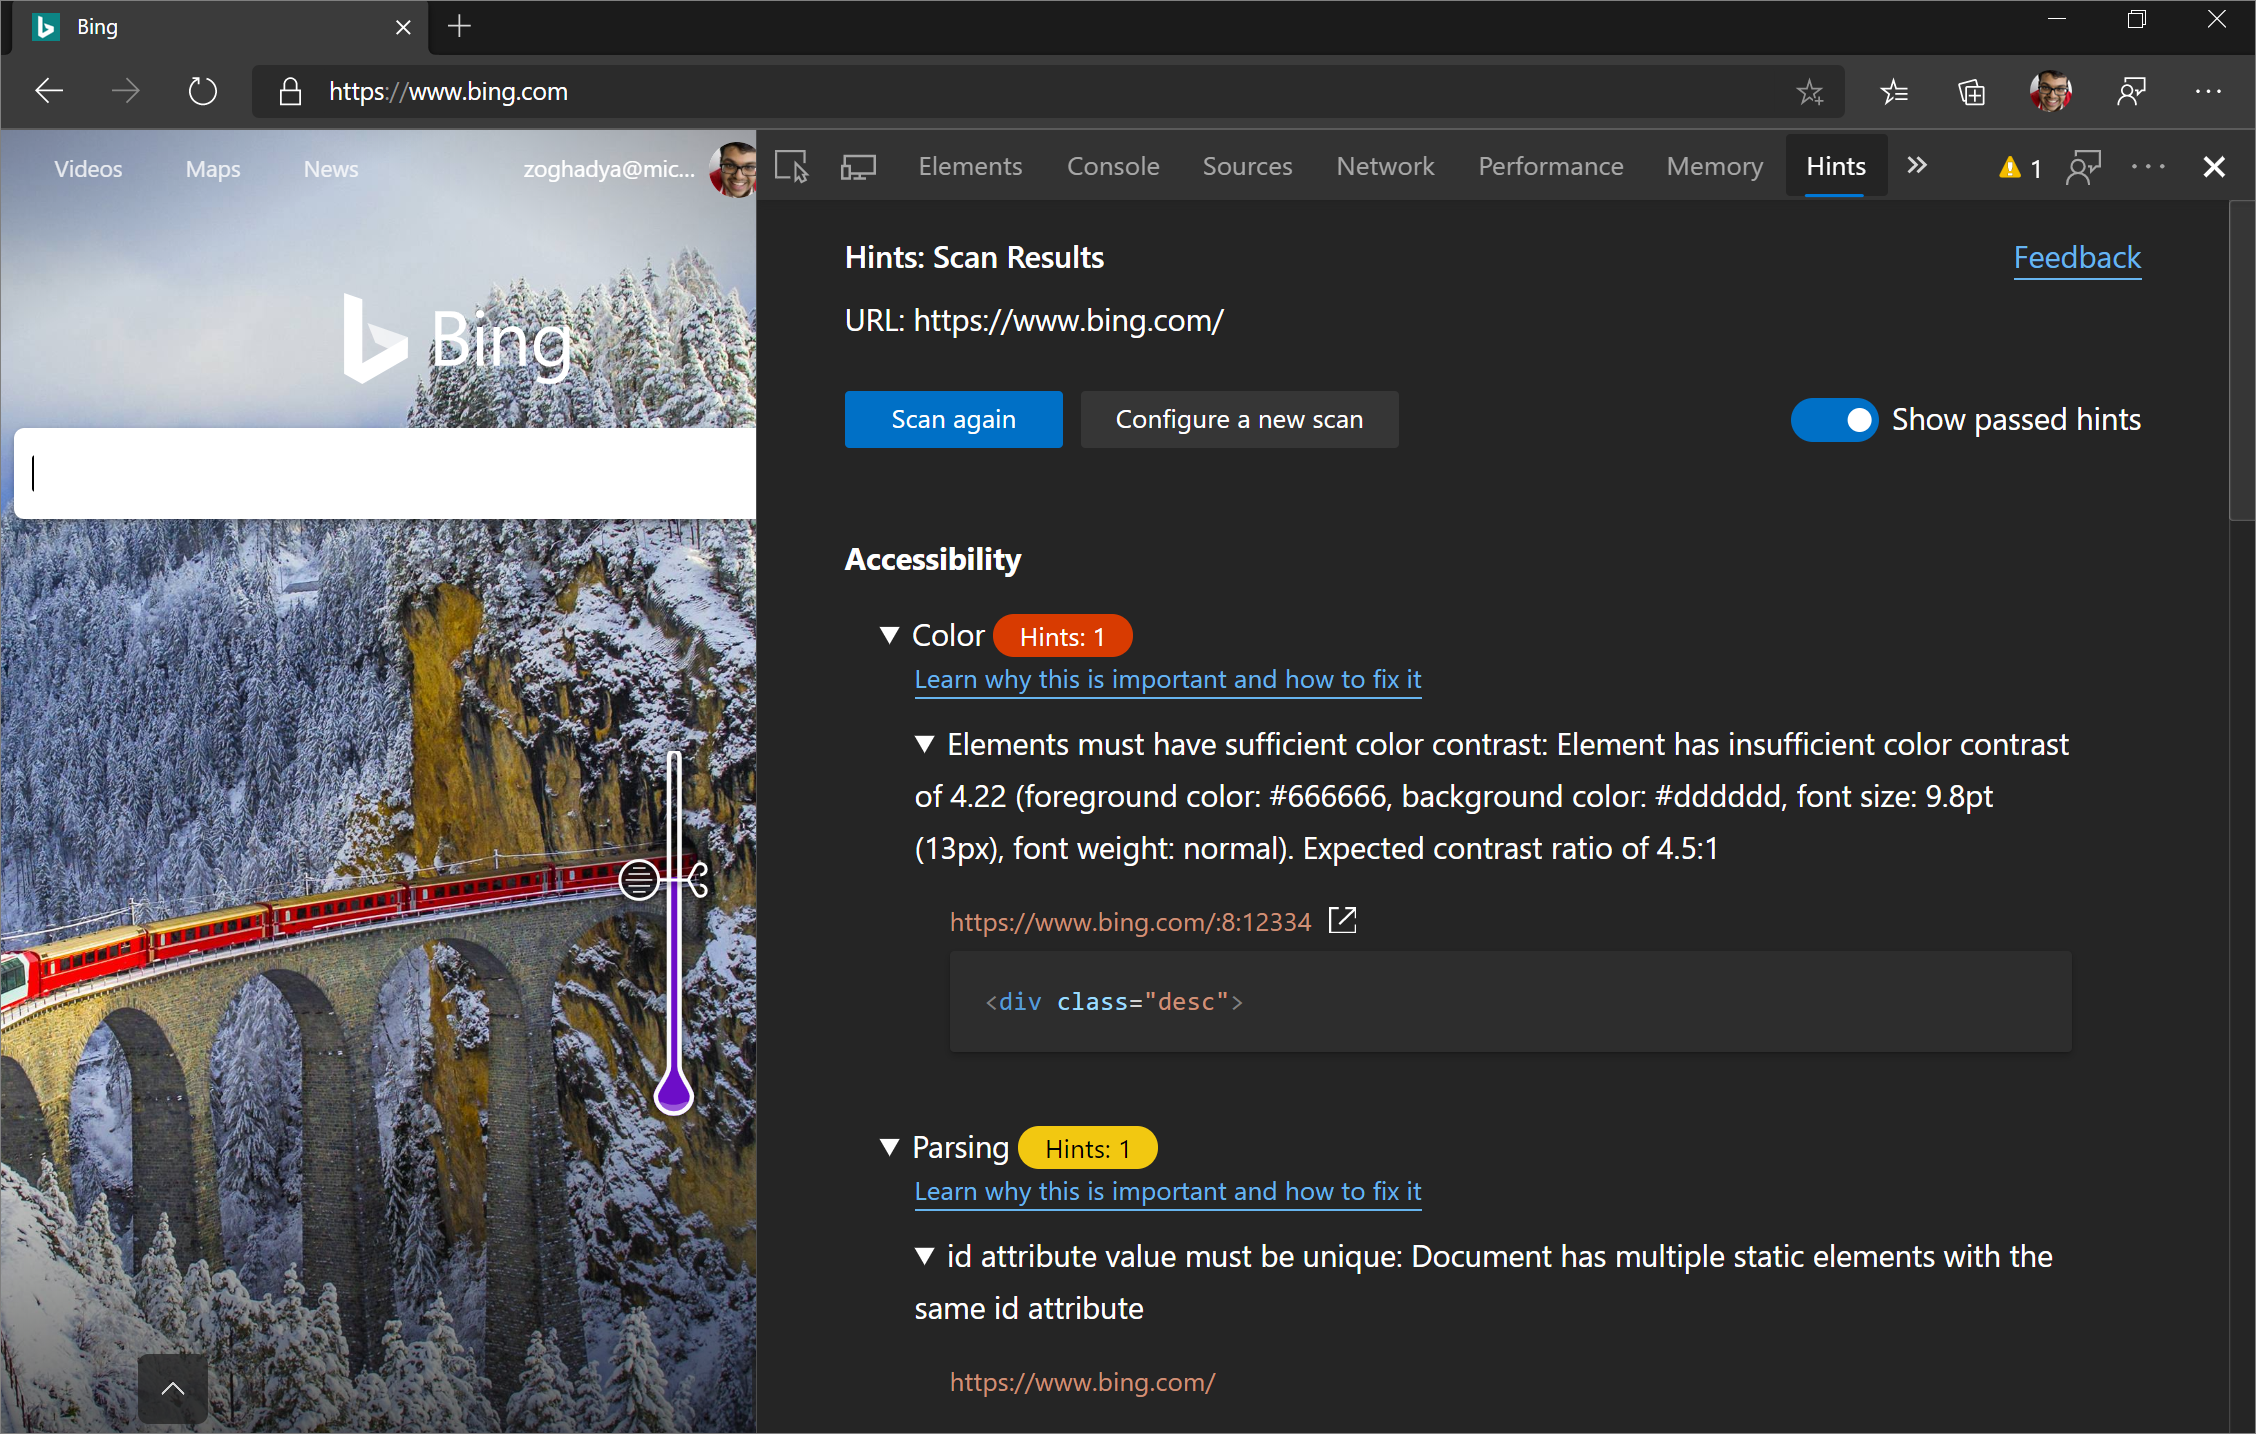
Try the webhint browser extension in Microsoft Edge. Once you install the extension, open DevTools and then select the Hints tool. From here, run a customizable site scan. Head over to webhint.io to learn more.
See also:
3D View
Use the 3D View to debug your web application by navigating through the Document Object Model (DOM) or the z-index stacking context.
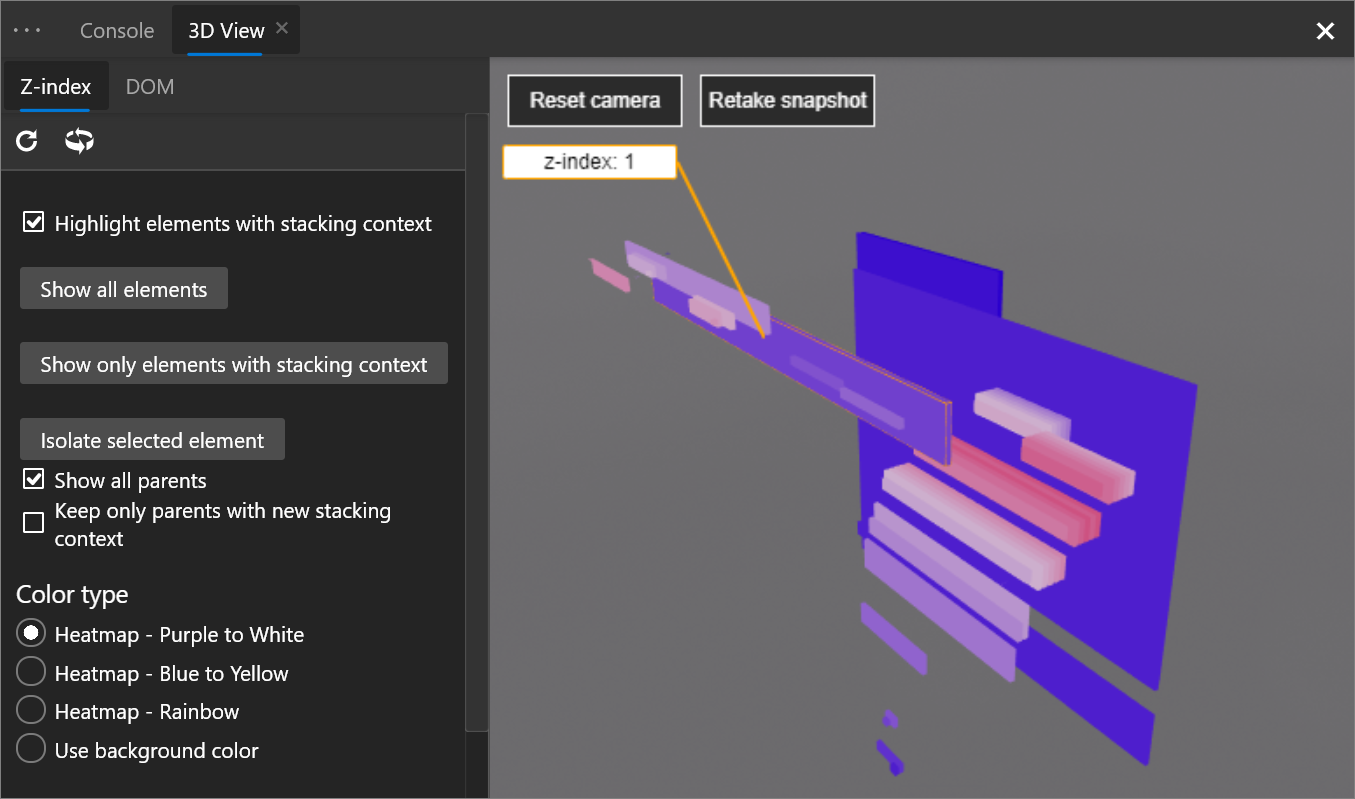
To access the 3D View, go to edge://flags and ensure that the Developer Tools experiments flag is set to Enabled. Restart Microsoft Edge and open the DevTools. Press F1 in DevTools, or open the Settings > Experiments section, and turn on the Enable 3D View checkbox. Now, press Ctrl+Shift+P (Windows/Linux) or Command+Shift+P (macOS), type in 3D View, and then select Show 3D View.
We're working on the UI and adding more functionality to the 3D View, so please send us your feedback.
Chromium issue #987787
See also:
Visual Studio Code extensions
The DevTools team has also released some extensions for Visual Studio Code that let you use the power of the DevTools directly from your text editor. Check out the following extensions.
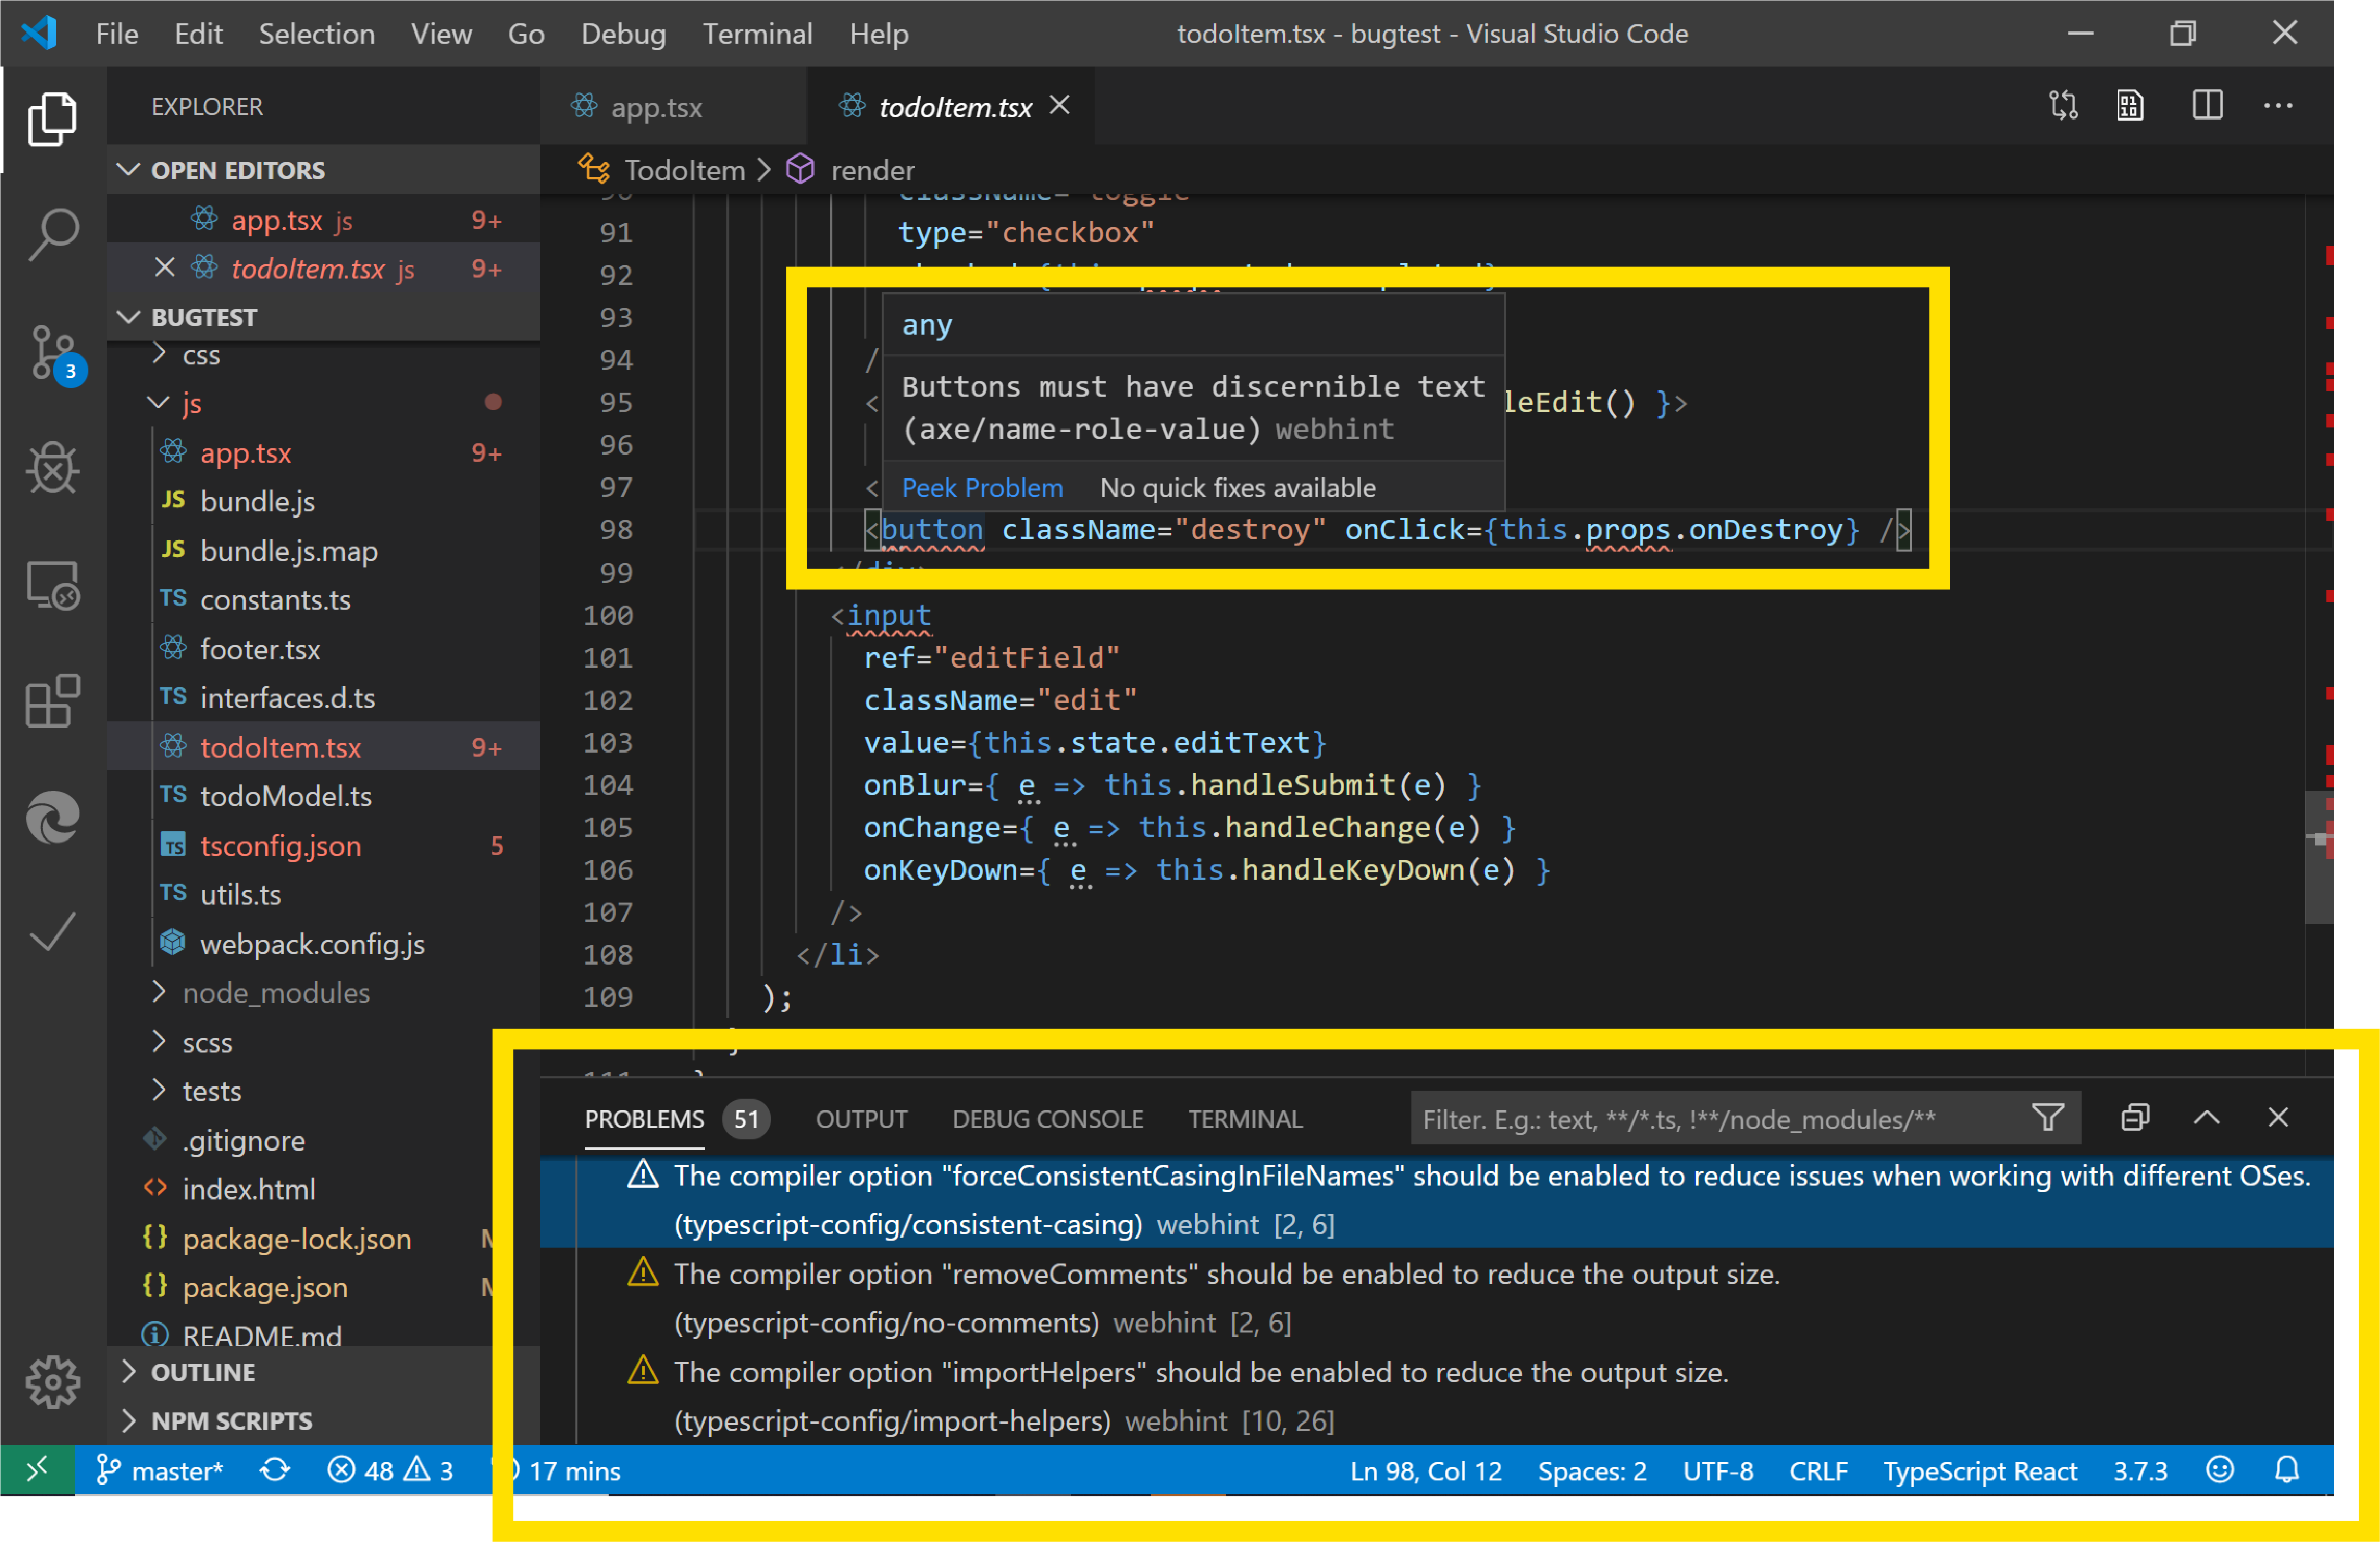
Elements for Microsoft Edge
Use the Elements tool from within Visual Studio Code by adding the Elements for Microsoft Edge Visual Studio Code extension.
Update: As of 2022, the Elements for Microsoft Edge extension is now the Microsoft Edge DevTools extension for Visual Studio Code.
For more information, check out Microsoft Edge DevTools extension for Visual Studio Code.
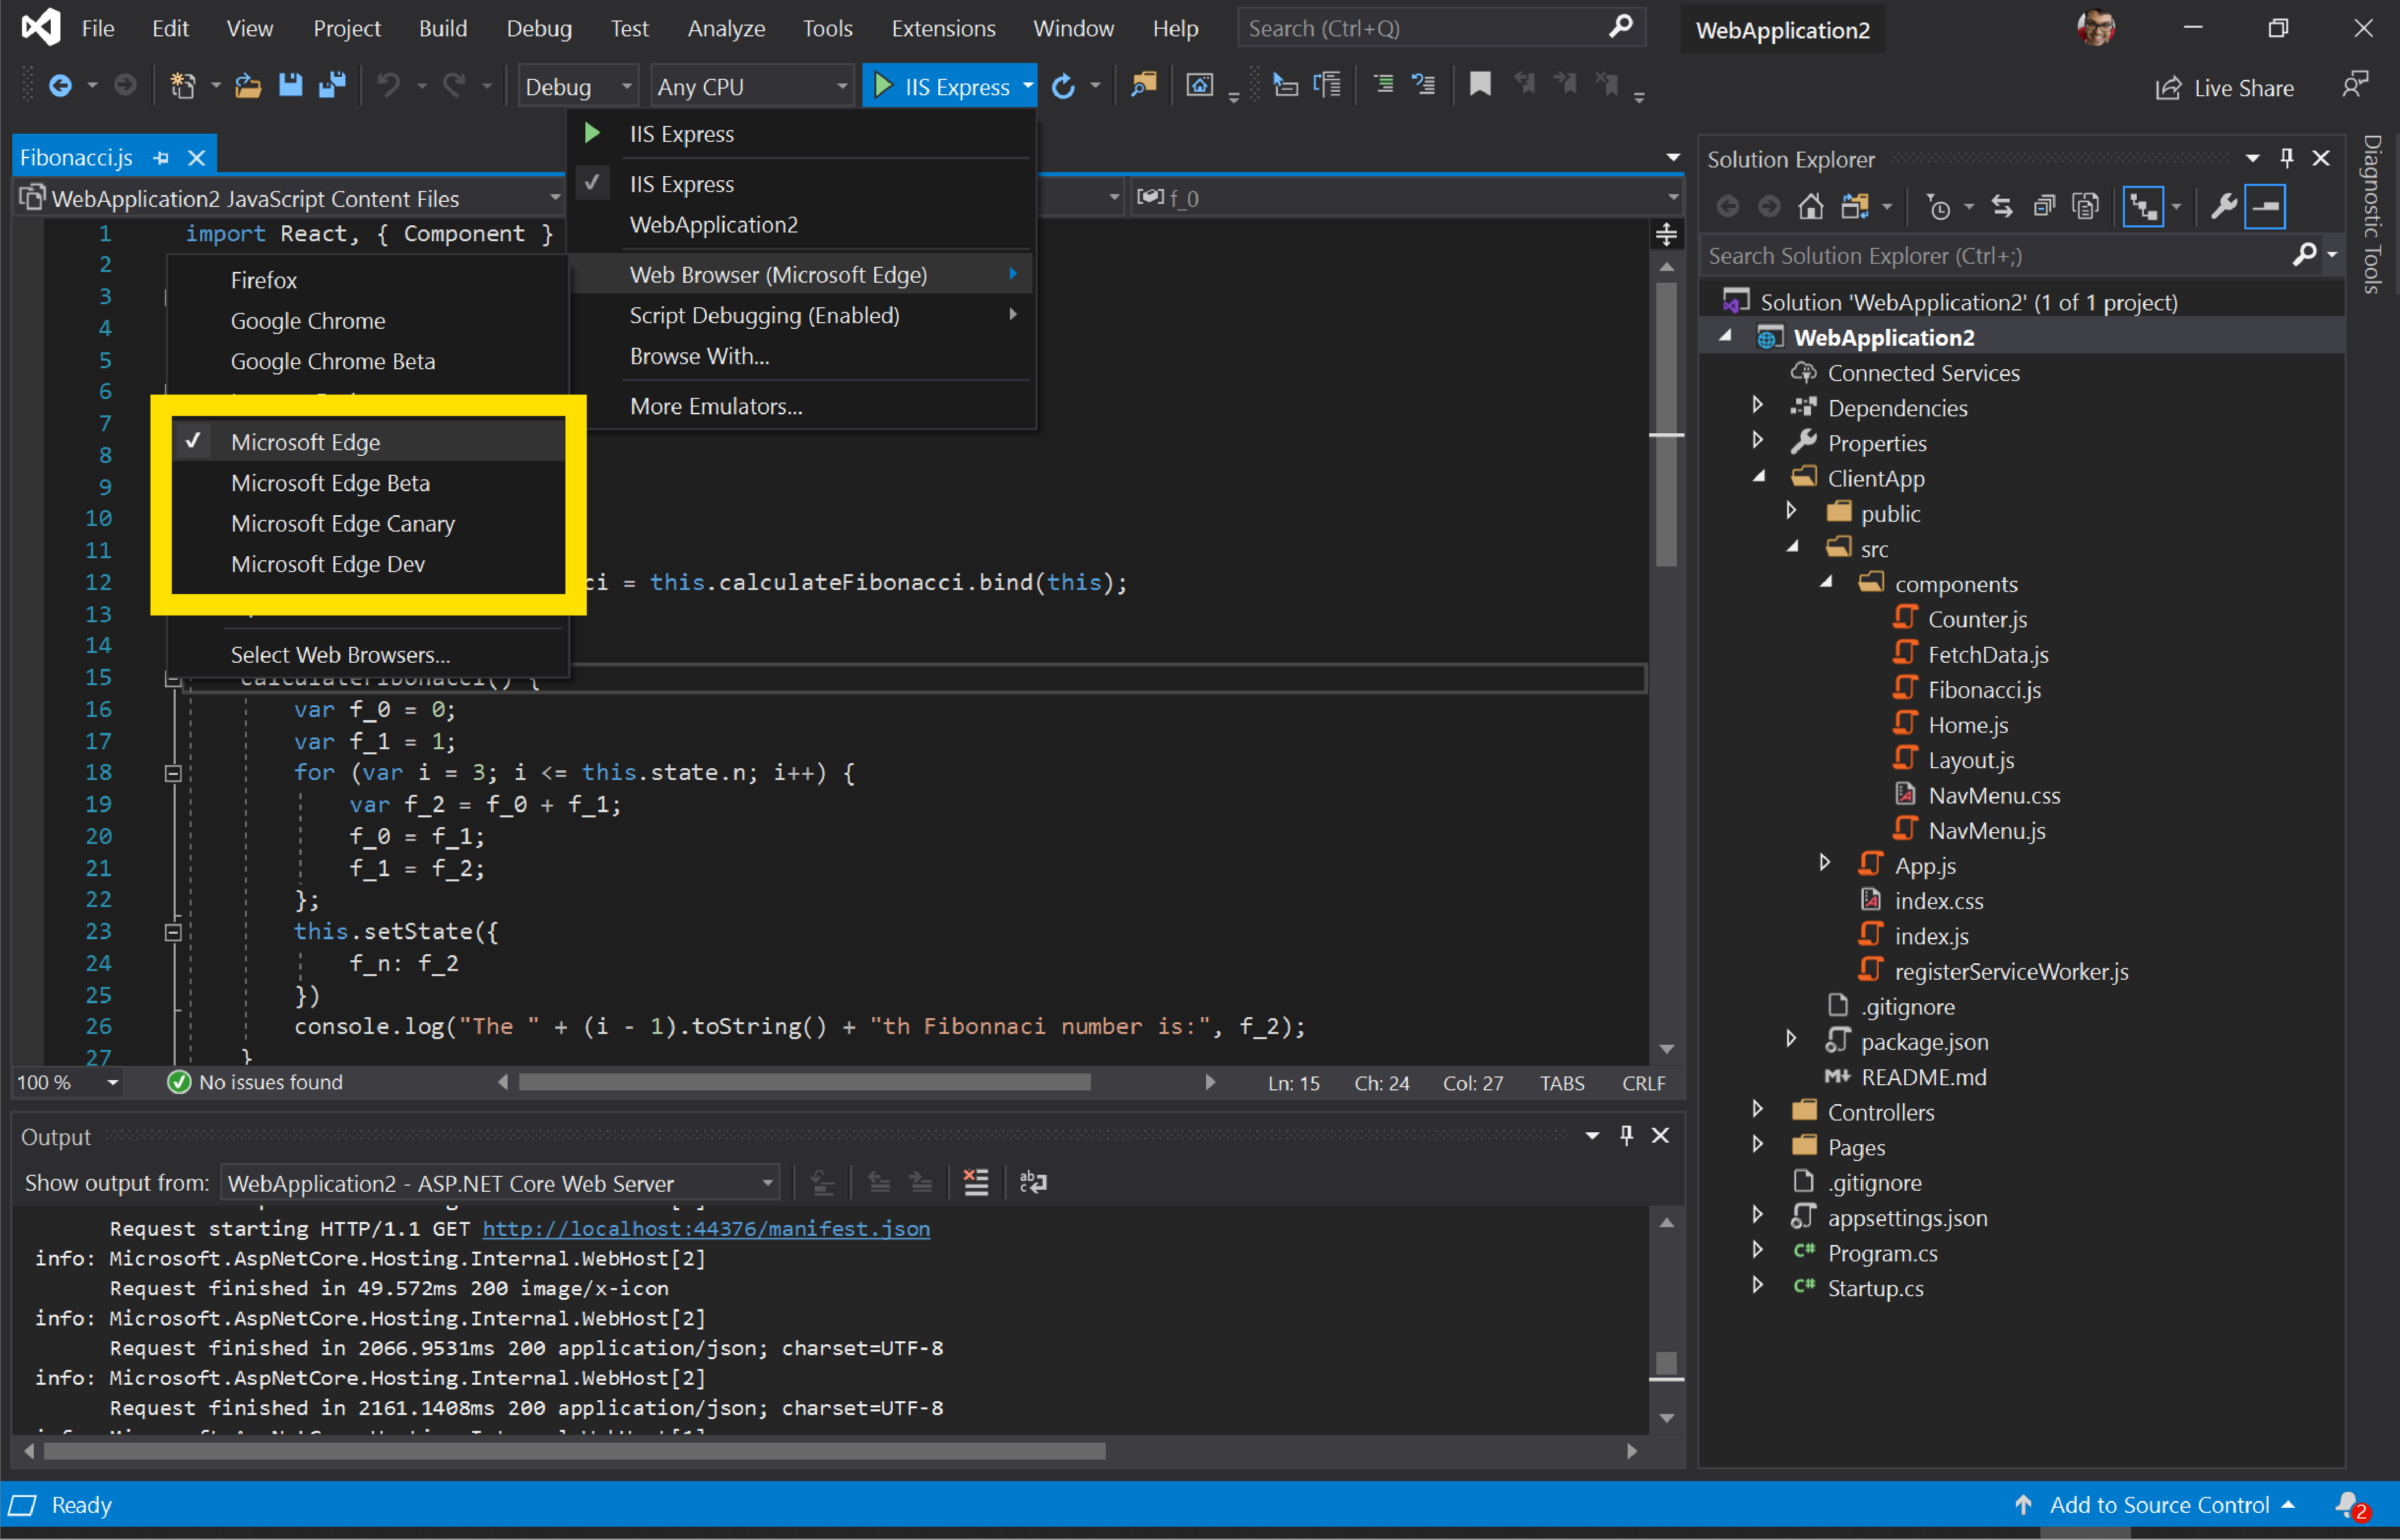
Debugger for Microsoft Edge
With the Debugger for Microsoft Edge Visual Studio Code extension, debug JavaScript running in Microsoft Edge directly from Visual Studio Code.

Update: As of 2022, the Debugger for Microsoft Edge Visual Studio Code extension has been replaced by a built-in debugger for Microsoft Edge in Visual Studio Code. See Debug Microsoft Edge in Visual Studio Code.
webhint
The webhint Visual Studio Code extension uses webhint to improve your web page while you're writing it! This extension runs and reports diagnostics on your workspace files based on webhint analysis.
Learn more about the Visual Studio Code webhint extension.
See also:
Visual Studio integration
In Visual Studio 2019 version 16.2 or later, use the Visual Studio debugger to debug JavaScript running in Microsoft Edge. Download Visual Studio 2019 to try this feature out.
Read our blog post to learn how to debug Microsoft Edge from Visual Studio.
To learn more about debugging Microsoft Edge from Visual Studio, see Visual Studio for web development.
Tracking prevention Console messages
Tracking prevention is a unique feature in Microsoft Edge that blocks you from being tracked by a website before you visited it. The default tracking prevention setting is Balanced mode, which blocks 3rd party trackers and known malicious trackers for an experience that balances privacy and web compatibility. To give you more insight into the compatibility of your web page when certain trackers are blocked, The Microsoft Edge team added warning messages in the Console when a tracker is blocked.
![]()
Read more about tracking prevention and the balance between privacy and web compatibility.
See also:
Announcements from the Chromium project
The following sections announce additional features available in Microsoft Edge 80 that were contributed to the open source Chromium project.
Support for let and class redeclarations in the Console
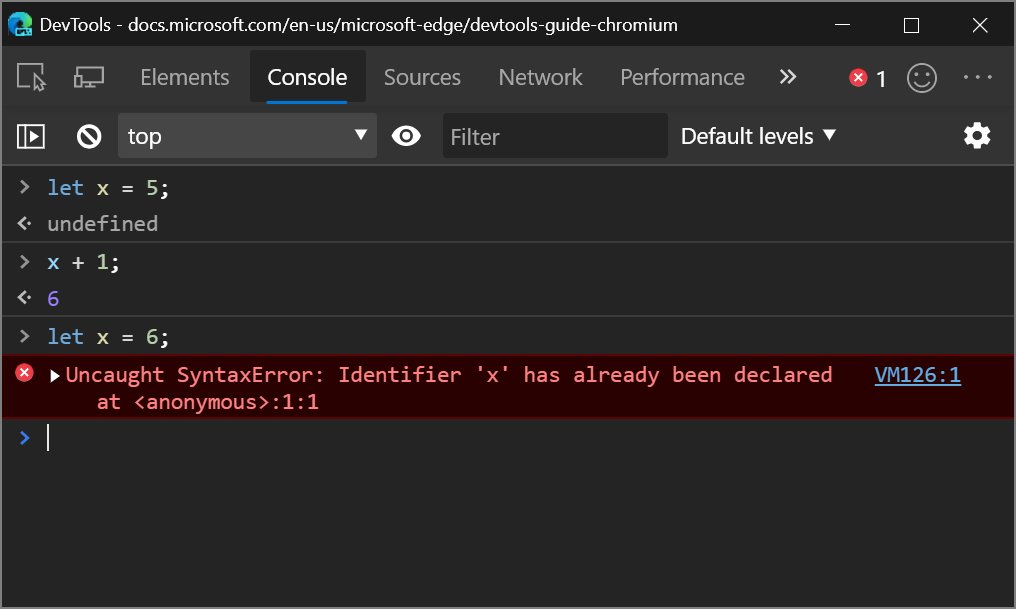
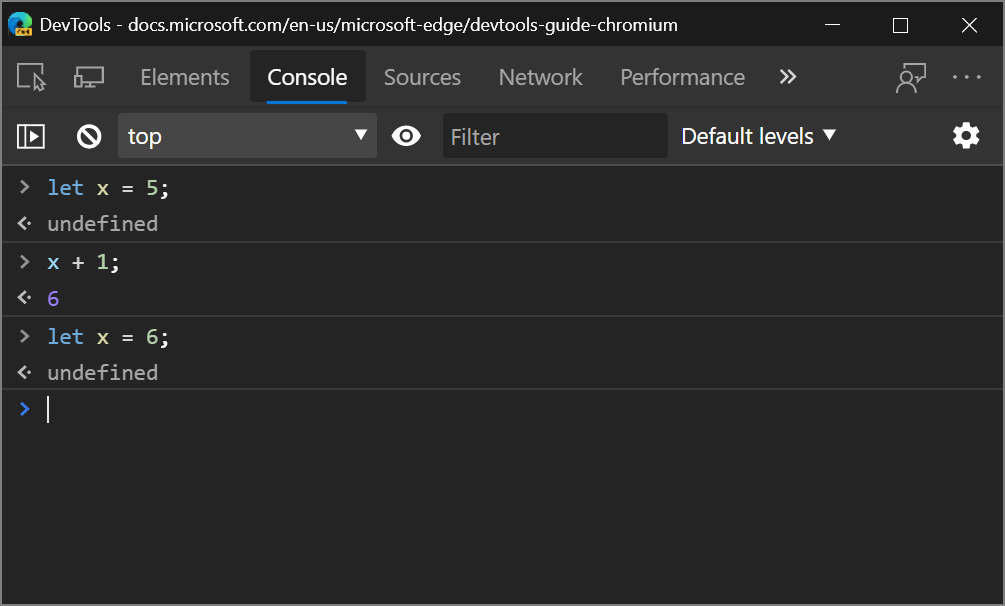
The Console now supports redeclarations of let and class statements. The inability to redeclare was a common annoyance for web developers who use the Console to experiment with new JavaScript code.
Warning
Redeclaring a let or class statement in a script outside of the Console or within a single Console input still causes a SyntaxError.
For example, previously, when re-declaring a local variable with let, the Console threw an error:
Now, the Console allows the redeclaration:
Chromium issue #1004193
See also:
Improved WebAssembly debugging
DevTools has started to support the DWARF Debugging Standard, which means increased support for stepping over code, setting breakpoints, and resolving stack traces in your source languages within DevTools.
See also:
- Filter Wasm resource type in the Network tool in What's New in DevTools (Microsoft Edge 92).
Network panel updates
Request Initiator Chains in the Initiator panel
You can now view the initiators and dependencies of a network request as a nested list. This may help you understand why a resource was requested, or what network activity a certain resource (such as a script) caused.
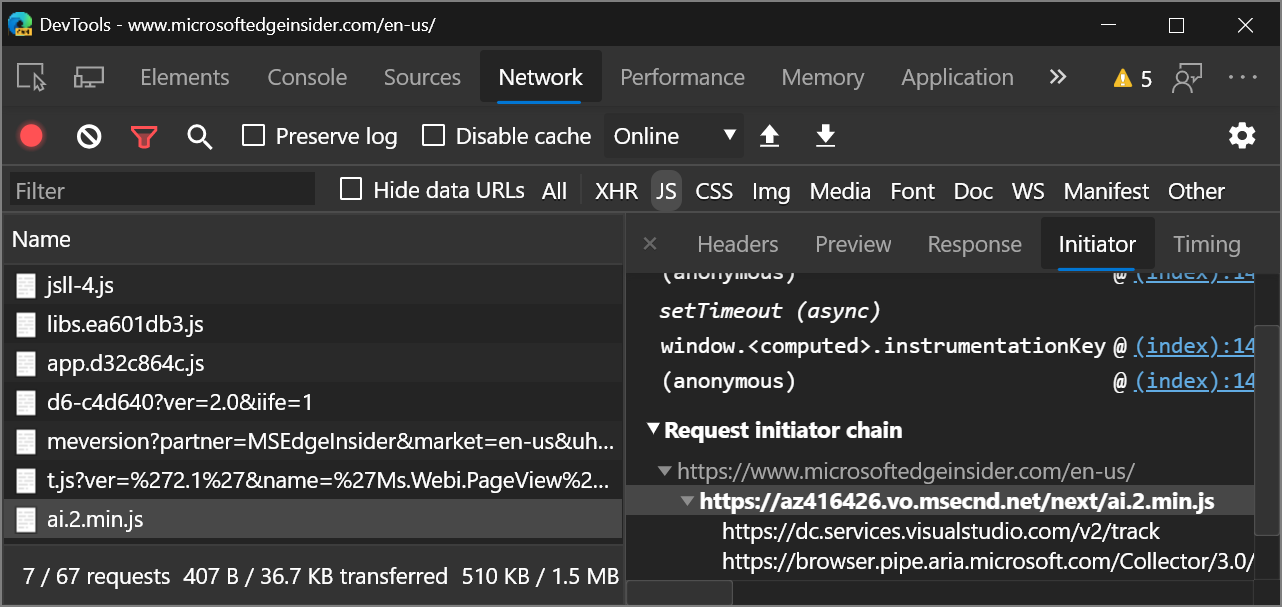
After logging network activity in the Network panel, select a resource and then go to the Initiator panel to view the Request Initiator Chain:
- The inspected resource is bold. In the screenshot above,
ai.2.min.jsis the inspected resource. - The resources above the inspected resource are the initiators. In the screenshot above,
https://www.microsoftedgeinsider.comis the initiator ofai.2.min.js. In other words,https://www.microsoftedgeinsider.comcaused the network request forai.2.min.js. (The screenshot shows an outdated URL. The latest URL ishttps://www.microsoft.com/edge/download/insider.) - The resources below the inspected resource are the dependencies. In the screenshot above,
https://dc.services.visualstudio.com/v2/trackis a dependency ofai.2.min.js. In other words,ai.2.min.jscaused the network request forhttps://dc.services.visualstudio.com/v2/track.
Initiator and dependency information can also be accessed by holding Shift and then hovering over network resources. See Display initiators and dependencies in Network features reference.
Chromium issue #842488
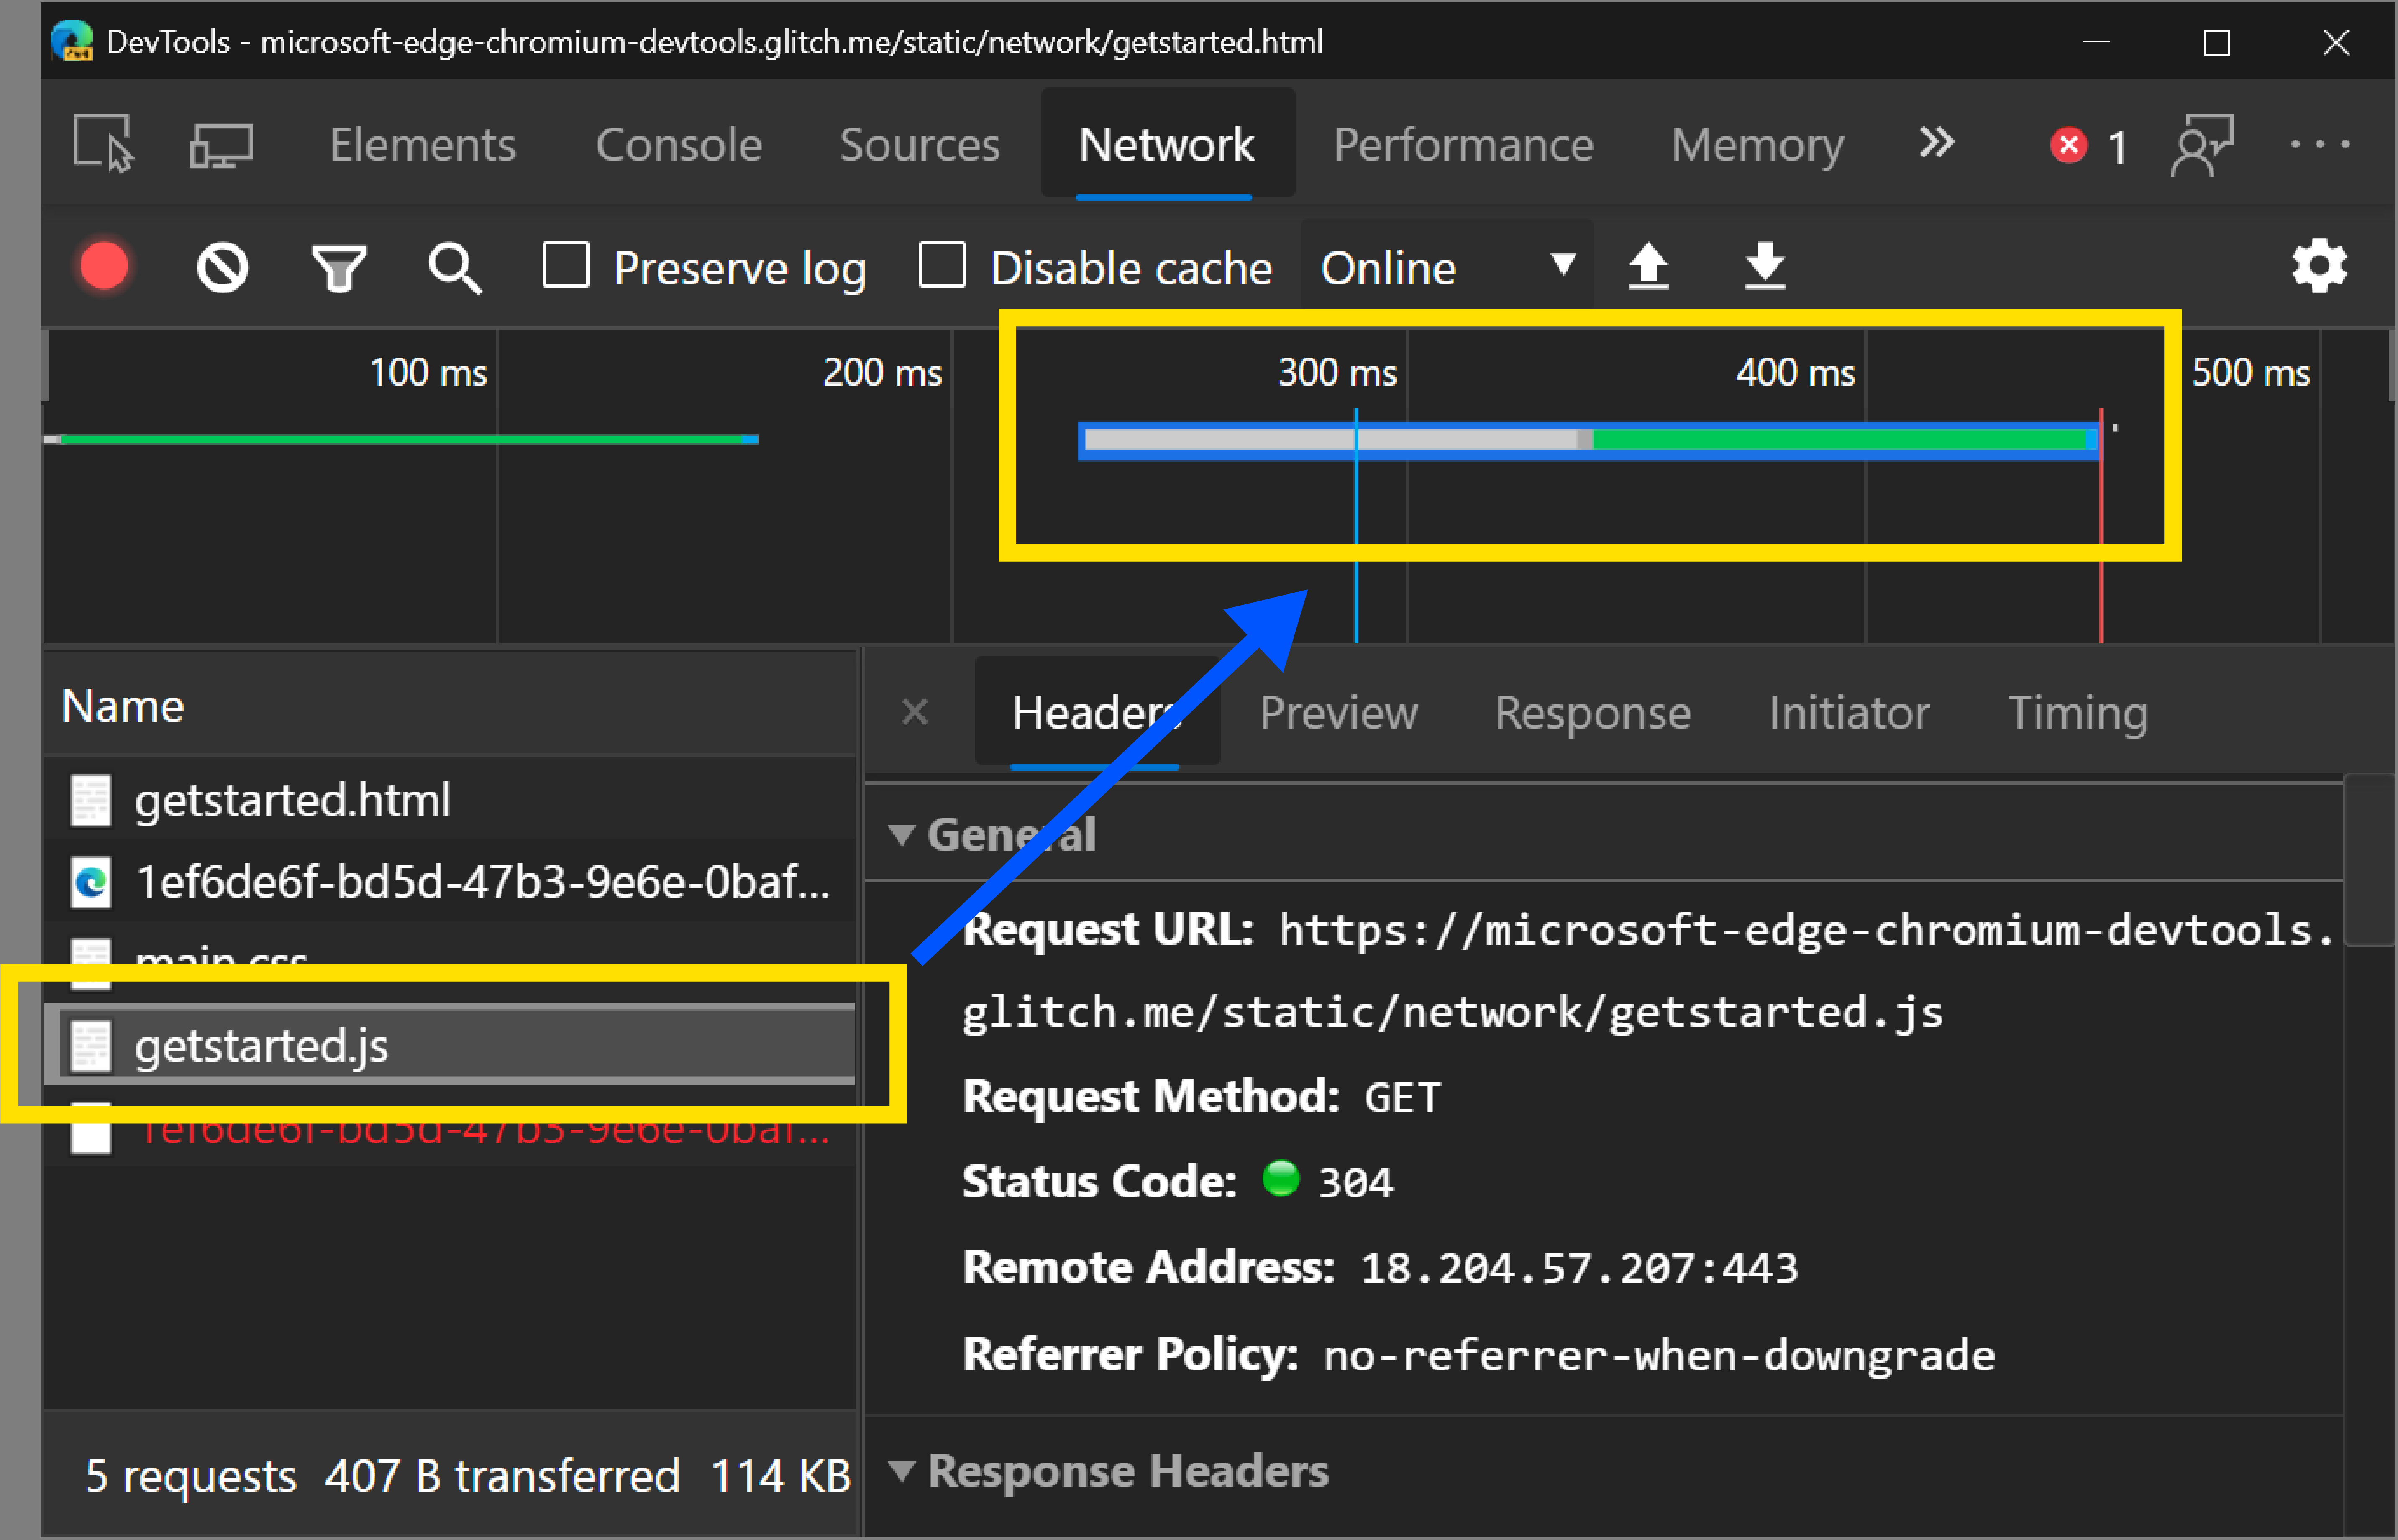
Highlight the selected network request in the Overview
After you select a network resource in order to inspect it, the Network panel now puts a blue border around that resource in the Overview. This can help you detect if the network request is happening earlier or later than expected.
Chromium issue #988253
See Hide the Overview pane in Network features reference.
URL and path columns in the Network panel
Use the new Path and URL columns in the Network tool to display the absolute path or full URL of each network resource.
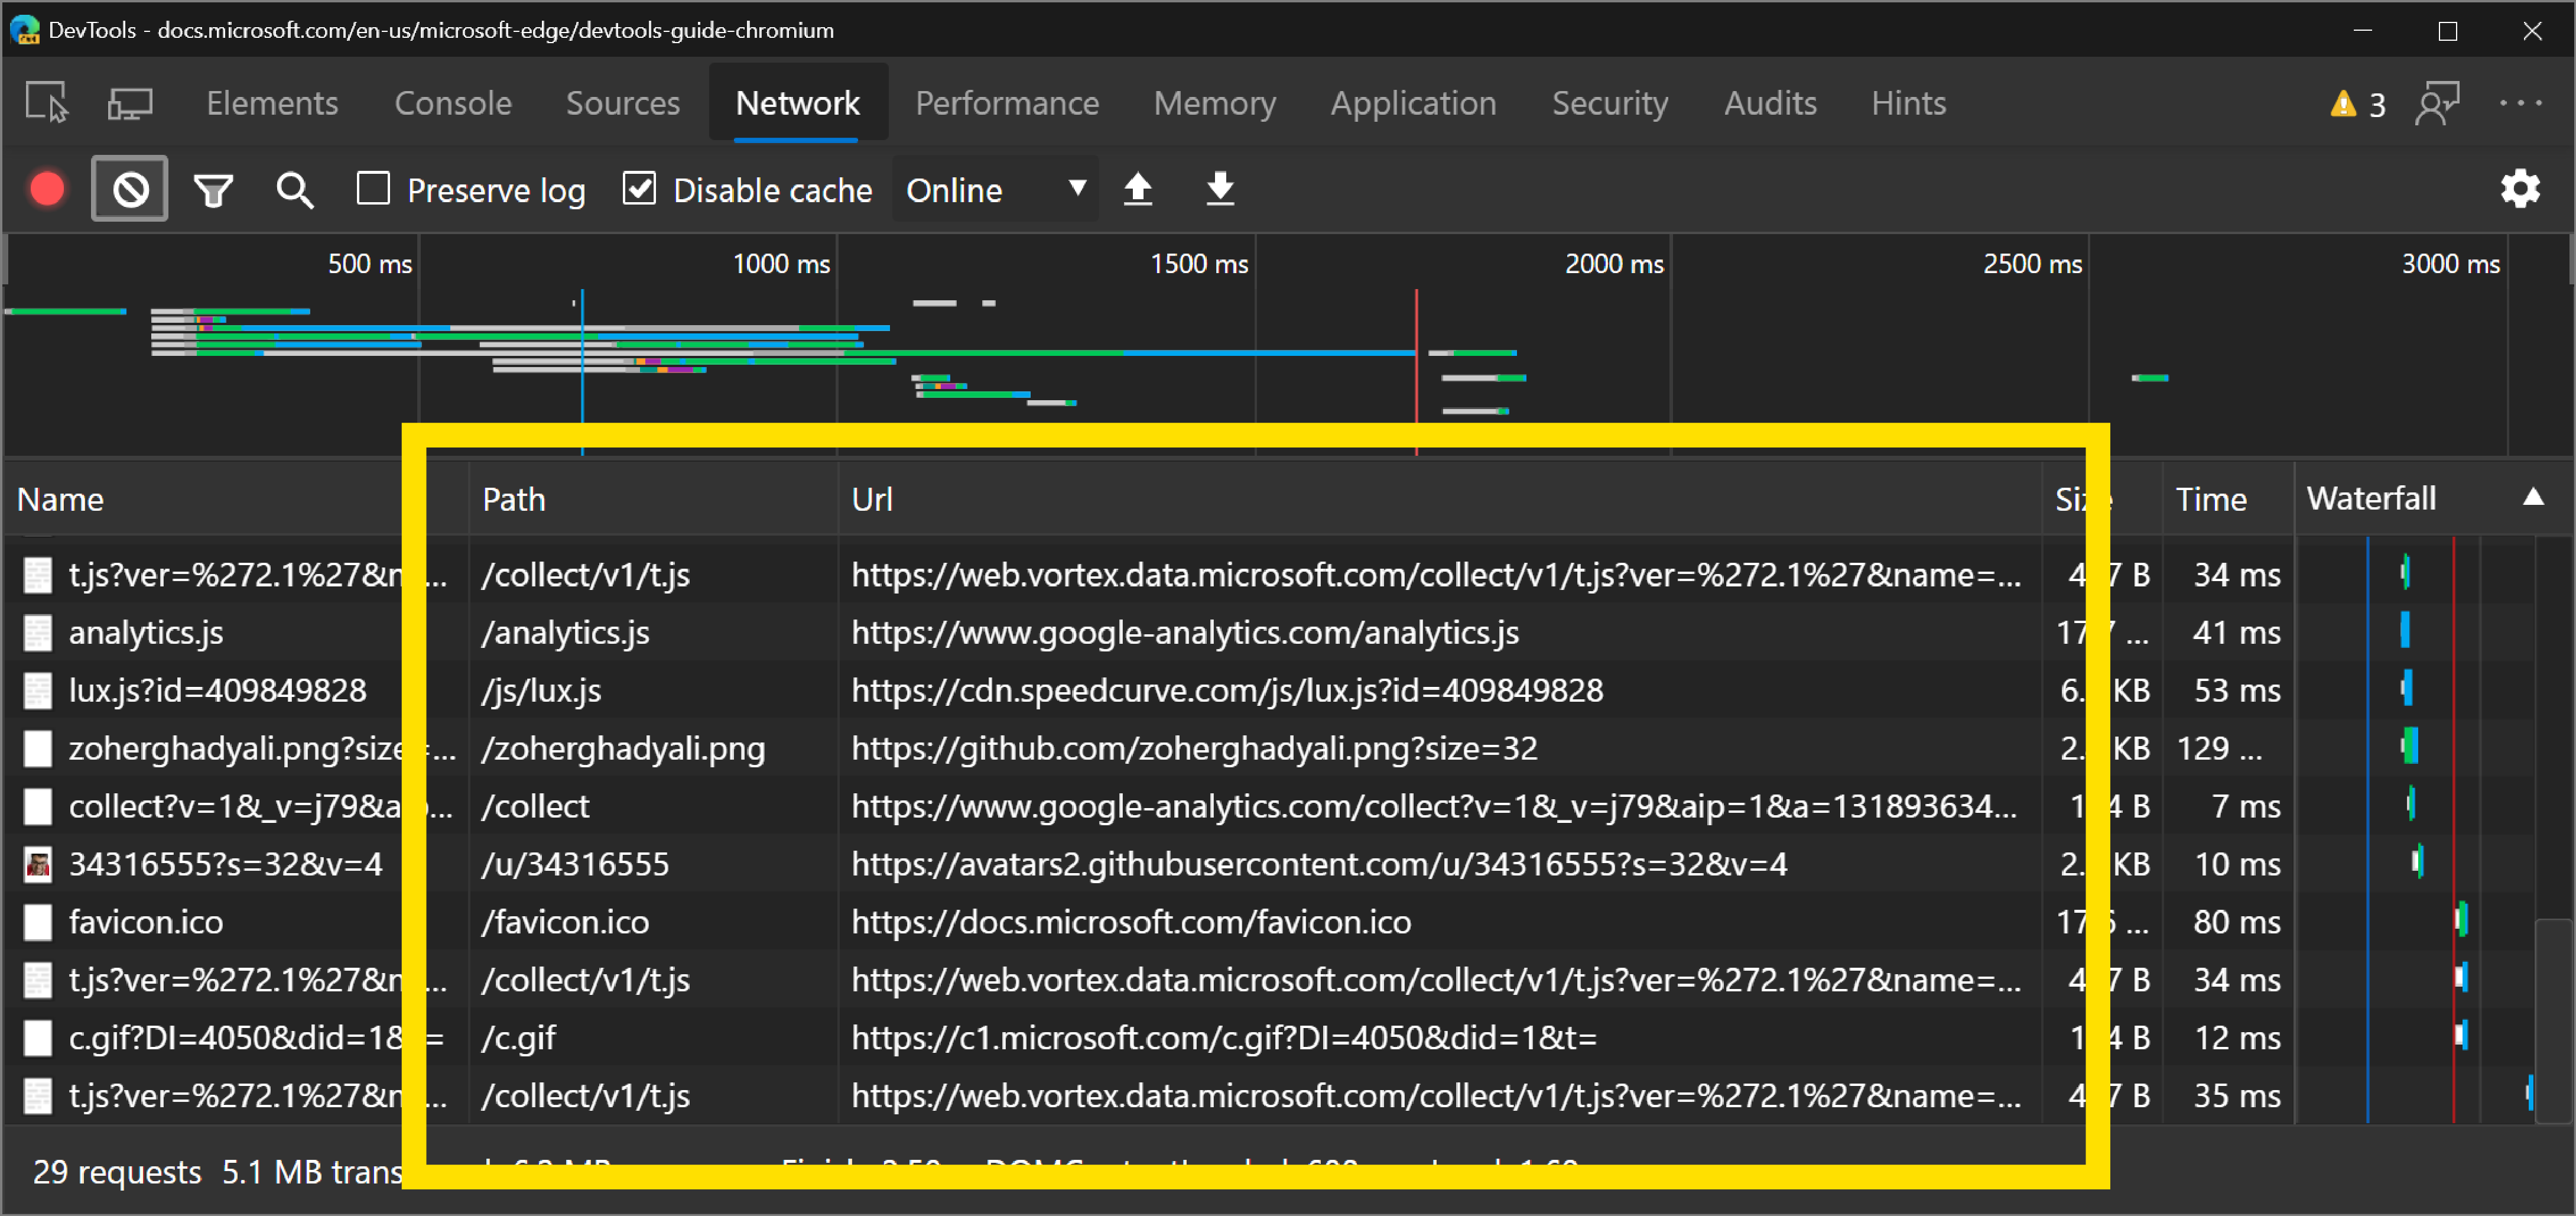
To display the new columns, right-click the Waterfall table header, and then select Path or URL.
Chromium issue #993366
See also:
- Network features reference.
- Sort requests in Network features reference mentions the Waterfall column.
Updated User-Agent strings
DevTools supports setting a custom User-Agent string through the Network Conditions panel. The User-Agent string affects the User-Agent HTTP header attached to network resources, and also the value of navigator.userAgent.
The predefined User-Agent strings have been updated to reflect modern browser versions.

To access Network Conditions, open the Command Menu and run the Show Network Conditions command.
Note
You can also set User-Agent strings in Device Mode.
Chromium issue #1029031
See also:
Audits panel updates
In a later release, the Audits panel was renamed as the Lighthouse panel.
New configuration UI
The configuration UI has a new, responsive design, and the throttling configuration options have been simplified. For more information on the throttling UI changes, see Audits Panel Throttling.

See also:
Coverage tool updates
Per-function or per-block coverage modes
The Coverage tool has a new dropdown menu that lets you specify whether code coverage data should be collected per function or per block. Per block coverage is more detailed but also far more expensive to collect. DevTools uses per function coverage by default now.
Caution
You may notice large code coverage differences in HTML files depending on whether you use per function or per block mode. When using per function mode, inline scripts in HTML files are treated as functions. If the script runs at all, DevTools marks the entire script as used code. If the script doesn't run at all, DevTools marks the script as unused code.

Coverage must now be initiated by a page refresh
Toggling code coverage without a page refresh has been removed because the coverage data was unreliable. For example, a function may be reported as unused if the runtime was a long time ago and the V8 garbage collector has cleaned it up.
Chromium issue #1004203
See also:
Note
Portions of this page are modifications based on work created and shared by Google and used according to terms described in the Creative Commons Attribution 4.0 International License. The original page is found here and is authored by Kayce Basques (Technical Writer, Chrome DevTools & Lighthouse).
![]() This work is licensed under a Creative Commons Attribution 4.0 International License.
This work is licensed under a Creative Commons Attribution 4.0 International License.
Feedback
Coming soon: Throughout 2024 we will be phasing out GitHub Issues as the feedback mechanism for content and replacing it with a new feedback system. For more information see: https://aka.ms/ContentUserFeedback.
Submit and view feedback for