Python でのヒストグラムのプロット
適用対象:![]() SQL Server
SQL Server![]() Azure SQL Database
Azure SQL Database![]() Azure SQL Managed Instance
Azure SQL Managed Instance
この記事では、Python パッケージ pandas'.hist() を使用してデータをプロットする方法について説明します。 SQL データベースは、連続した重複しない値を持つヒストグラム データ間隔を視覚化するために使用されるソースです。
前提条件
サンプル データベースを Azure SQL Managed Instance に復元するための SQL Server Management Studio。
Azure Data Studio。 インストールするには、Azure Data Studio に関するページを参照してください。
この記事で使用されているサンプル データを取得するために、サンプル DW データベースを復元します。
復元されたデータベースの確認
Person.CountryRegion テーブルに対してクエリを実行して、復元されたデータベースが存在することを確認できます。
USE AdventureWorksDW;
SELECT * FROM Person.CountryRegion;
Python パッケージのインストール
Azure Data Studio をダウンロードしてインストールします。
次の Python パッケージをインストールします。
pyodbcpandassqlalchemymatplotlib
これらのパッケージをインストールするには:
- Azure Data Studio ノートブックで、 [パッケージの管理] を選択します。
- [パッケージの管理] ペインで [新規追加] タブを選択します。
- 次の各パッケージについてパッケージ名を入力し、[検索] を選択し、[インストール] を選択します。
ヒストグラムのプロット
ヒストグラムに表示される分散データは、AdventureWorksDW2022 からの SQL クエリに基づいています。 ヒストグラムは、データとデータ値の頻度を視覚化します。
接続文字列変数 'server'、'database'、'username'、および 'password' を編集して、SQL Server データベースに接続します。
新しいノートブックを作成するには:
- Azure Data Studio で [ファイル] を選択し、 [新しいノートブック] を選択します。
- ノートブックで、カーネル [Python3] を選択し、 [+ コード] を選択します。
- ノートブックにコードを貼り付け、 [すべて実行] を選択します。
import pyodbc
import pandas as pd
import matplotlib
import sqlalchemy
from sqlalchemy import create_engine
matplotlib.use('TkAgg', force=True)
from matplotlib import pyplot as plt
# Some other example server values are
# server = 'localhost\sqlexpress' # for a named instance
# server = 'myserver,port' # to specify an alternate port
server = 'servername'
database = 'AdventureWorksDW2022'
username = 'yourusername'
password = 'databasename'
url = 'mssql+pyodbc://{user}:{passwd}@{host}:{port}/{db}?driver=SQL+Server'.format(user=username, passwd=password, host=server, port=port, db=database)
engine = create_engine(url)
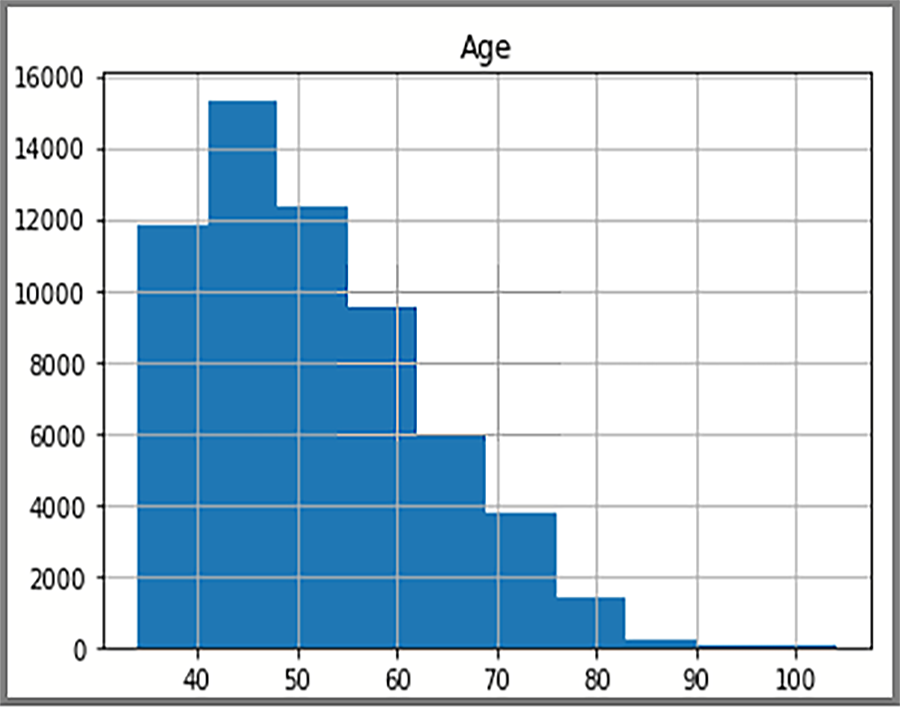
sql = "SELECT DATEDIFF(year, c.BirthDate, GETDATE()) AS Age FROM [dbo].[FactInternetSales] s INNER JOIN dbo.DimCustomer c ON s.CustomerKey = c.CustomerKey"
df = pd.read_sql(sql, engine)
df.hist(bins=50)
plt.show()
表示には、FactInternetSales テーブル内の顧客の年齢分布が表示されます。
フィードバック
以下は間もなく提供いたします。2024 年を通じて、コンテンツのフィードバック メカニズムとして GitHub の issue を段階的に廃止し、新しいフィードバック システムに置き換えます。 詳細については、「https://aka.ms/ContentUserFeedback」を参照してください。
フィードバックの送信と表示