Understand disk performance characteristics
Application performance often depends on how quickly the application can read and write data. To understand how to improve application performance, you must first understand how performance is measured and the settings and choices that affect it.
Disk performance characteristics
To choose the right disk type, it's important that you understand the performance indicators. The following indicators express performance:
- IOPS: IOPS is the number of requests that your application sends to the disks in one second. IOPS directly affects your application performance. Some applications, like retail websites, need high IOPS to manage all the small and random input/output (I/O) requests that must be processed quickly to keep the site responsive. Higher performance disks have higher IOPS values.
- Throughput: Throughput is the amount of data that your application sends to the disks in a specified interval. Throughput is also called data transfer rate and is measured in MB/s. If your application is performing I/O with large blocks of data, it requires high throughput. Higher performance disks have higher throughput.
- Latency: Latency expresses the time it takes your app to send a request to the disk and receive a response. Latency puts a limit on effective IOPS. For example, (with a queue depth of 1) if your disk can handle 5,000 IOPS but each operation takes 10 ms to process, your app will be capped at 100 operations per second because of the processing time. The latency is significantly improved if you enable ReadOnly host caching.
IOPS vs. throughput
Throughput and IOPS have a direct relationship. Changing one directly affects the other. To get a theoretical limit of throughput, you can use the following formula: IOPS × I/O size = throughput. It's important to consider both these values when you plan your application.
For Ultra disks and Premium SSD v2 managed disks, it works a little differently since you can independently adjust the disk size, IOPS, and throughput. Adjustments to IOPS or throughput for Ultra disks and Premium SSD v2 managed disks can be done at runtime, without detaching the disk from the VM.
Ultra disk IOPS
Ultra disks support IOPS limits of 300 IOPS/GiB, up to a maximum of 160,000 IOPS per disk. To achieve the target IOPS for the disk, ensure that the selected disk IOPS are less than the VM IOPS limit.
The current maximum limit for IOPS for a single VM in generally available sizes is 160,000. Ultra disks with greater IOPS can be used as shared disks to support multiple VMs.
The minimum guaranteed IOPS per disk are 1 IOPS/GiB, with an overall baseline minimum of 100 IOPS. For example, if you provisioned a 4-GiB ultra disk, the minimum IOPS for that disk is 100, instead of four.
Ultra disk throughput
The throughput limit of a single ultra disk is 256-KiB/s for each provisioned IOPS, up to a maximum of 4000 MB/s per disk (where MB/s = 10^6 Bytes per second). The minimum guaranteed throughput per disk is 4KiB/s for each provisioned IOPS, with an overall baseline minimum of 1 MB/s.
Premium SSD v2 IOPS
All Premium SSD v2 disks have a baseline IOPS of 3000 that is free of charge. After 6 GiB, the maximum IOPS a disk can have increases at a rate of 500 per GiB, up to 80,000 IOPS. So an 8 GiB disk can have up to 4,000 IOPS, and a 10 GiB can have up to 5,000 IOPS. To be able to set 80,000 IOPS on a disk, that disk must have at least 160 GiBs. Increasing your IOPS beyond 3000 increases the price of your disk.
Premium SSD v2 throughput
All Premium SSD v2 disks have a baseline throughput of 125 MB/s, that is free of charge. After 6 GiB, the maximum throughput that can be set increases by 0.25 MB/s per set IOPS. If a disk has 3,000 IOPS, the max throughput it can set is 750 MB/s. To raise the throughput for this disk beyond 750 MB/s, its IOPS must be increased. For example, if you increased the IOPS to 4,000, then the max throughput that can be set is 1,000. 1,200 MB/s is the maximum throughput supported for disks that have 5,000 IOPS or more. Increasing your throughput beyond 125 MB/s increases the price of your disk.
Virtual machine I/O capping
Now that you know which disks are available in Azure, you need to match each of your VMs with the correct disk type. VMs have their own storage IOPS limits, which can affect the overall application performance when combined with the disk IOPS.
If you don't size the VM correctly for the storage performance an application requires, the VM itself becomes a bottleneck.
For example, suppose your application makes a request that requires 15,000 IOPS. You've provisioned a Standard_D8s_v3 VM, with one P30 OS disk and two Premium SSD data disks with P40 SKU. Each data disk can handle 7,500 IOPS and eventually can meet the demand of the applications, but the VM itself has a maximum limit of 12,800 IOPS, which is the actual IOPS that the application will get. The following figure illustrates this example.
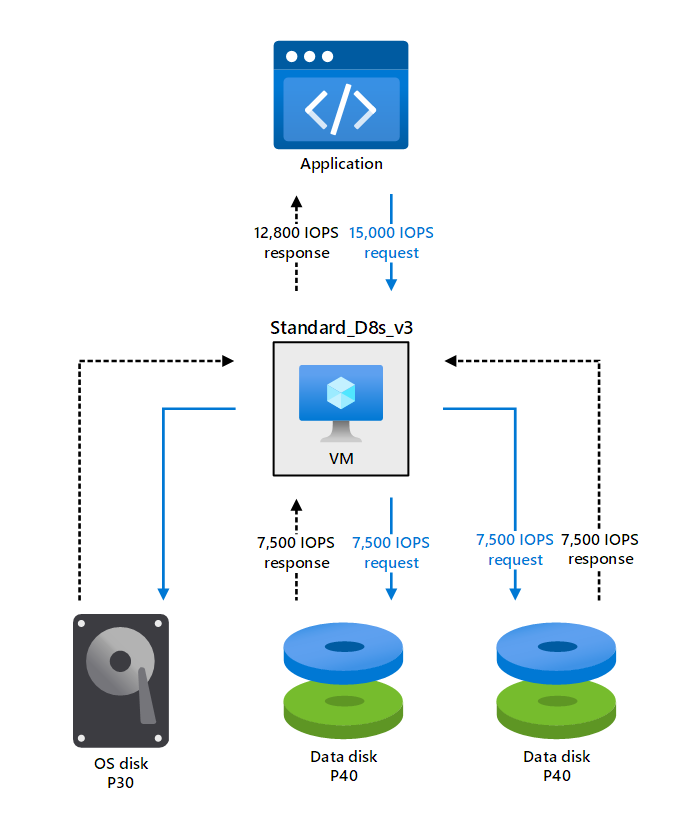
The scenario illustrated in the preceding example is known as VM I/O capping. In this scenario, the application is requesting an amount of throughput and IOPS that the disk can manage, but the VM can't accommodate these requirements.
You can diagnose the performance issues caused by VM I/O capping by using the following metrics:
- VM cached IOPS consumed percentage
- VM cached bandwidth consumed percentage
- VM uncached IOPS consumed percentage
- VM uncached bandwidth consumed percentage
Disk I/O capping
You might come across other situations in which the storage solution doesn't meet the application demands. However, the bottleneck might be caused if you select the incorrect performance tier for the disks.
Consider the same example in which the application requires 15,000 IOPS from the VM, and you've chosen the following setup:
- Standard D16s_v4 with 25,600 IOPS
- P20 OS disk with 2,300 IOPS
- Two P30 data disks, each with support of 5,000 IOPS
In this scenario, the application's demand will be divided into three different requests:
- 2,300 IOPS are requested from the OS disk
- 5,000 IOPS are requested from each data disk
The total IOPS that VM will return to the application will be 12,300 as a sum of each IOPS provided by the OS and data disks.
This scenario is known as disk I/O capping, when the disk itself can't meet the application demands.

To diagnose disk I/O capping, use the following metrics:
- Data disk IOPS consumed percentage
- Data disk bandwidth consumed percentage
- OS disk IOPS consumed percentage
- OS disk bandwidth consumed percentage
Disk caching
A cache is a specialized component that stores data, typically in memory, so that the application can access the data more quickly. The data in a cache often is data that's been read previously or data that resulted from a previous calculation. The goal is that applications access data faster from the cache than from the disk. Disk caching isn't available on Ultra Disks and Premium SSD v2.
Caching uses specialized, and sometimes expensive, temporary storage that has faster read and write performance compared to permanent storage. Because cache storage is often limited, you might need to decide which data operations will benefit most from caching. But even when the cache can be made widely available, such as in Azure, it's still important to know the workload patterns of each disk before you decide which caching type to use.
Read caching tries to speed up data retrieval. Instead of reading from permanent storage, the application reads the data from the faster cache.
It's important to note that read caching helps when there's some predictability to the read queue, such as a set of sequential reads. For random I/O, in which the data you're accessing is scattered across storage, caching will be of little or no benefit and can even reduce disk performance.
Write caching tries to speed up writing data to persistent storage. By using a write cache, the app can consider the data that should be saved.
In reality, when you use write caching, data is queued in a cache, waiting to be written to a disk. As you can imagine, this mechanism can be a potential point of failure, such as when a system shuts down before the cached data is written. Some systems, such as SQL Server, manage the task of writing cached data to persistent disk storage themselves.
Cached and uncached limits of VMs
Now that you understand how caching might improve the performance for reading or writing data on the disk, you should be aware of how caching affects VM performance.
The performance of the VM depends on the IOPS and throughput limits that are imposed based on VM size. All VMs in the Premium tier have different limits for IOPS and throughput based on cached and uncached configurations. You can improve the performance of the VM to meet the higher demand for IOPS and throughput by enabling VM host caching.
The following table lists examples that illustrate the difference in performance for cached and uncached disk throughput and bandwidth.
| VM size name | Max cached and temp storage throughput: IOPS/MB/s (cache size in GiB) | Max uncached disk throughput IOPS/MB/s |
|---|---|---|
| Standard_D2s_v3 | 4,000/32 (50) | 3,200/48 |
| Standard_D4s_v3 | 8,000/64 (100) | 6,400/96 |
| Standard_D8s_v3 | 16,000/128 (200) | 12,800/192 |
| Standard_D64s_v3 | 128,000/1,024 (1,600) | 80,000/1,200 |
Host caching can help you avoid VM bottleneck scenarios.
In the earlier example of VM I/O capping, the application required 15,000 IOPS. Both data disks can handle that demand, but the Standard_D8s_v3 VM can offer only 12,800 IOPS in the uncached state.
If you configure host caching on the Standard_D8s_v3 VM, you can get 16,000 cached IOPS, which is more than the application demands.