Set up loss prevention
The loss prevention capability in Microsoft Dynamics 365 Fraud Protection uses adaptive artificial intelligence (AI) to generate risk scores, and to identify data anomalies and patterns in historical transaction data. You can then use these risk scores, anomalies, and patterns to generate reports that provide a detailed trend analysis, based on the return rate, the discount rate, and other key performance indicators (KPIs) that might indicate in-store fraud.
Identifying fraudulent activity
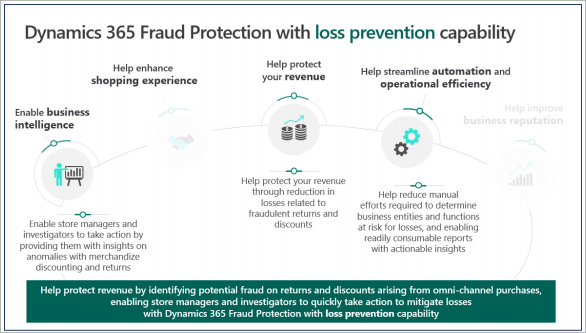
The loss prevention capability is designed to help loss prevention analysts, store managers, and loss prevention investigators identify fraudulent activity that typically involves discounts, returns, price overrides, voided transactions, gift card redemption, and so on, that employees improperly apply on point of sale (POS) terminals.
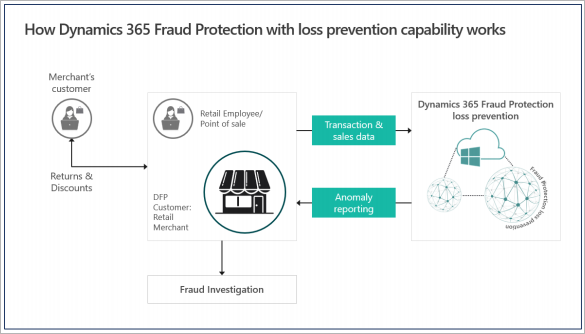
Loss prevention is based on anomaly detection that looks for patterns in POS data that is ingested into the system. It identifies outliers through unsupervised machine learning (ML), and provides a list of anomalous terminals, anomalous actors, and anomalous products. Store managers, loss prevention analysts, and loss prevention fraud investigators can then use this list to focus on specific areas that might represent fraud.
Loss prevention can help you drive down the cost and complexity that are associated with the process of taking huge amounts of data, analyzing it for fraud patterns, and gaining actionable insights from it. Therefore, you can quickly identify your areas of risk, such as the store, terminal, shift, and/or which employee that might be misusing your return and discount policies.
Goals for this document
The purpose of this document is to guide you through the following activities:
- Step 1: Prepare your historical data. This activity is also known as data mapping.
- Step 2: Upload data and generate a loss prevention report.
- Step 3: Analyze data in a loss prevention report.
After you complete these steps in your own system by using your own data, you will have: an actionable loss prevention report. You will also be able to run loss prevention reports on a regular basis.
Prerequisites
Before you begin the tasks in this document, you must:
- Set up Fraud Protection in a Microsoft Entra tenant, as described in Set up a trial instance.
Step 1: Prepare your historical data (data mapping)
When Fraud Protection assesses a transaction for potential purchase fraud, it uses a combination of AI, ML, and a data consortium. A vast amount of data powers the models that are used for assessment. Any data that is transmitted into the system for assessment or system learning must conform to a predefined schema. In the world of AI and ML, it's generally understood that the quality of the data that a model uses affects the quality of the results.
Data mapping is a process that helps ensure that the correct values are assigned to the correct schema fields, and that your commerce system is correctly integrated with Fraud Protection. For more information about schemas, see Data schemas for loss prevention.
Schema guidance for data upload
- The files are in CSV UTF-8 (comma, semi-colon, or tab-delimited) format (*.csv or *.tsv).
- The maximum file size is 10 gigabytes (GB).
- The following characters are escaped in all columns: commas/semi-colons, new line characters, and multiline characters.
- 'datetime' columns are in ISO 8601 format. For example, in C# DateTime.UtcNow.ToString("o") would have the format "2019-03-14T20:18:11.254Z".
- 'double' (decimal) column precision is two decimal places.
For more information about schemas you can use to generate models and determine risk assessments, see Data schemas for loss prevention.
Required data entities for data mapping
Because the loss prevention capability identifies anomalies and patterns that might indicate in-store fraud, the ML model requires data from four entities to search for anomalies:
- Transactions
- Sales
- Payments
- PaymentMethods
For detailed information about schemas that define the data that is used to generate models and determine risk assessments, see Data schemas for loss prevention. Although all data fields are important, you can start with fewer mandatory fields and then onboard additional fields over time to improve model output.
Important
The data that is used to analyze loss is sensitive, and you should take care to upload it only from a secure network location. Be aware that Microsoft requests only partial data about payment instruments (the bank identification number [BIN] and the last four digits). We don't request the full payment instrument number or Social Security number (SSN). Therefore, don't include this type of data in the files that you upload. For more information about how data is used and protected in Fraud Protection, see Security, compliance, and data subject requests.
What to do if you can't map all your data
Fraud Protection uses a broad set of data entities, and sometimes data might be missing, or it can't be mapped cleanly to a field. Microsoft has found that the following factors can cause data quality issues:
- Attributes are unavailable.
- Attributes are available, but they either aren't set or are incorrectly set.
- The schema is incorrectly interpreted.
- Data is incorrect, and/or enumeration values are incorrect.
- There is a mismatch on the same attributes.
- There is a data encryption issue.
Microsoft encourages you to try to map as many data fields as possible. However, keep the following points in mind if some fields can't be mapped:
- You can repeat data uploads as needed to improve the information that the system has access to.
- To successfully generate a report for analysis purposes, you must have at least one month of transaction data.
Connect, disconnect, and reconnect to Fraud Protection
There are two ways to upload historical data into Fraud Protection for loss prevention:
- Use the D365 Connector to connect to the Dynamics 365 Commerce system and upload the data directly.
- Upload data files in CSV format.
Choose the data connection method that is appropriate for your situation.

To connect loss prevention to Commerce, you must complete a series of one-time setup activities. After these activities are completed, you can easily disconnect and reconnect the systems. For more information, see Connect loss prevention to data from Commerce.
To connect your retail data to Fraud Protection, make sure that you have all three of the following prerequisites:
- Access to the retail data lake.
- Access to your finance and operations environment.
- A Fraud Protection license (trial or activated subscription).
Connect loss prevention to data from Commerce
- In Commerce, open the dashboard and enter System Parameters in the search field at the top of the page.
- On the System parameters page, select the Data connection tab.
- Set the Enable Data Lake integration option to Yes.
- Save the details of the data lake (the value of the DNS name field). You will need this information to reconnect if the data lake integration is ever disconnected.

Return to the dashboard and enter Entity Store in the search field at the top of the page.
(An entity store is a collection of tables/view that have retail data in raw or aggregate form.)
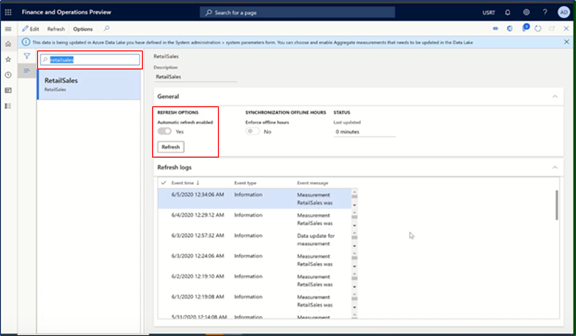
In the entity store, enter RetailSales in the search field.
Under Refresh options, set the Automatic refresh enabled option to Yes.
Automatic refresh incrementally adds the most recent data from POS devices to the retail data lake.
Return to the dashboard and select the Feature management tile.
In the Feature management workspace, find the Dynamics 365 Fraud Protection (DFP) Loss Prevention feature, and enable it.
Register the Fraud Protection app ID in the dashboard:
Open the Microsoft Entra applications page.
Create an entry for the first-party app ID for Fraud Protection. (For example, bf04bdab-e06f44f3-9821-d3af64fc93a9.)
In the User ID field, select RetailServiceAccount.
This setting authorizes Fraud Protection to access data from the data lake.
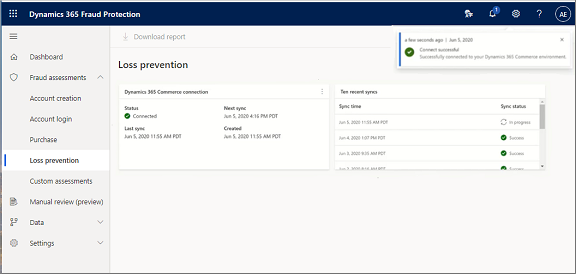
Open the Fraud Protection portal and connect your Finance and Operations environment to your Fraud Protection environment by using the URL for your Commerce environment.
In the following screenshot, the connection was successful, and the process of syncing to acquire data from Commerce and generate a loss prevention report has started.
Disconnect from and reconnect to Commerce
After you've made the initial connection between Commerce and Fraud Protection, you can easily disconnect and reconnect.
Disconnect from Commerce
Select the three dots in the upper-right corner of the Dynamics 365 Commerce connection pane, and then select Disconnect.
Select Continue to disconnect.
The data lake that was originally connected to this Fraud Protection loss prevention capability is disconnected.
Reconnect to Commerce
- Select Connect to data.
- Enter the details that were created for the Commerce environment (data lake) during the initial setup. (See step 4 in the Connect loss prevention to data from Commerce section earlier in this document.)
- Select Connect.
When the connection is successful, the process of syncing to acquire the data and update the reports immediately starts again.
Step 2: Upload data and generate a loss prevention report
When you sign in to your Fraud Protection portal, if Loss prevention appears in the left navigation pane, the loss prevention capability is enabled.
In the left navigation, select Loss prevention, and then select Go to Data Upload.
Select the Loss prevention tab, and then select the Loss prevention button.
Loss prevention capabilities specifically focus on analyzing loss associated with returns and discounts. It requires four types of data sets from sales terminals:
- Transactions
- Sales
- Payments
- Payment methods
Note
The data must be in .CVS format and must follow the schema that is provided in Data schemas for loss prevention.
To upload your data files:
In the left navigation, select Data, select Data upload, and then select Loss prevention.
Select Select data source, select the type of file you want to upload (a .csv or .tst file), and then select Browse.
Select the file you want to upload, select Open, and then select Next.
The Data upload > Payments page displays a preview of your data.
In the top navigation, select Save and close.
Repeat steps 2 through 4 to upload all four types of data.
After you've uploaded all your data files, select Process loss prevention data.
Fraud Protection begins processing your data and building your loss prevention report.
In the left navigation, select Loss prevention to see the status of your loss prevention report.
Note
Typically, loss prevention takes about 30 to 60 minutes to generate a report package. However, the actual length of time depends on the amount of data that was provided.
Your report displays in the Loss prevention page. To download a copy, select Download report.
Step 3: Analyze data in a loss prevention report
When Fraud Protection has a data source, you can generate loss prevention reports as required. Depending on how you configured your environment, you can generate reports from either a direct connection to a Commerce system or from uploaded data files.
In the previous step, you ran your first loss prevention report. In this step, you use the findings on the report to identify return and discount anomalies, and then run additional loss prevention reports as new data becomes available.
You can review the following information in the report displayed on the Loss prevention page.
Revenue opportunity based on staff data
In the following screenshot, you can review information based on the risk score of 560 and above.
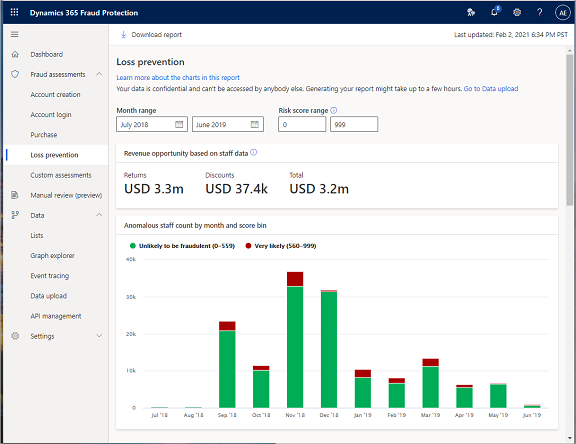
You can set the range of months for which you want to analyze the data in the Month range fields. You can set the risk score range in the Risk score range field.
- To view the full range of risk score distribution, set the "from" value to 0 (zero) and the "to" value to 999.
- To drill deeper into possible fraudulent activities, keep the score range high.
In the Risk score range fields, you can set the risk score range.
- To drill deeper into possible fraudulent activities, adjust the values of the Risk score range fields so that they span only a high score range, for example, 900 through 999.
The Revenue opportunity based on staff data pane provides a summary of the total dollar amount of the potential fraud that Fraud Protection has detected in returns and discounts, and that could contribute to overall revenue gain.
The Anomalous staff count by month and score bin chart shows anomalous staff and terminal count distribution per month during the month range that you selected in the Month range fields at the top of the page.
Revenue opportunity based on terminal data
In the following screenshot you can review information based on the risk score 760 and above.
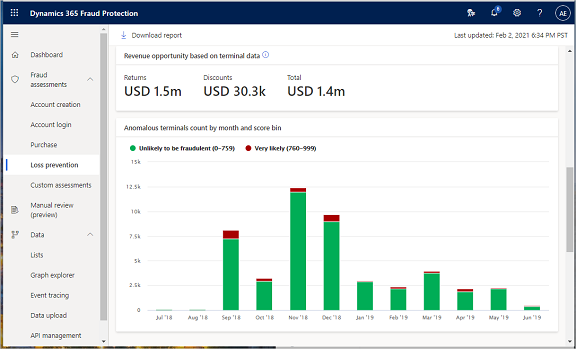
The Revenue opportunity based on terminal data pane provides a summary of the returns, discounts and total.
The Anomalous terminals count by month and score bin shows a monthly count of terminals that are very likely and unlikely to be fraudulent.
If you want to better understand how a specific terminal has been working, a useful tool is trend analysis that compares the score of a specific terminal to the score of the whole population.
When you hover over a specific data point in the chart, the terminal's risk score and the average risk score of the whole population are shown. In the following example, the sawtooth pattern is a good representation of the fact that this terminal has been moving back and forth in terms of anomalous behavior.
The model uses five or six default events to generate the risk score. It considers the return ratio, which is the total number of returns that employees have initiated at a specific terminal, divided by the total number of sales at that terminal during a given period. It also considers the cash-to-card ratio and the number of employee-discounted purchases where multiple payment cards were used. Finally, it considers the ratio of returns without a receipt to returns with a receipt, and the number of discounted items that were sold without a discount.
Top risk staff
- To view data on top risk staff, select the Staff tab.
The following screenshot shows information that includes the staff which were at or above the threshold 560 for at least one month. The data set is sorted to show the staff, based on the risk score that the models have generated.
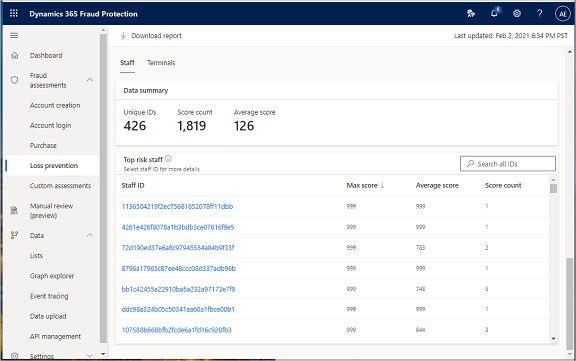
The Data summary section provides a summary of the staff assessment. It shows the total number of unique staff IDs, the score count (number of times that the unique staffers were anomalous during the reporting data period), and the average risk score on a scale of 0 (zero) through 999.
- To search for data related to a specific staff member, enter a staff ID in the search field.
The Top risk staff grid lists all staff IDs that the model has analyzed. The list is sorted in descending order of risk score (that is, the highest-risk staff member appears at the top of the list). The grid also shows the average score for each staff member and the number of times that each staff member was deemed anomalous during the full data period that was assessed for the report.
The Score count indicates the number of months they were above the threshold. For example, if 12 months' worth of data was used to generate the report, a Score count value of 3 for a staff member indicates that the staff member was deemed anomalous for three of the 12 months.
- To see more details about a specific staff member, select an ID in the Staff ID column.
Staff's risk score summary
- To view the risk score of a specific staff, select a Staff ID.
The following screenshot shows information that includes the staff which were at or above the threshold 560 for at least one month. The data set is sorted to show the staff, based on the risk score that the models have generated.

- In the Month range fields, set the range of months for which you want to analyze the data.
- In the Risk score range fields, set the risk score range. To drill deeper into possible fraudulent activities, keep the score range high.
The Risk score by month chart indicates the likelihood that the events associated with the staff are fraudulent. Risk score ranges from 0-559 are unlikely to be fraudulent and 560-999 are very likely to be fraudulent. The chart shows the risk score associated with the selected staff member compared to the average risk score of the entire staff.
The All reasons affecting risk score by percentile lists the specific reasons that affect the risk score, ranked by the percentile. Significant percentiles are highlighted in the grid.
Reason Details
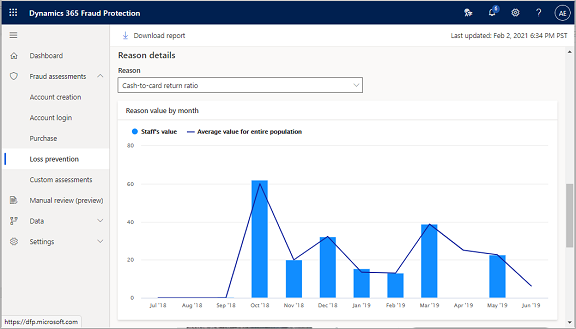
- To review reason details and further analyze the impact of that reason on the risk score, select one of the five reasons from the Reason drop-down list.
The Reason value by month chart shows you details for the reason or event that you selected.
Top risk terminals
- To view data on top risk terminals, select the Terminals tab.
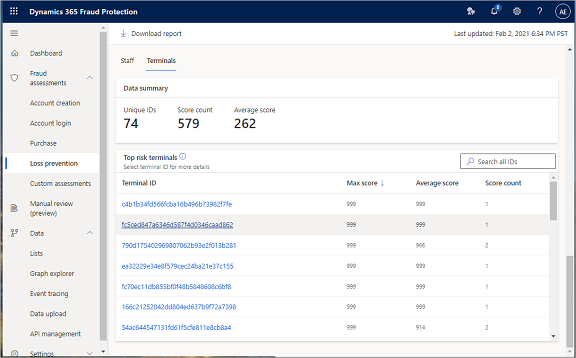
This screenshot shows information that includes the top risk terminals which were at or above the threshold 760 for at least one month.
- In the Month range fields, set the range of months for which you want to analyze the data.
- In the Risk score range fields, set the risk score range. To drill deeper into possible fraudulent activities, keep the score range high.
The Data summary section provides a summary of the terminal assessment. It shows the total number of unique terminal IDs that the model has analyzed, the number of times that the unique terminals were anomalous during the reporting data period, and the average risk score on a scale of 0 (zero) through 999.
- To search for data related to a specific terminal, enter a terminal ID in the search field.
The Top risk terminals grid lists all terminal IDs. The highest-risk terminal appears at the top of the list. The grid also shows the average score for each terminal and the number of times that each terminal was deemed anomalous during the full data period that was assessed for the report.
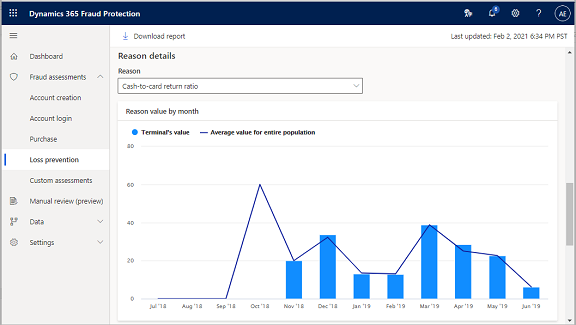
Reason Details
- To review reason details and further analyze the impact of that reason on the risk score, select one of the five reasons from the Reason drop-down list.
The Reason value by month chart shows you details for the reason or event that you selected.
Terminal's risk score summary
To better understand how a specific terminal has been working, a useful tool is trend analysis that compares the score of a specific terminal to the score of the whole population. The example chart in the following screenshot shows the variation in risk score by month.
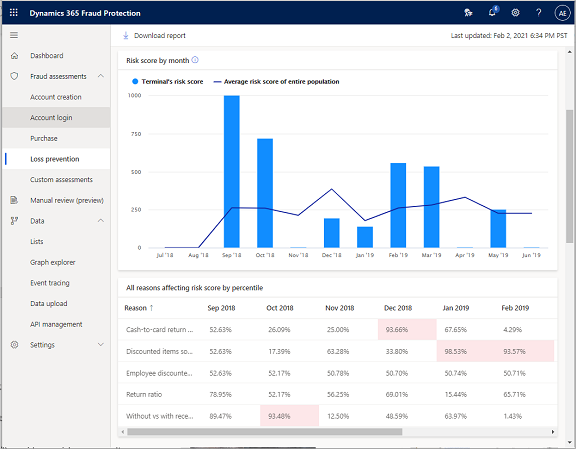
The Terminal's risk score summary section shows the maximum score, the average score, and the number of times that this specific store or terminal has been anomalous.
When you hover over a specific data point in the chart, the terminal's risk score and the average risk score of the whole population are shown. In the following example, the sawtooth pattern is a good representation of the fact that this terminal has been moving back and forth in terms of anomalous behavior.
The model uses five or six default events to generate the risk score. It considers the return ratio, which is the total number of returns that employees have initiated at a specific terminal, divided by the total number of sales at that terminal during a given period. It also considers the cash-to-card ratio and the number of employee-discounted purchases where multiple payment cards were used. Finally, it considers the ratio of returns without a receipt to returns with a receipt, and the number of discounted items that were sold without a discount.
Terminal's reasons summary
To understand how each event or reason affected the risk scores, review the following information on the report.
The grid in the All reasons affecting the score by percentile section lists the specific reasons that affect the risk score, ranked by the percentile. Significant percentiles are highlighted.
In the Reason field in the Reason details section, you can select any of the five reasons from the All reasons affecting the score by percentile grid to further analyze the impact of that reason on the risk score.
The Reason details chart shows the value by month for the reason or event that you selected in the Reason field.
Transactions (last six months)
The Transactions (last six months) section of the report shows specific transactions that have occurred at the terminal during the last six months.

As the column headings for the grid show, the data in the grid includes the date of the transaction according to the receipt, the transaction ID, the staff ID, the purchase amount, the discount amount, the return amount, an indication of whether a return receipt was present, the payment method, and the category.
If a staff member associated with a transaction is tagged as anomalous by the model, a red caution sign appears next to their staff ID in the grid. This caution sign identifies the staff member as a high risk.
Note for existing Commerce customers
If you're an existing Commerce customer, all the mandatory fields have a NOT NULL constraint in the data type. For a schema reference, see Data schemas for loss prevention in Dynamics 365 Fraud Protection. However, you can also configure Commerce to share data directly with Fraud Protection.
For information about how to integrate Commerce with Fraud Connection and connect to Fraud Protection, see the Connect loss prevention to data from Commerce section earlier in this document. There is no prerequisite schema work for loss prevention.
Congratulations! You've successfully completed the training and are ready to use your free trial of Fraud Protection's loss prevention capabilities.
Next steps
For information about how to access and use Fraud Protection's features, see the following documents:
Opinia
Dostępne już wkrótce: W 2024 r. będziemy stopniowo wycofywać zgłoszenia z serwisu GitHub jako mechanizm przesyłania opinii na temat zawartości i zastępować go nowym systemem opinii. Aby uzyskać więcej informacji, sprawdź: https://aka.ms/ContentUserFeedback.
Prześlij i wyświetl opinię dla