Events
May 19, 6 PM - May 23, 12 AM
Calling all developers, creators, and AI innovators to join us in Seattle @Microsoft Build May 19-22.
Register todayThis browser is no longer supported.
Upgrade to Microsoft Edge to take advantage of the latest features, security updates, and technical support.
Azure DevOps Services | Azure DevOps Server 2022 - Azure DevOps Server 2019
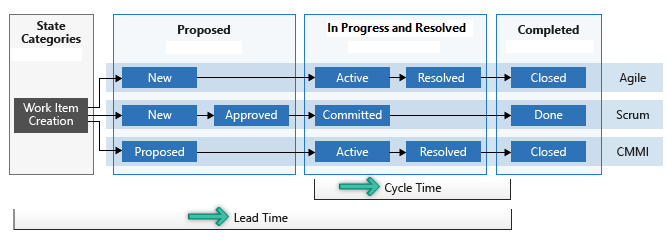
The Lead Time and Cycle Time widgets indicate how long it takes for work to flow through your development pipeline. Lead time measures the total time elapsed from the creation of work items to their completion. Cycle time measures the time it takes for your team to complete work items once they begin actively working on them.
The following diagram illustrates how lead time differs from cycle time. Lead time is calculated from Work Item Creation to entering a Completed state. Cycle time is calculated from first entering an In Progress or Resolved state category to entering a Completed state category. For more information, see About workflow states in backlogs and boards.
These measures help teams plan, identify variations in efficiency, and spot potential process issues. Lower lead and cycle times indicate faster team throughput. We recommend checking the lead time and cycle time charts before or during each retrospective. Use lead time to estimate delivery times and track service level agreements (SLAs). Use cycle time to identify process issues, spot variations in trends, and assist with planning.
For more information, see Cumulative flow, lead time, and cycle time guidance.
| Category | Requirements |
|---|---|
| Access levels | - Project member. - At least Basic access. |
| Permissions | - Team administrator or project administrator or specific dashboard permissions granted to you. - To add a widget to a team dashboard: Member of the team. |
| Feature enablement | Azure Boards enabled. If disabled, none of the work tracking Analytics widgets display. To re-enable it, see Turn a service on or off. |
| Task awareness | Be aware of the required and recommended tasks, listed later in this article. |
| Category | Requirements |
|---|---|
| Access levels | - Project member. - At least Basic access. |
| Permissions | - Team administrator or project administrator or specific dashboard permissions granted to you. - To add a widget to a team dashboard: Member of the team. |
| Feature enablement | - Azure Boards enabled. If disabled, none of the work tracking Analytics widgets display. To re-enable it, see Turn a service on or off. - Analytics installed and enabled. Project Collection Administrators group members can add extensions or enable the service. Organization owners are automatically members of this group. |
Ensure your team's board is configured with defined columns and swimlanes that support your workflow processes.
Add the widget to your dashboard. There are two widgets: Cycle Time and Lead Time. Select the one you want to display and configure.
The Configuration dialog is the same for the Cycle Time and Lead Time widgets. Configure these widgets for a team. For more information, see Create or add a team.
Select the ![]() context menu icon and select Configure to open the configuration dialog.
context menu icon and select Configure to open the configuration dialog.
Modify the title, and then select the values you want to monitor:
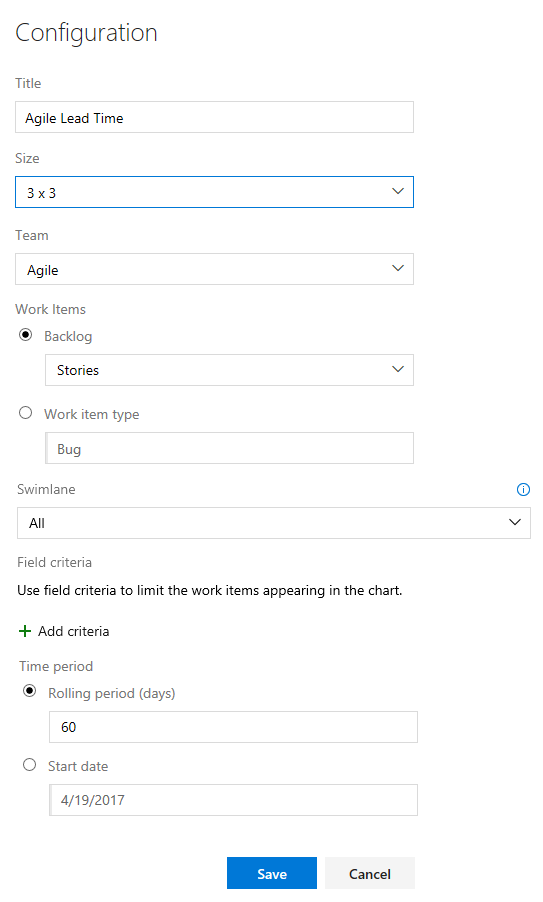
To select a Swimlane, select Backlog.
Note
You can only select work item types that are added to a backlog. To add work item types to a backlog, see Customize your backlogs or boards (Inheritance process). For On-premises XML process, see Process configuration XML element reference.
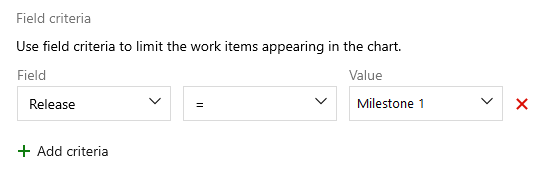
To further filter the work items used to calculate the lead or cycle time, specify the Field Criteria. For example, all the work items whose Release field is set to Milestone 1.
Note
Supplying no values to the filter might lead to selection of all work items, or might be an invalid filter argument depending on type of filter criteria.
For a continuous flow, select Rolling period and specify the number of days you want to view on the chart.
Or, for a fixed scope view, select and specify the Start date. Select this view if your team employs a Scrumban process or follows a standard sprint process. The main difference between these two types of charts is that the fixed scope chart provides information of scope change in most cases.
Select Save when you're done. The following image shows an example Lead Time chart showing 60 days of data.

For your lead time and cycle time charts to provide useful data, your team must quickly update the status of those work items that the widgets track.
Both Lead Time and Cycle Time widgets display as scatter-plot control charts. They display summary information and provide several interactive elements.
Example Lead Time widget

The chart dots represent completed work items, and their position on the horizontal axis represents the date the team completed them. Their position on the vertical axis represents the calculated lead time or cycle time.
Daily moving average: The average of data points within the moving average window, calculated based on the current day and previous N days. N is 20% of the number of days the chart displays, rounded down to the nearest odd number.
Moving average window: For April 10, the window corresponds to the previous five days. The April 10 moving average is the average of all data points from April 5 to April 10.
Standard deviation: Appears as a band around the moving average and gets calculated based on all data points within the same moving average window.
To programmatically add a widget, use the following API endpoint:
POST https://dev.azure.com/{organization}/{project}/{team}/_apis/dashboard/dashboards/{dashboardId}/widgets?api-version=7.1-preview.2
For more information, see REST API - Get widget.
Events
May 19, 6 PM - May 23, 12 AM
Calling all developers, creators, and AI innovators to join us in Seattle @Microsoft Build May 19-22.
Register todayTraining
Learning path
Use advance techniques in canvas apps to perform custom updates and optimization - Training
Use advance techniques in canvas apps to perform custom updates and optimization