Note
Access to this page requires authorization. You can try signing in or changing directories.
Access to this page requires authorization. You can try changing directories.
Azure Network Watcher provides a suite of tools to monitor, diagnose, view metrics, and enable or disable logs for Azure IaaS (Infrastructure-as-a-Service) resources. Network Watcher enables you to monitor and repair the network health of IaaS products like virtual machines (VMs), virtual networks (VNets), application gateways, load balancers, etc. Network Watcher isn't designed or intended for PaaS monitoring or Web analytics.
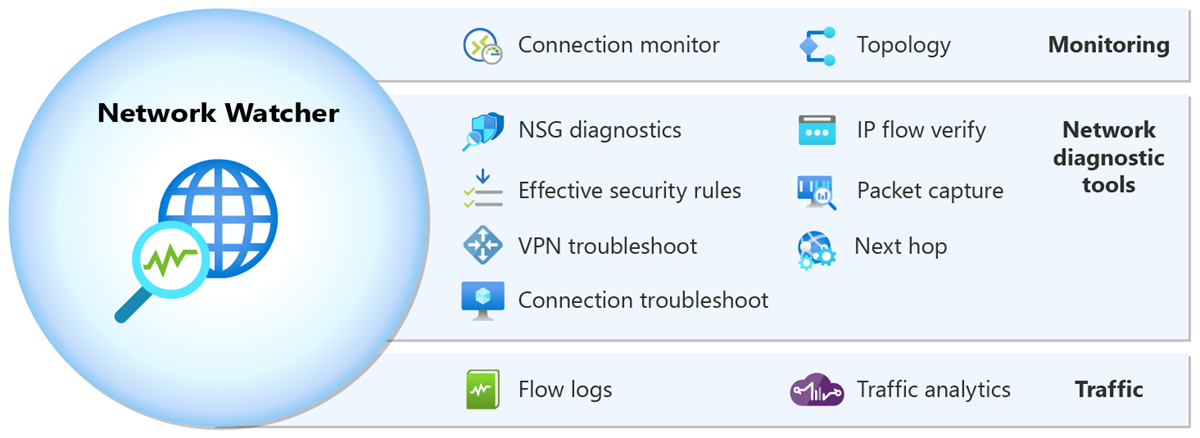
Network Watcher consists of three major sets of tools and capabilities:
Note
When you create or update a virtual network in your subscription, Network Watcher is automatically enabled in your virtual network's region. There's no impact on your resources or associated charge for automatically enabling Network Watcher. You must manually enable Network Watcher if you previously chose to opt out of Network Watcher automatic enablement. For more information, see Enable or disable Network Watcher.
Network Watcher offers two monitoring tools that help you view and monitor resources:
- Topology
- Connection monitor
Topology provides a visualization of the entire network for understanding network configuration. It provides an interactive interface to view resources and their relationships in Azure spanning across multiple subscriptions, resource groups, and locations. For more information, see View topology.
Connection monitor provides end-to-end connection monitoring for Azure and hybrid endpoints. It helps you understand network performance between various endpoints in your network infrastructure. For more information, see Connection monitor overview and Monitor network communication between two virtual machines.
Network Watcher offers seven network diagnostic tools that help troubleshoot and diagnose network issues:
- IP flow verify
- NSG diagnostics
- Next hop
- Effective security rules
- Connection troubleshoot
- Packet capture
- VPN troubleshoot
IP flow verify allows you to detect traffic filtering issues at a virtual machine level. It checks if a packet is allowed or denied to or from an IP address (IPv4 or IPv6 address). It also tells you which security rule allowed or denied the traffic. For more information, see IP flow verify overview and Diagnose a virtual machine network traffic filter problem.
NSG diagnostics allows you to detect traffic filtering issues at a virtual machine, virtual machine scale set, or application gateway level. It checks if a packet is allowed or denied to or from an IP address, IP prefix, or a service tag. It tells you which security rule allowed or denied the traffic. It also allows you to add a new security rule with a higher priority to allow or deny the traffic. For more information, see NSG diagnostics overview and Diagnose network security rules.
Next hop allows you to detect routing issues. It checks if traffic is routed correctly to the intended destination. It provides you with information about the Next hop type, IP address, and Route table ID for a specific destination IP address. For more information, see Next hop overview and Diagnose a virtual machine network routing problem.
Effective security rules allows you to view the effective security rules applied to a network interface. It shows you all security rules applied to the network interface, the subnet the network interface is in, and the aggregate of both. For more information, see Effective security rules overview and View details of a security rule.
Connection troubleshoot enables you to test a connection between a virtual machine, a virtual machine scale set, an application gateway, or a Bastion host and a virtual machine, an FQDN, a URI, or an IPv4 address. The test returns similar information returned when using the connection monitor capability, but tests the connection at a point in time instead of monitoring it over time, as connection monitor does. For more information, see Connection troubleshoot overview and Troubleshoot outbound connections with Azure Network Watcher.
Packet capture allows you to remotely create packet capture sessions to track traffic to and from a virtual machine (VM) or a virtual machine scale set. For more information, see Packet capture overview and Manage packet captures.
VPN troubleshoot enables you to troubleshoot virtual network gateways and their connections. For more information, see VPN troubleshoot overview and Diagnose a communication problem between networks.
Network Watcher offers two traffic tools that help you log and visualize network traffic:
- Flow logs
- Traffic analytics
Flow logs allows you to log information about your Azure IP traffic and stores the data in Azure storage. You can log IP traffic flowing through a network security group or Azure virtual network. For more information, see:
- Network security group flow logs and Manage network security group flow logs.
- Virtual network flow logs and Manage virtual network flow logs.
Important
On September 30, 2027, network security group (NSG) flow logs will be retired. As part of this retirement, you'll no longer be able to create new NSG flow logs starting June 30, 2025. We recommend migrating to virtual network flow logs, which overcome the limitations of NSG flow logs. After the retirement date, traffic analytics enabled with NSG flow logs will no longer be supported, and existing NSG flow logs resources in your subscriptions will be deleted. However, NSG flow logs records won't be deleted and will continue to follow their respective retention policies. For more information, see the official announcement.
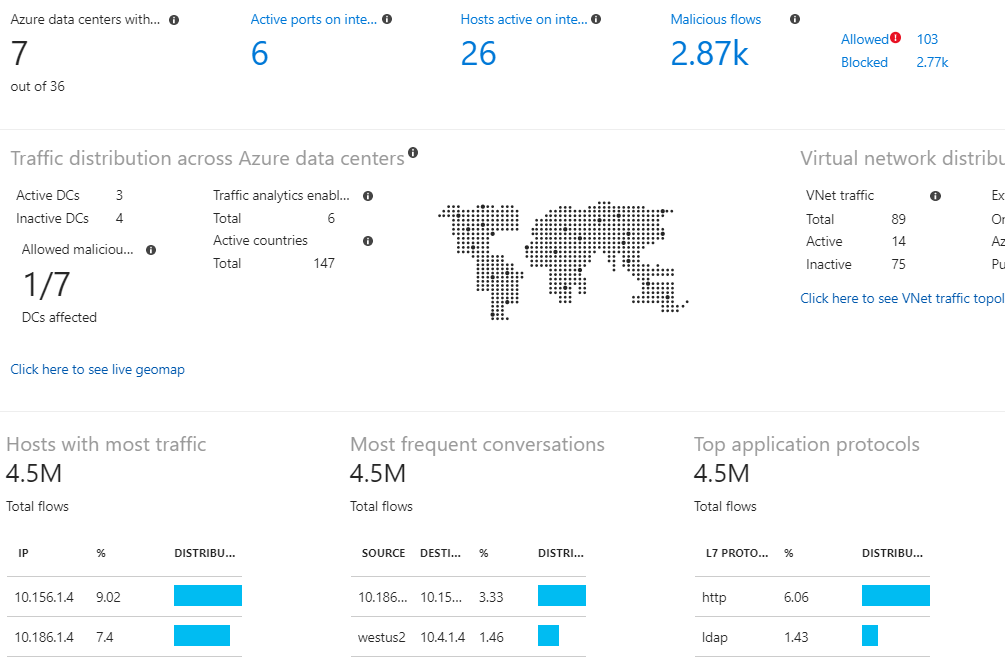
Traffic analytics provides rich visualizations of flow logs data. For more information about traffic analytics, see traffic analytics and Manage traffic analytics using Azure Policy.
The Usage + quotas capability of Network Watcher provides a summary of your deployed network resources within a subscription and region, including current usage and corresponding limits for each resource. For more information, see Networking limits to learn about the limits for each Azure network resource per region per subscription. This information is helpful when planning future resource deployments as you can't create more resources if you reach their limits within the subscription or region.
Network Watcher has the following limits:
| Resource | Limit |
|---|---|
| Network Watcher instances per region per subscription | 1 (One instance in a region to enable access to the service in the region) |
| Connection monitors per region per subscription | 100 |
| Maximum test groups per a connection monitor | 20 |
| Maximum sources and destinations per a connection monitor | 100 |
| Maximum test configurations per a connection monitor | 20 |
| Packet capture sessions per region per subscription | 10,000 (Number of sessions only, not saved captures) |
| VPN troubleshoot operations per subscription | 1 (Number of operations at one time) |
For pricing details, see Network Watcher pricing.
For SLA details, see Service Level Agreements (SLA) for Online Services.
For answers to frequently asked questions about Network Watcher, see Network Watcher (FAQ).
To view the latest Network Watcher feature updates, see Service updates.
- To get started using Network Watcher diagnostic tools, see Quickstart: Diagnose a virtual machine network traffic filter problem.
- To learn more about Network Watcher, see Training module: Introduction to Azure Network Watcher.