Training
Module
Optimize Azure costs with data analysis in Power BI - Training
Use Power BI to understand where your money is being spent in Azure so you can help your organization to optimize its costs.
This browser is no longer supported.
Upgrade to Microsoft Edge to take advantage of the latest features, security updates, and technical support.
Note
Access to this page requires authorization. You can try signing in or changing directories.
Access to this page requires authorization. You can try changing directories.
This article describes how you plan for and manage costs for Azure Synapse Analytics. First, you use the Azure pricing calculator to help plan forAzure Synapse Analytics costs before you add any resources for the service to estimate costs. Next, as you add Azure resources, review the estimated costs. After you've started using Azure Synapse Analytics resources, use Cost Management features to set budgets and monitor costs. You can also review forecasted costs and identify spending trends to identify areas where you might want to act. Costs for Azure Synapse Analytics are only a portion of the monthly costs in your Azure bill. Although this article explains how to plan for and manage costs for Azure Synapse Analytics, you're billed for all Azure services and resources used in your Azure subscription, including the third-party services.
Cost analysis in Cost Management supports most Azure account types, but not all of them. To view the full list of supported account types, see Understand Cost Management data. To view cost data, you need at least read access for an Azure account. For information about assigning access to Cost Management data, see Assign access to data.
Use the Azure pricing calculator to estimate costs before you add Azure Synapse Analytics.
Azure Synapse has various resources that have different charges as seen in the cost estimate below.
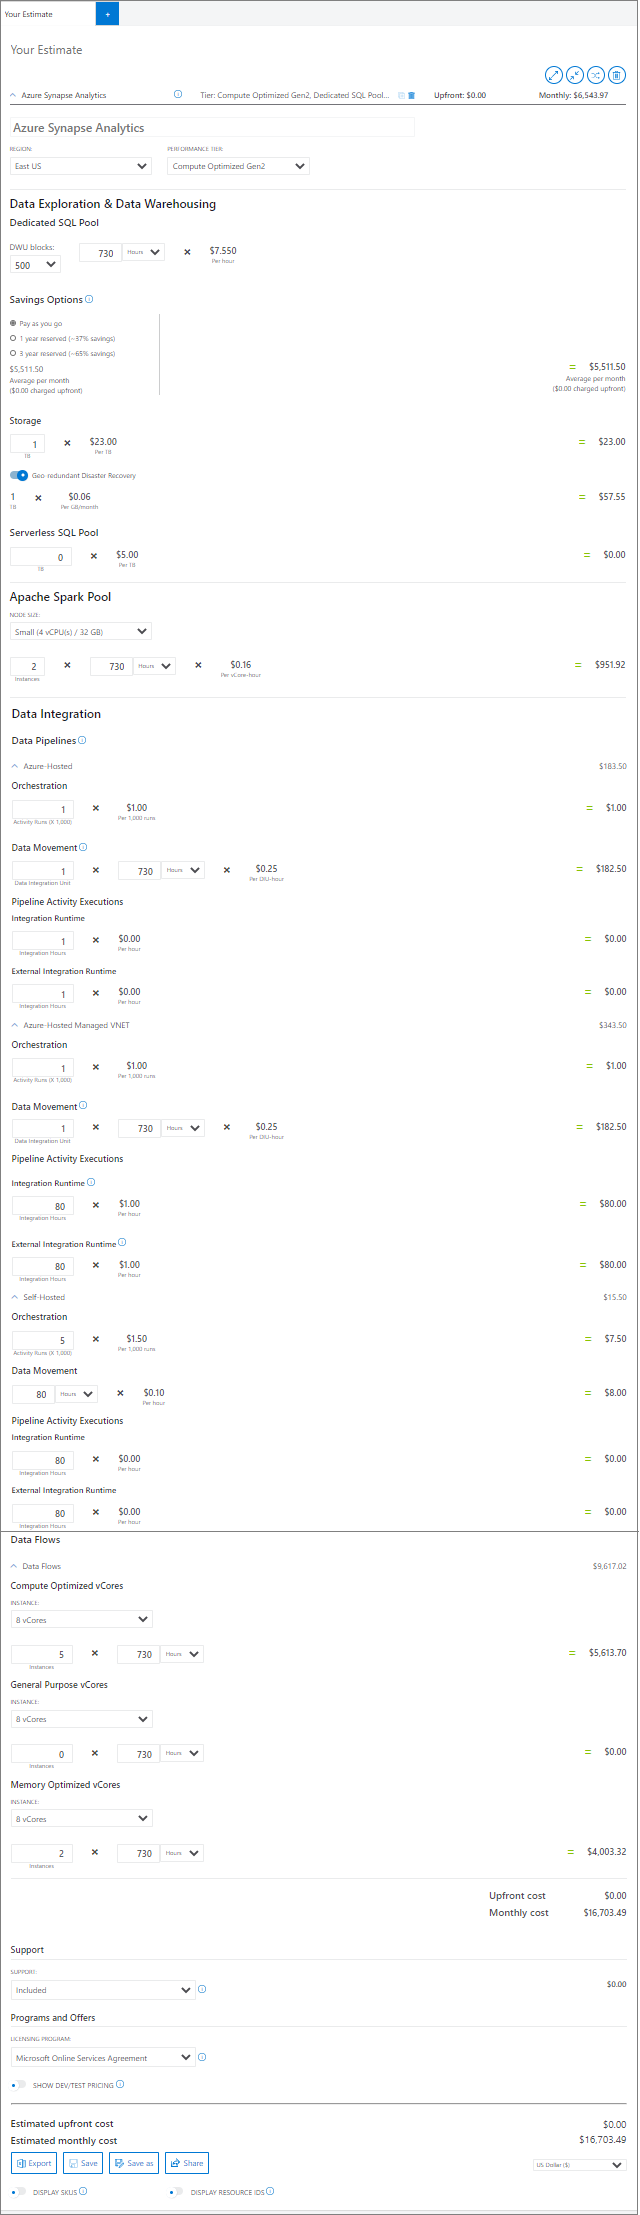
Azure Synapse runs on Azure infrastructure that accrues costs along with Azure Synapse when you deploy the new resource. It's important to understand that additional infrastructure might accrue cost.
When you create or use Azure Synapse Analytics resources, you might get charged for the following meters:
At the end of your billing cycle, the charges for each meter are summed. Your bill or invoice shows a section for all Azure Synapse Analytics costs. There's a separate line item for each meter.
When you create resources for Azure Synapse, resources for other Azure services are also created. They include:
After you delete Azure Synapse resources, the following resources might continue to exist. They continue to accrue costs until you delete them.
You can pay for Azure Synapse charges with your Azure Prepayment credit. However, you can't use Azure Prepayment credit to pay for charges for third-party products and services including those you get from the Azure Marketplace.
You can save on your Azure Synapse Analytics costs when you pre-purchase Azure Synapse commit units (SCU) for one year. You can use the pre-purchased SCUs at any time during the purchase term. For more information, see Optimize Azure Synapse Analytics costs with a Pre-Purchase Plan
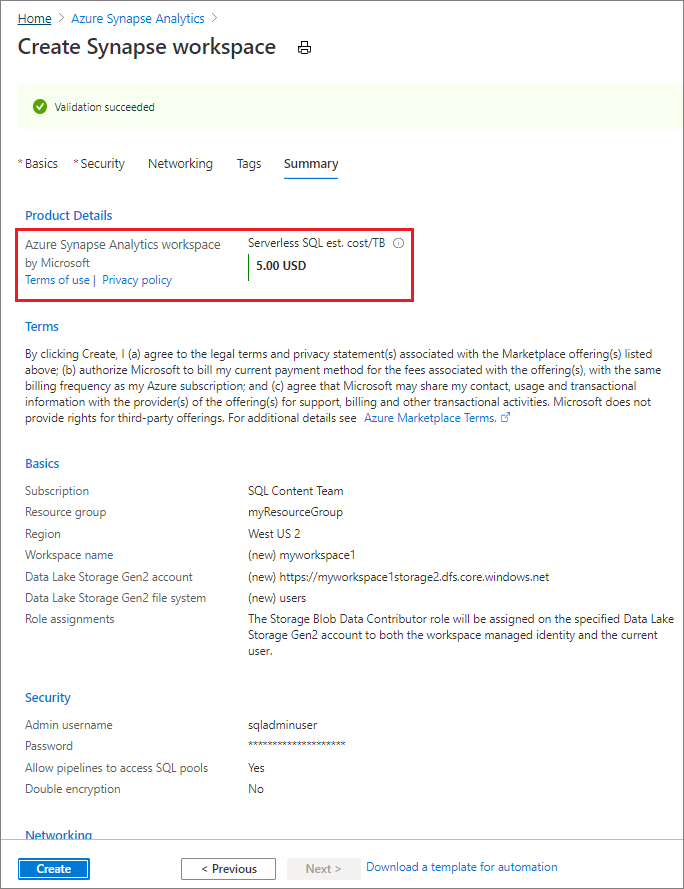
As you create resources for Azure Synapse Analytics, you see estimated costs. A workspace has a serverless SQL pool created with the workspace. Serverless SQL pool doesn't incur charges until you run queries. Other resources, such as dedicated SQL pools and serverless Apache Spark pools, will need to be created within the workspace.
To create an Azure Synapse Analytics workspace and view the estimated price:
If your Azure subscription has a spending limit, Azure prevents you from spending over your credit amount. As you create and use Azure resources, your credits are used. When you reach your credit limit, the resources that you deployed are disabled for the rest of that billing period. You can't change your credit limit, but you can remove it. For more information about spending limits, see Azure spending limit.
As you use Azure Synapse resources, you incur costs. Azure resource usage unit costs vary by time intervals (seconds, minutes, hours, and days) or by unit usage (bytes, megabytes, and so on.) As soon as you start using resources in Azure Synapse, costs are incurred and you can see the costs in cost analysis.
When you use cost analysis, you view costs for Azure Synapse Analytics in graphs and tables for different time intervals. Some examples are by day, current and prior month, and year. You also view costs against budgets and forecasted costs. Switching to longer views over time can help you identify spending trends. And you see where overspending occurred. If you created budgets, you can also easily see where they're exceeded.
To view Azure Synapse costs in cost analysis:
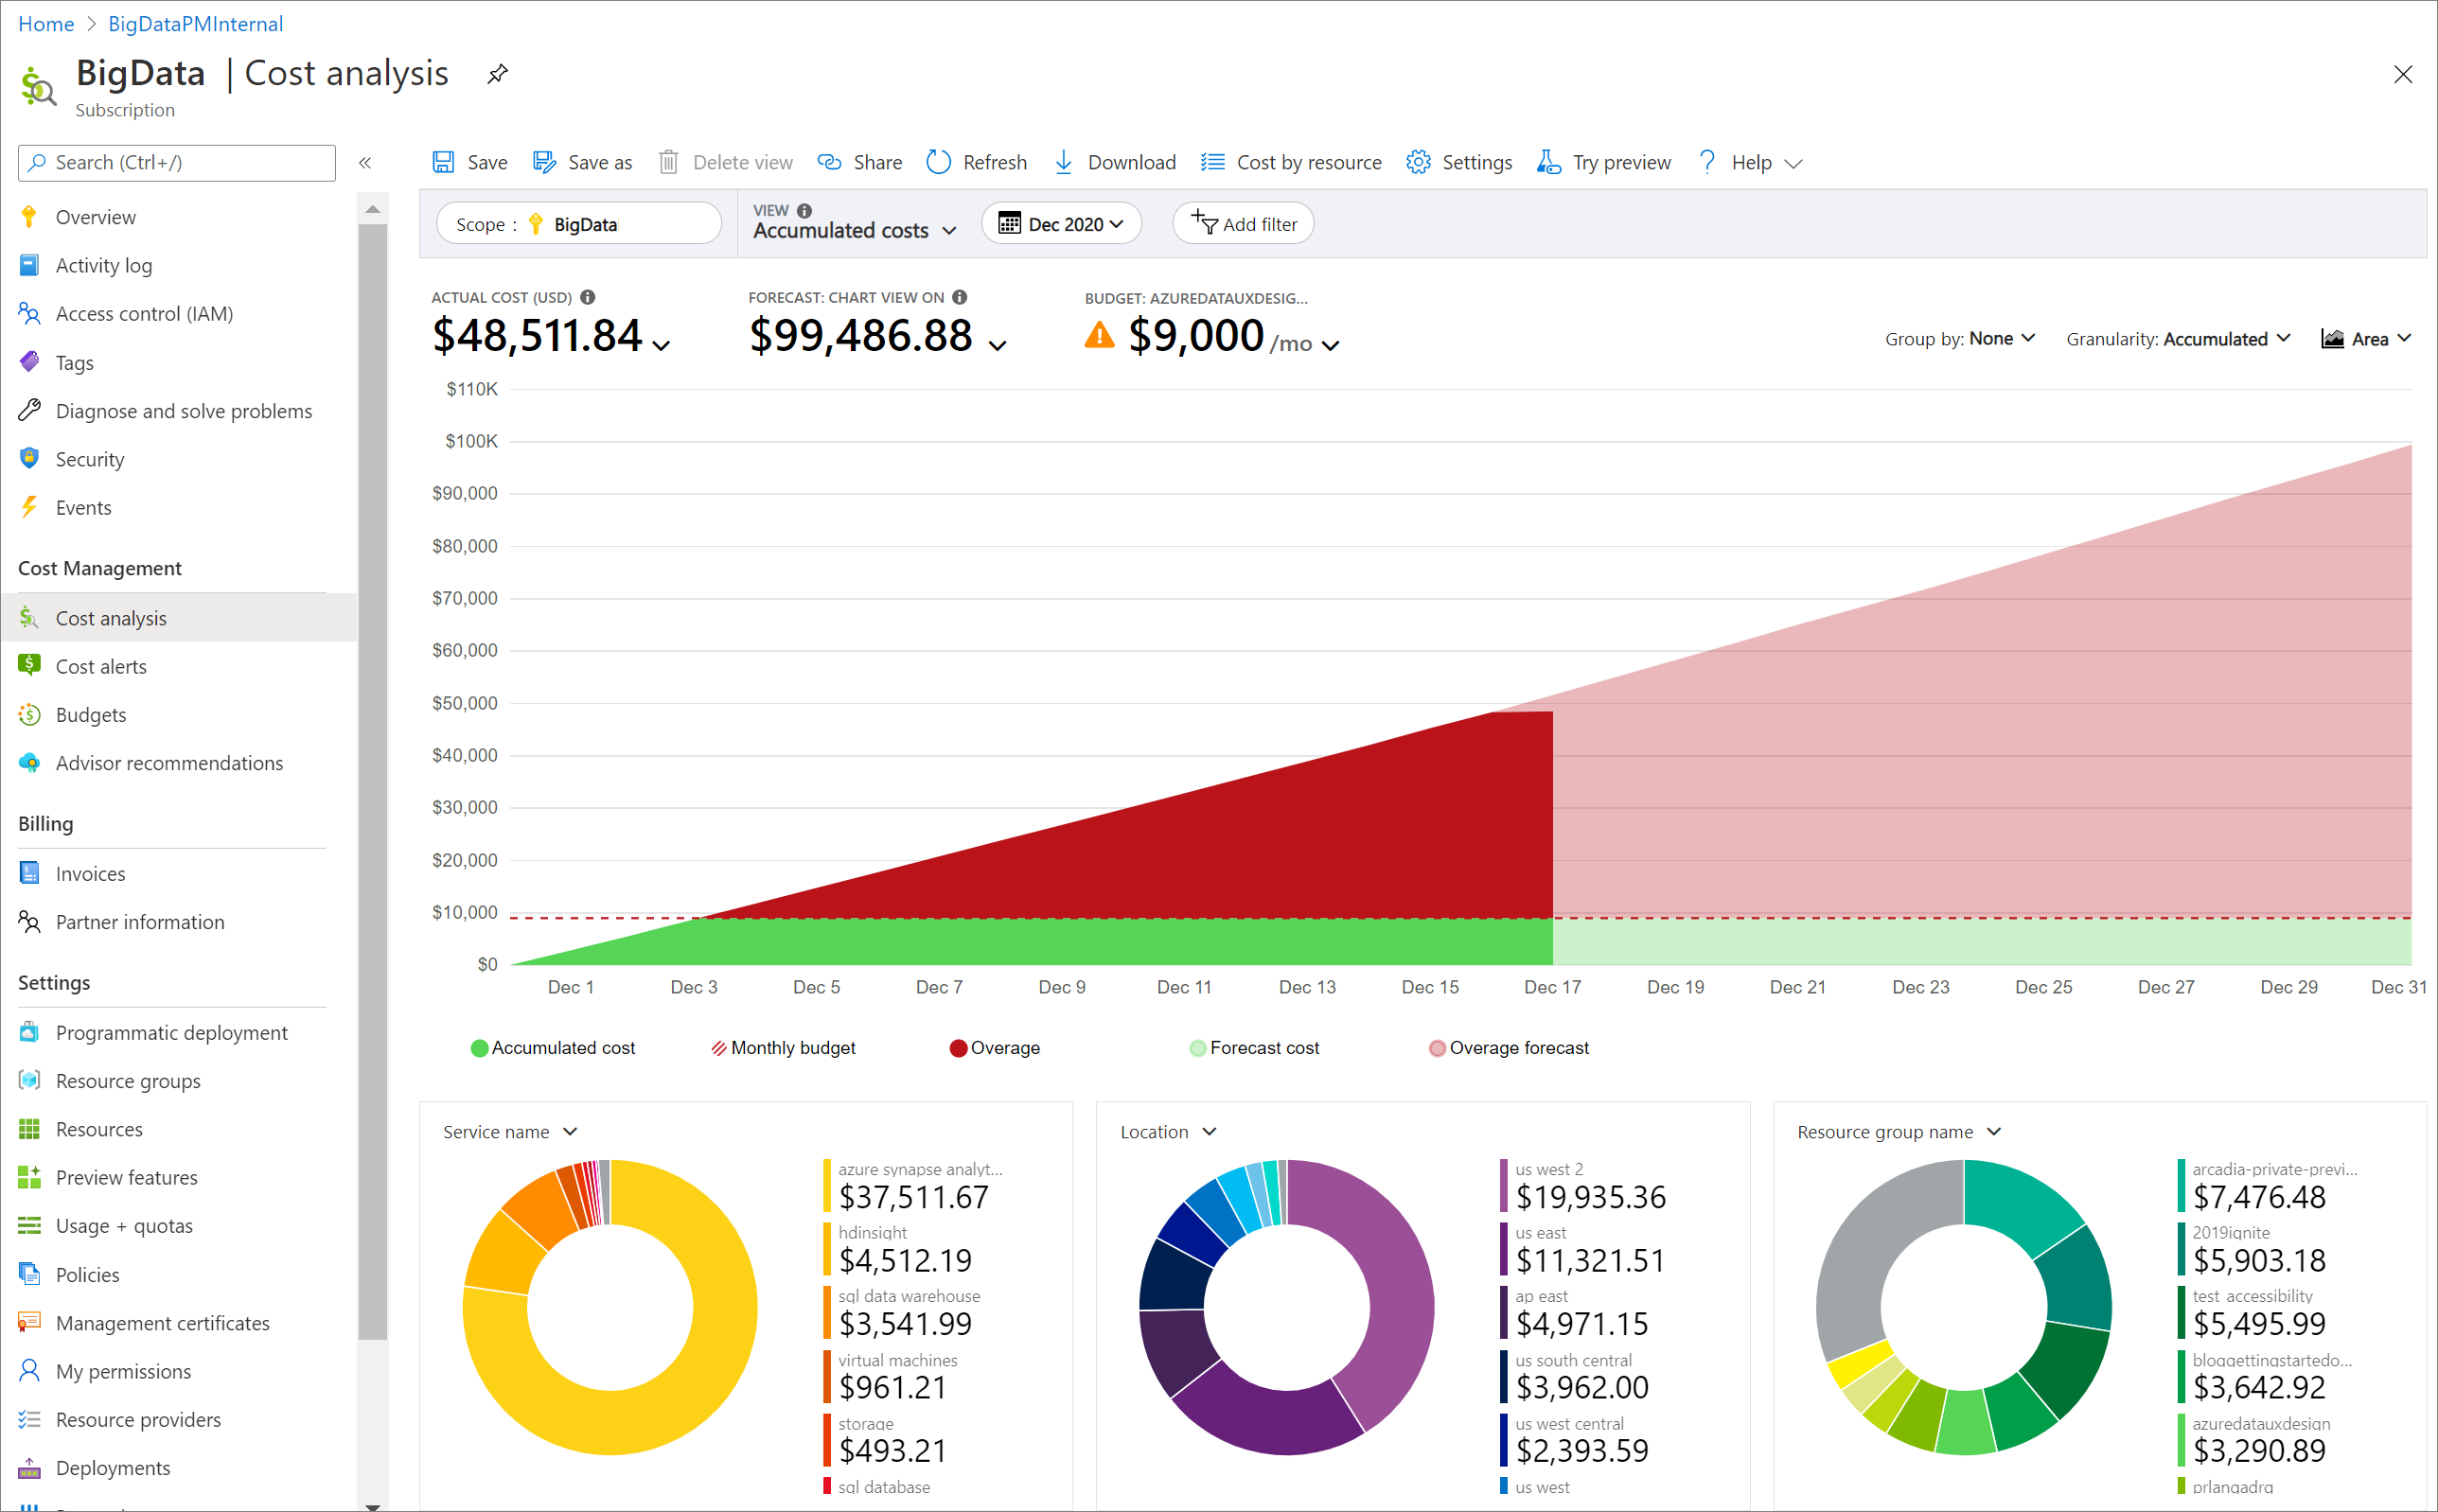
Actual monthly costs are shown when you initially open cost analysis. Here's an example showing all monthly usage costs.
Here's an example showing costs for just Azure Synapse.
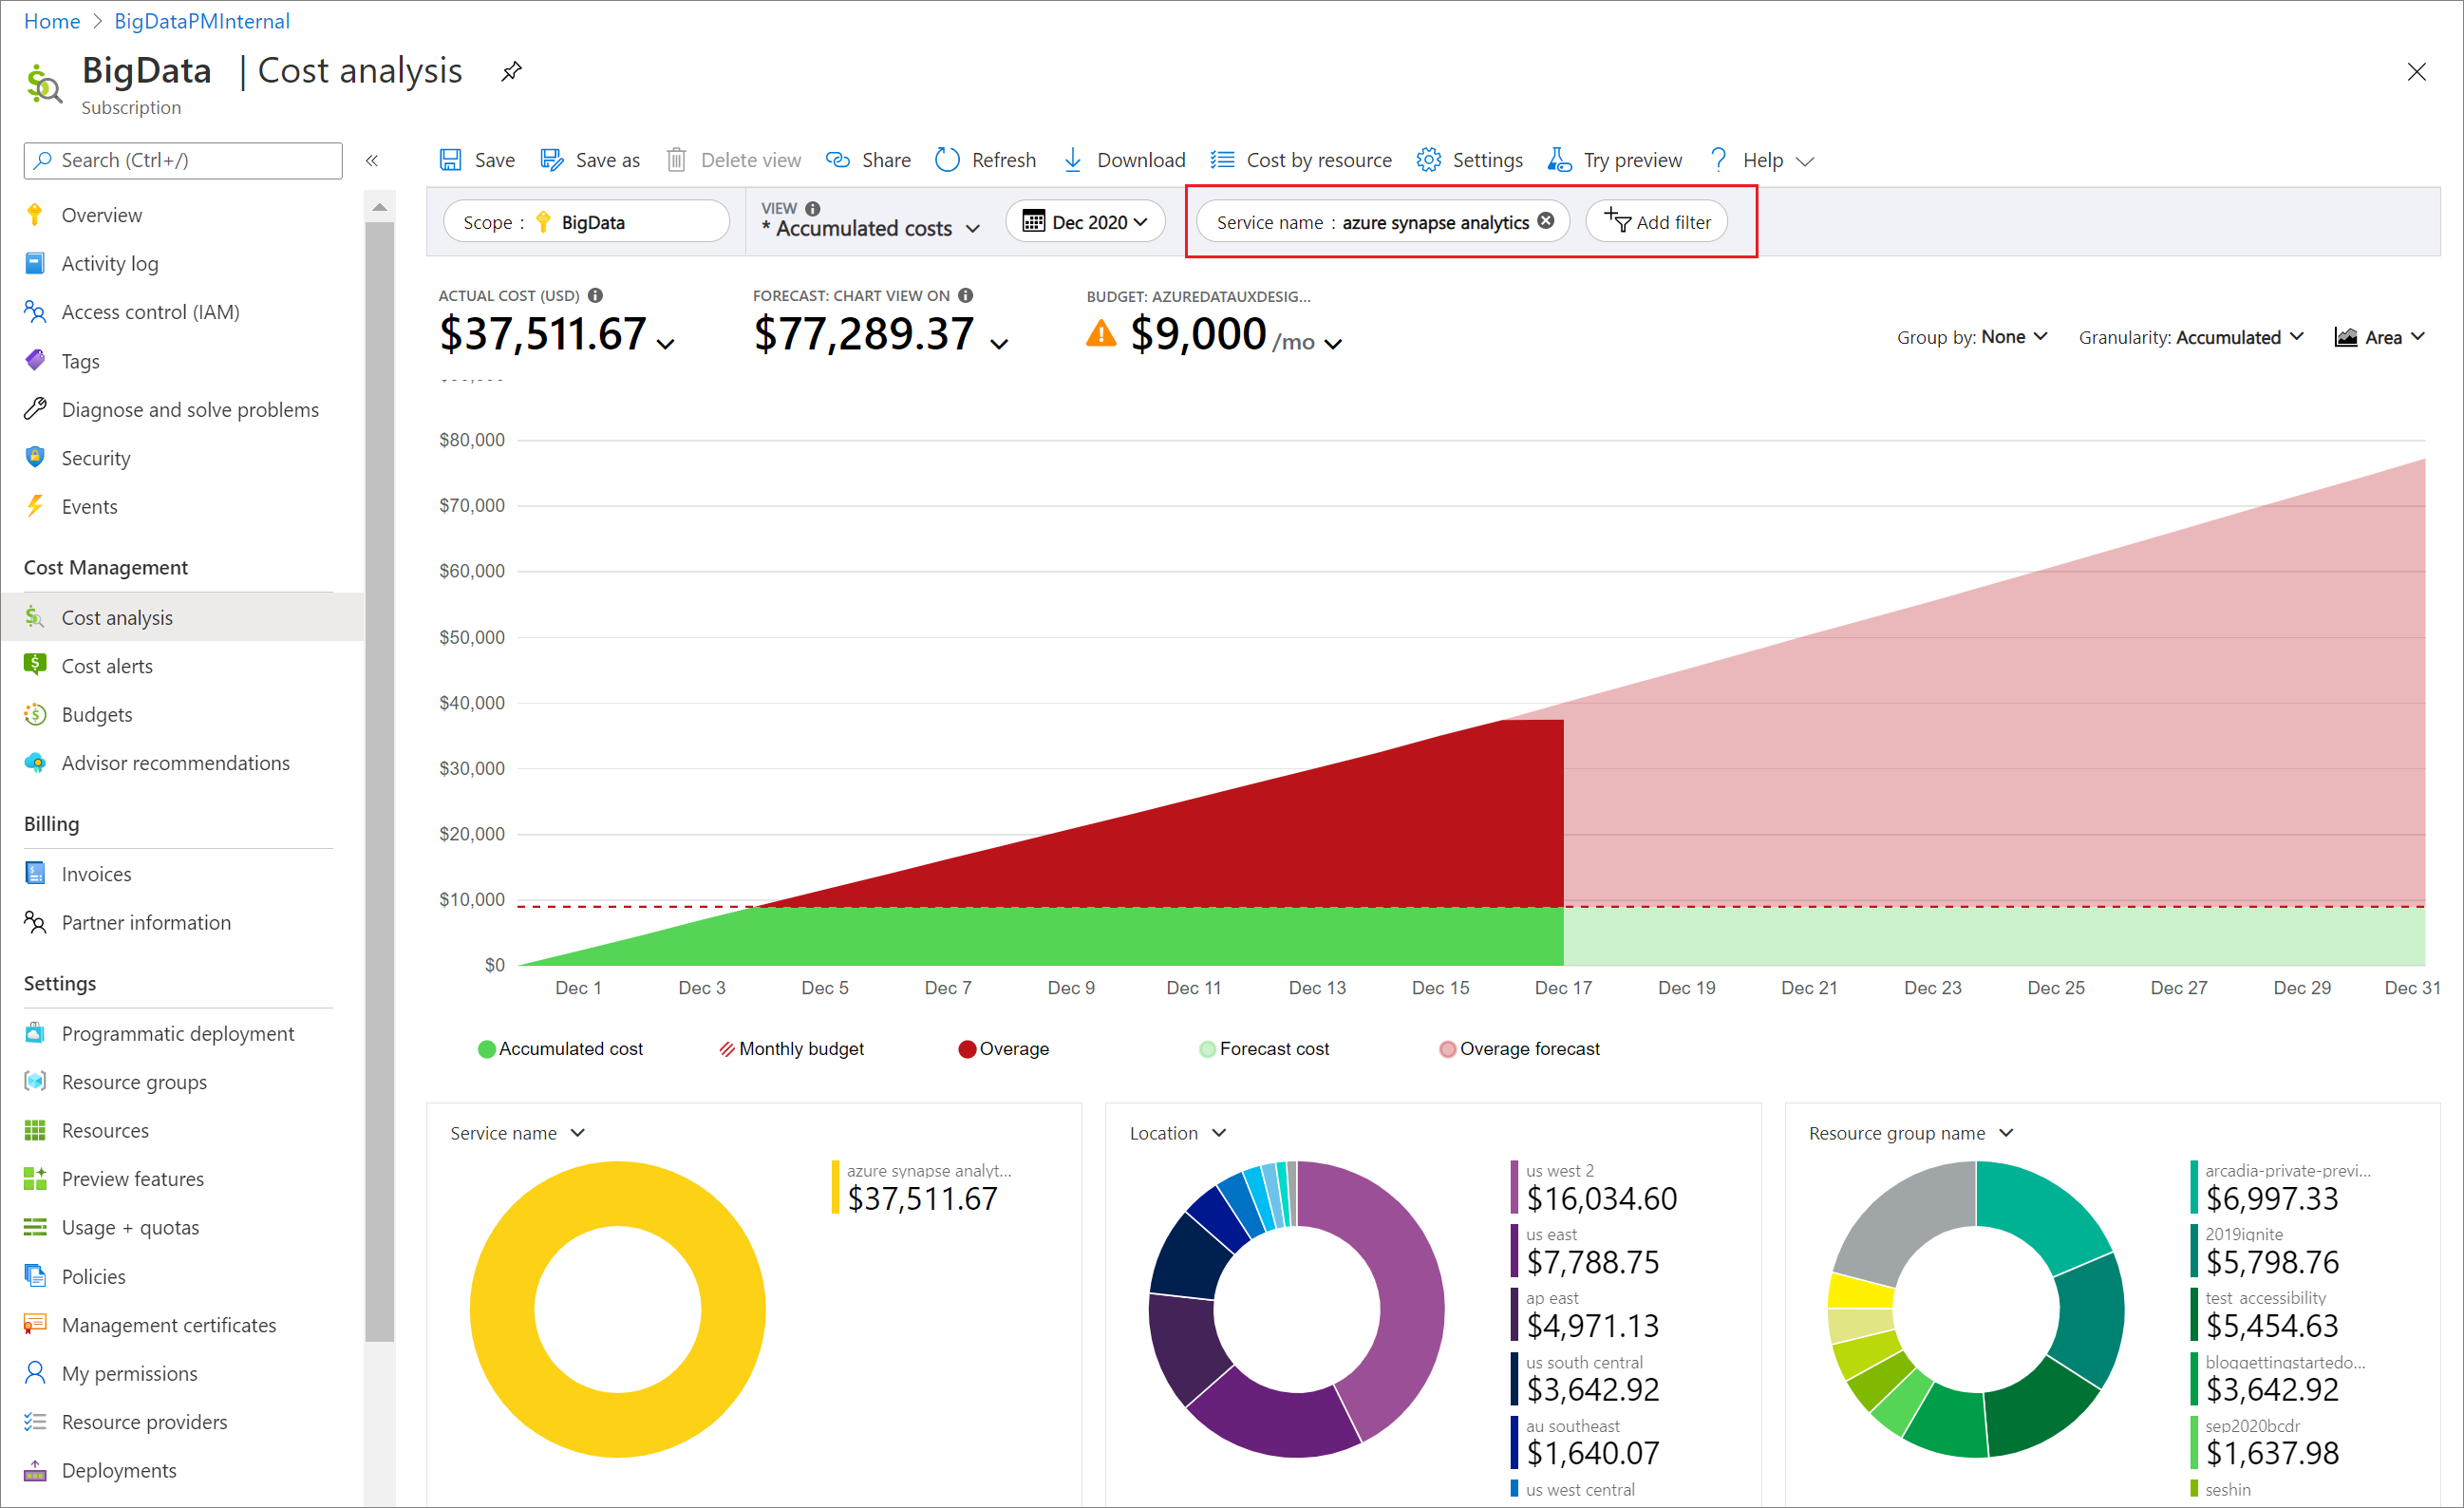
In the preceding example, you see the current cost for the service. Costs by Azure regions (locations) and Azure Synapse costs by resource group are also shown. From here, you can explore costs on your own.
You can create budgets to manage costs and create alerts that automatically notify stakeholders of spending anomalies and overspending risks. Alerts are based on spending compared to budget and cost thresholds. Budgets and alerts are created for Azure subscriptions and resource groups, so they're useful as part of an overall cost monitoring strategy.
Budgets can be created with filters for specific resources or services in Azure if you want more granularity present in your monitoring. Filters help ensure that you don't accidentally create new resources that cost you more money. For more information about the filter options available when you create a budget, see Group and filter options.
You can also export your cost data to a storage account. This is helpful when you need or others to do more data analysis for costs. For example, a finance team can analyze the data using Excel or Power BI. You can export your costs on a daily, weekly, or monthly schedule and set a custom date range. Exporting cost data is the recommended way to retrieve cost datasets.
To learn more about costs for serverless SQL pool see Cost management for serverless SQL pool in Azure Synapse Analytics
You can control costs for a dedicated SQL pool by pausing the resource when it isn't is use. For example, if you won't be using the database during the night and on weekends, you can pause it during those times, and resume it during the day. For more information, see Pause and resume compute in dedicated SQL pool via the Azure portal
To control costs for your serverless Apache Spark pool, enable the serverless Apache Spark automatic pause feature and set your timeout value accordingly. Choose the node sizes appropriately to match your preference for performance vs. cost. Use autoscale to resize pools when needed. When using Synapse Studio for your development, the studio sends a keep alive message to keep the session active, which is also configurable, so set a short timeout value for automatic pause. When you're done, close your session and the Apache Spark pool will automatically pause once the timeout value is reached. Billing starts for a serverless Apache Spark Pool when it starts until the ide timeout. Autoscale up or down will increase the pool runtime.
During development, create multiple Apache Spark pool definitions of various sizes. Creating Apache Spark pool definitions are free and you'll only be charged for usage. Apache Spark pool usage in Azure Synapse is charged per vCore hour and prorated by the minute. For example, use small pool sizes for code development and validation while using larger pool sizes for performance testing.
To learn more about data integration costs, see Plan and manage costs for Azure Data Factory
Training
Module
Optimize Azure costs with data analysis in Power BI - Training
Use Power BI to understand where your money is being spent in Azure so you can help your organization to optimize its costs.