Analyze pages using the Inspect tool
Use the Inspect tool to see information about an item within a rendered webpage.
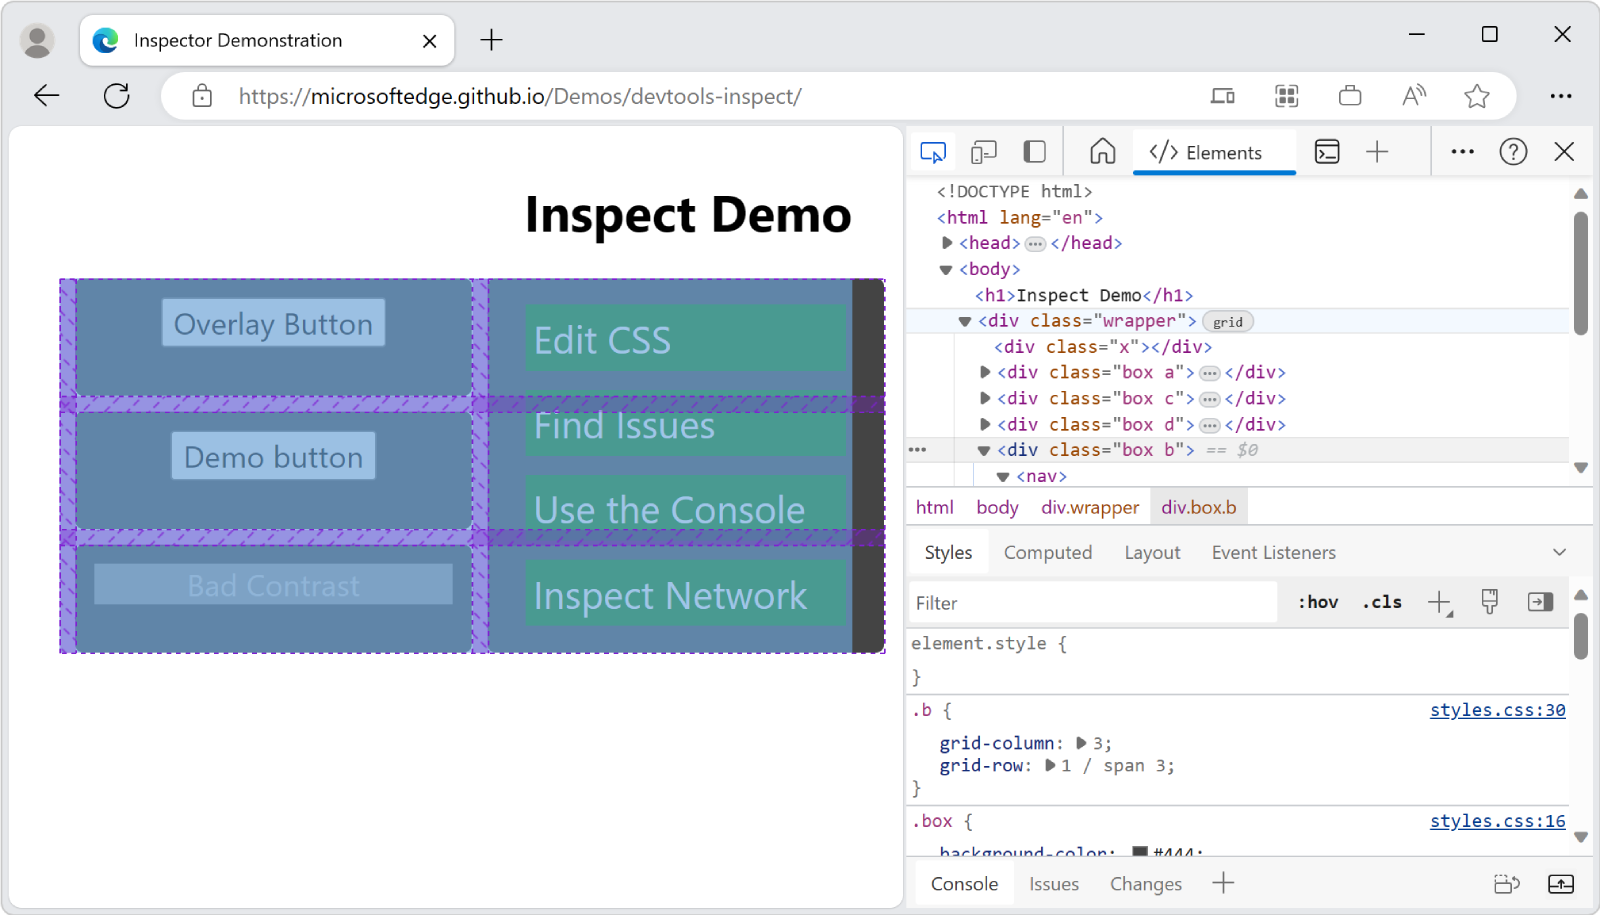
When the Inspect tool is active, you hover over items in the webpage, and DevTools adds an information overlay information and grid highlighting on the webpage.
When you click an item in the webpage, the DOM tree in the Elements tool is automatically updated to show the DOM element that corresponds to the clicked item in the rendered webpage, and its CSS styling in the Styles tab.
To try out the Inspect tool:
Open the Inspect Demo page in a new window or tab.
Right-click anywhere in the demo webpage and then select Inspect, to open DevTools.
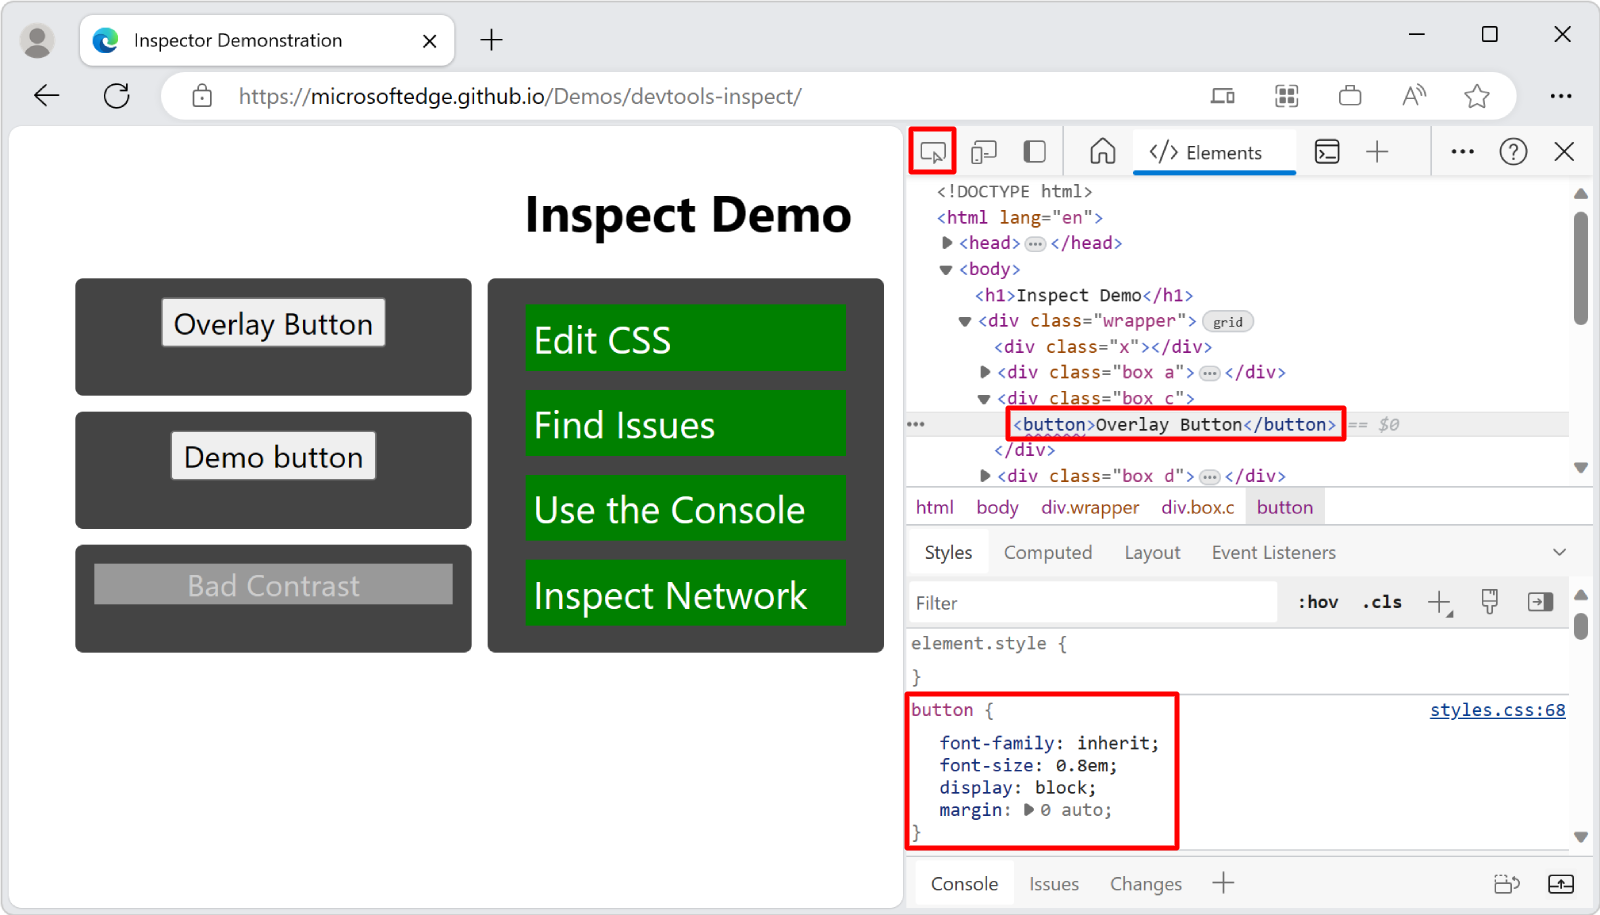
In the upper left corner of DevTools, click the Inspect tool (
 ) button. Or, when DevTools has focus, press Ctrl+Shift+C (Windows, Linux) or Command+Shift+C (macOS).
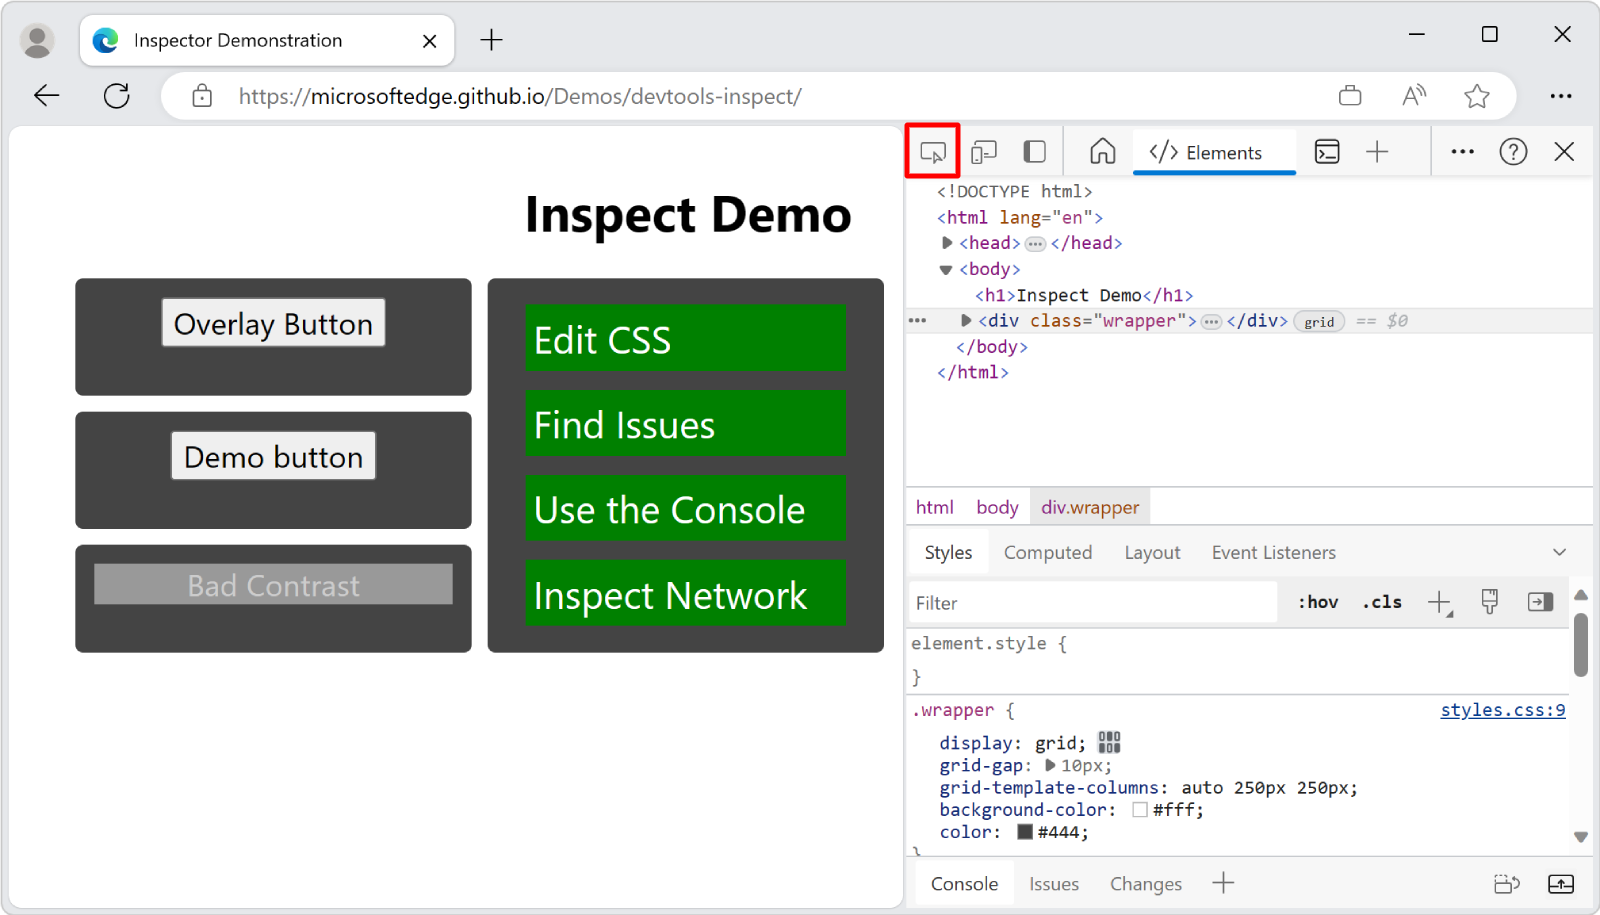
The button icon turns blue (
 ), indicating that the Inspect tool is active.
In the rendered webpage, hover over items and watch the information overlay and grid highlighting.
Click an item in the rendered webpage.
The DOM tree in the Elements tool is automatically updated to show the DOM element that corresponds to the clicked item in the rendered webpage, and its CSS styling in the Styles tab. Clicking in the webpage also turns off Inspect mode in the webpage.
When the Inspect tool is active, hovering over any element on the rendered webpage displays the Inspect overlay. The Inspect overlay displays general and accessibility information about that element.
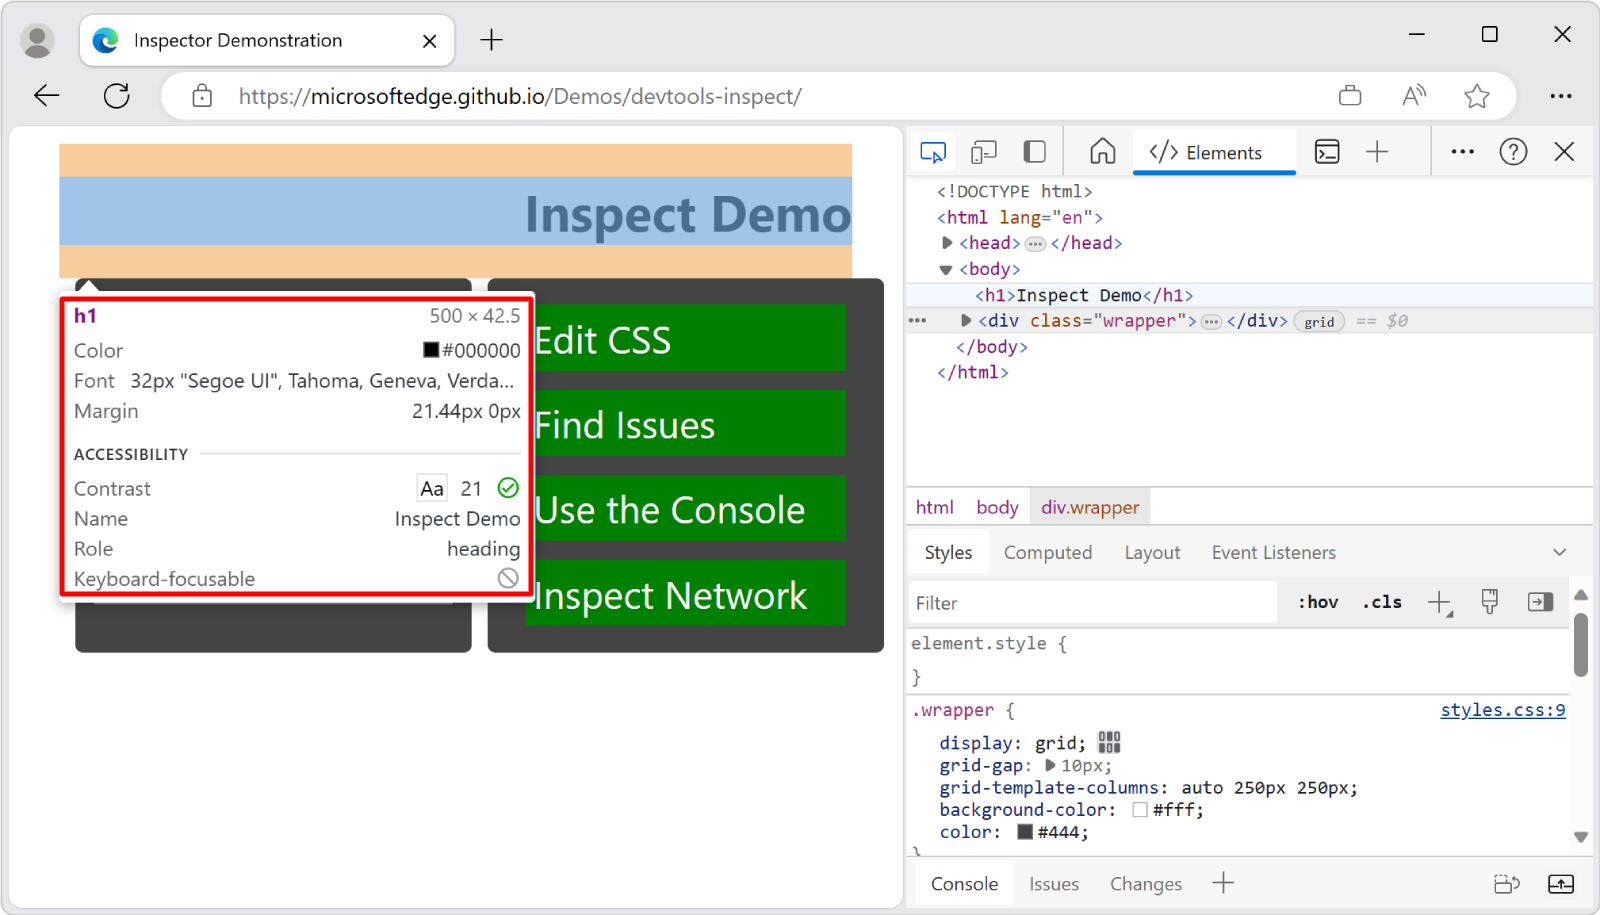
When you hover over a page element on the rendered page, the DOM tree automatically expands to highlight the element that you are hovering over.
The Inspect overlay shows the following information about the element:
- The name of the element.
- The element's dimensions, in pixels.
- The element's color, as a hexadecimal value and a color swatch.
- The element's font settings.
- The element's margin and padding, in pixels.
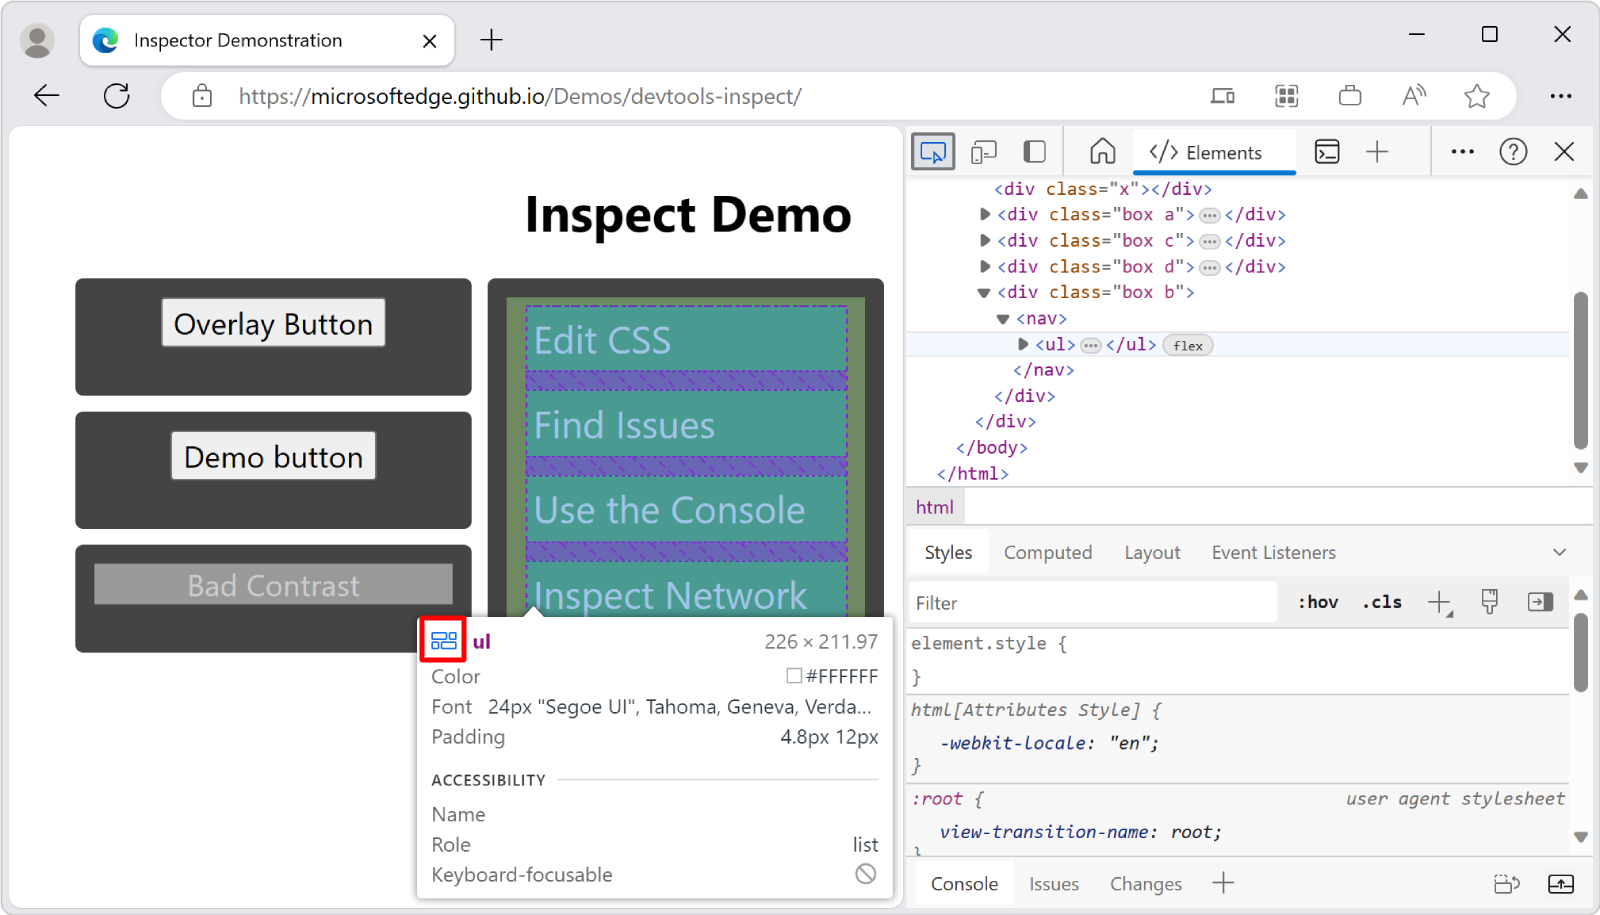
Which information is shown depends on the type of element and the styles applied to it. If the element is positioned using CSS grid or CSS flexbox, a different icon appears next to the element's name in the Inspect overlay:
The Accessibility section of the Inspect overlay displays information about:
- Text-color contrast.
- The name and the role of the element that's reported to assistive technology.
- Whether the element is keyboard focusable.
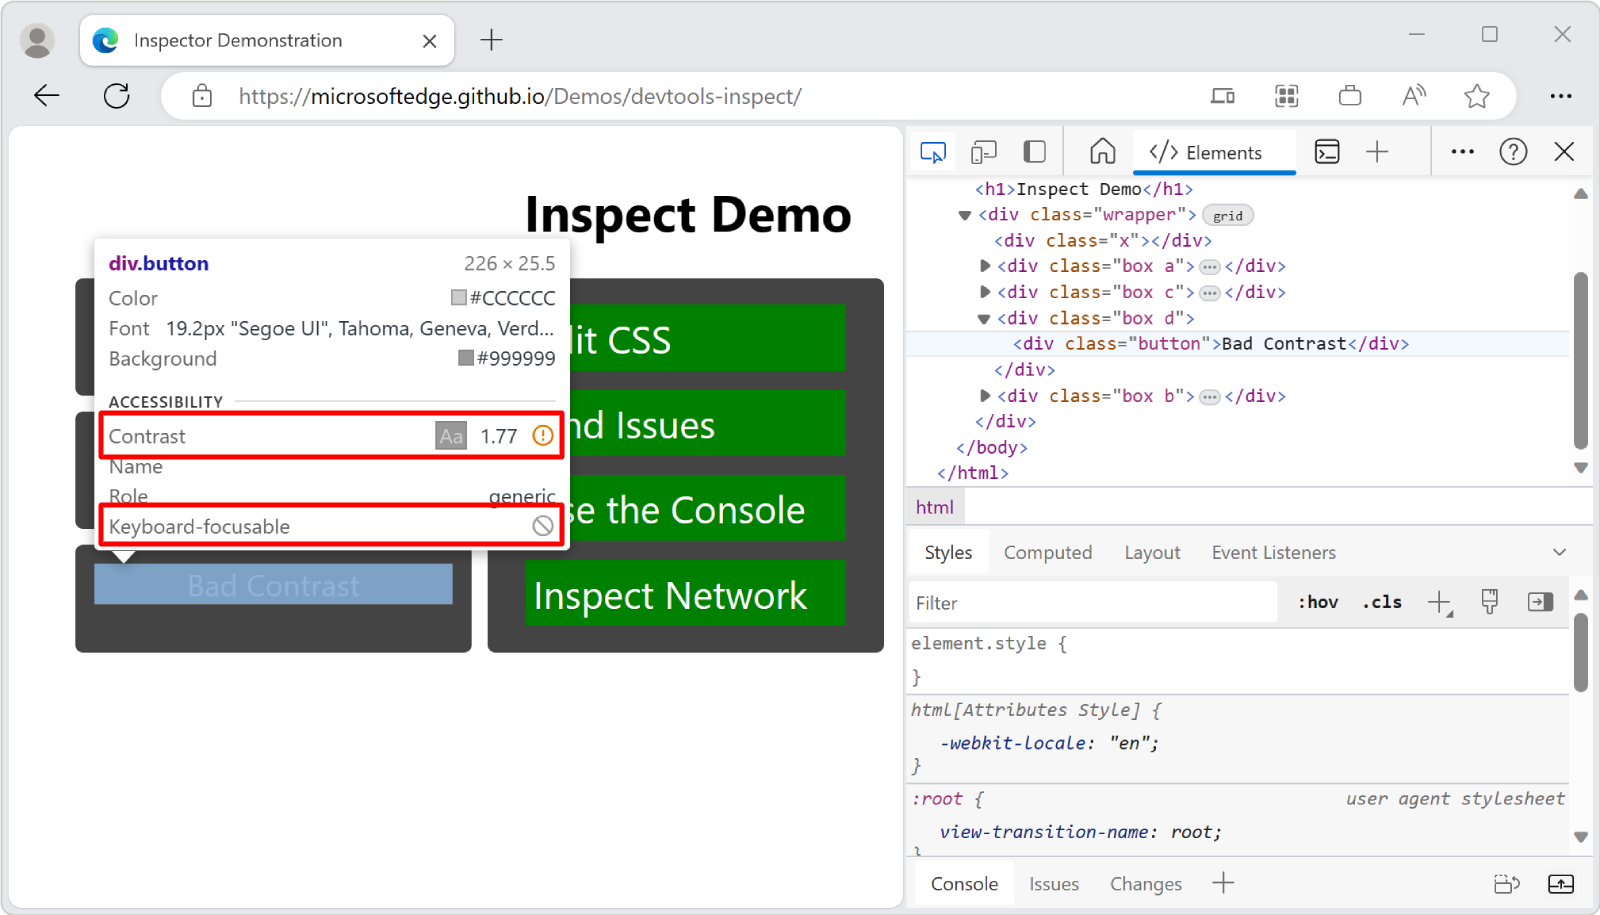
For example, in the Inspect Demo page, for the Bad Contrast button, the Inspect overlay has a warning icon next to the contrast value of 1.77. The Inspect overlay also shows that the button isn't focusable via keyboard. The button can't be navigated to via keyboard, because the button is implemented as a <div> element with a class of button, instead of being implemented as a <button> element.
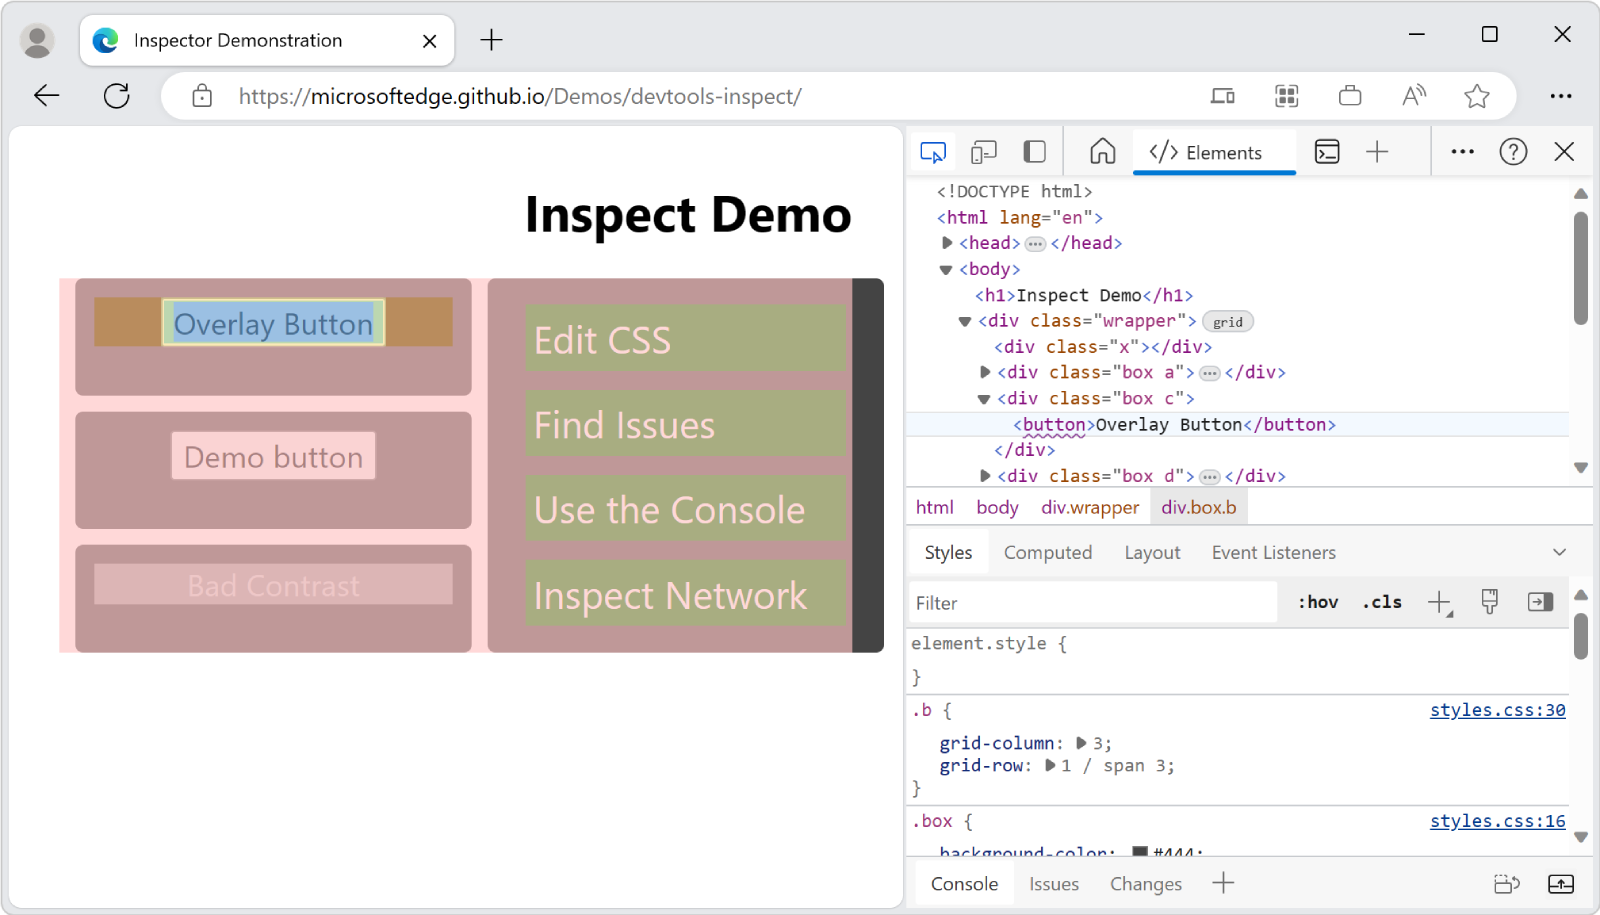
Elements that have the CSS property of pointer-events: none aren't available to the Inspect tool. In the Inspect Demo page, hover over the Overlay Button and you will see that the parent element (div.wrapper) is shown instead of the Overlay Button.
To inspect elements that have the CSS property of pointer-events: none, press Shift while hovering over the element. There's also a color overlay on page layout regions, indicating that you are in an advanced selection mode.
When you click an element in the rendered page:
- The Inspect tool is deactivated.
- The corresponding DOM node is highlighted.
- The Styles tool shows the CSS that's applied to the element.
When using the Inspect tool and moving around the rendered webpage, you can keep the current Inspect overlay displayed. Press and hold Ctrl+Alt (Windows, Linux) or Ctrl+Option (macOS) while you move around in the rendered webpage. The existing tooltip and grid color overlay for the Inspect tool remains displayed while you hover over different parts of the rendered webpage.
To hide the Inspect tool's overlay while you move the mouse pointer over the rendered webpage, press and hold Ctrl.