你当前正在访问 Microsoft Azure Global Edition 技术文档网站。 如果需要访问由世纪互联运营的 Microsoft Azure 中国技术文档网站,请访问 https://docs.azure.cn。
教程:从 Google Maps 迁移 Web 应用
使用 Google Maps 的大多数 Web 应用都是使用 Google Maps V3 JavaScript SDK。 Azure Maps Web SDK 是适合用于迁移目标的基于 Azure 的 SDK。 Azure Maps Web SDK 允许你使用自己的内容和图像自定义交互式地图。 你可以在 Web 或移动应用程序中运行自己的应用。 此控件使用 WebGL,因此可以渲染大型数据集,同时保持很高的性能。 使用 JavaScript 或 TypeScript 通过此 SDK 进行开发。 本教程演示:
- 加载地图
- 将地图本地化
- 添加标记、折线和多边形。
- 在弹出窗口或信息窗口中显示信息
- 加载并显示 KML 和 GeoJSON 数据
- 聚集标记
- 叠加图块层
- 显示交通情况数据
- 添加地面叠加层
此外:
- 如何使用 Azure Maps Web SDK 完成常见映射任务。
- 改善性能和用户体验的最佳做法。
- 有关使用 Azure Maps 中提供的更高级功能的提示。
如果迁移现有的 Web 应用程序,请检查该应用程序是否使用开源地图控件库。 开源地图控件库的示例包括:Cesium、Leaflet 和 OpenLayers。 即使应用程序使用开源地图控件库,而你不想要使用 Azure Maps Web SDK,也仍可以迁移该应用程序。 在这种情况下,请将应用程序连接到 Azure Maps 呈现服务(道路图块 | 卫星图块)。 下面指出了有关如何在某些常用开源地图控件库中使用 Azure Maps 的详细信息。
- Cesium - 适用于 Web 的 3D 地图控件。 Cesium 文档。
- Leaflet - 适用于 Web 的轻型 2D 地图控件。 Leaflet 代码示例 | Leaflet 文档。
- OpenLayers - 支持投影的适用于 Web 的 2D 地图控件。 OpenLayers 文档。
如果使用 JavaScript 框架进行开发,则以下某个开源项目可能有用:
- ng-azure-maps - 围绕 Azure Maps 的 Angular 10 包装器。
- AzureMapsControl.Components - Azure Maps Blazor 组件。
- Azure Maps React 组件 - Azure Maps 控件的 React 包装器。
- Vue Azure Maps - Vue 应用程序的 Azure Maps 组件。
先决条件
如果没有 Azure 订阅,请在开始之前创建一个免费帐户。
注意
有关 Azure Maps 中身份验证的详细信息,请参阅在 Azure Maps 中管理身份验证。
重要功能支持
下表列出了 Google Maps V3 JavaScript SDK 中的重要 API 功能,以及 Azure Maps Web SDK 中支持的 API 功能。
| Google Maps 功能 | Azure Maps Web SDK 支持 |
|---|---|
| 标记 | |
| 标记聚类 | |
| 折线和多边形 | |
| 数据层 | |
| 地面叠层 | |
| 热度地图 | |
| 图块层 | |
| KML 层 | |
| 绘图工具 | |
| 地理编码器服务 | |
| 方向服务 | |
| 距离矩阵服务 |
Web SDK 中的显著差异
下面是 Google Maps 与 Azure Maps Web SDK 之间需要注意的一些重要区别:
- 除了提供托管终结点用于访问 Azure Maps Web SDK 以外,还可以使用 npm 包。 有关如何将 Web SDK 包嵌入应用的详细信息,请参阅使用 Azure Maps 地图控件。 此程序包还包括了 TypeScript 定义。
- 首先需要在 Azure Maps 中创建 Map 类的实例。 等待激发地图
ready或load事件,然后以编程方式与地图交互。 此顺序可以确保加载所有地图资源并准备好访问这些资源。 - 这两个平台对基础地图使用类似的图块系统。 Google Maps 中图块的尺寸为 256 像素;Azure Maps 中图块的尺寸为 512 像素。 若要在 Azure Maps 中获得与 Google Maps 相同的地图视图,请在 Azure Maps 中,将 Google Maps 的缩放级别减 1。
- Google Maps 中的坐标称为
latitude,longitude,而 Azure Maps 使用longitude,latitude。 Azure Maps 格式符合大多数 GIS 平台所遵循的标准[x, y]。 - Azure Maps Web SDK 中的形状基于 GeoJSON 架构。 帮助器类通过 atlas.data 命名空间公开。 还有 atlas.Shape 类。 使用此类可以包装 GeoJSON 对象,以便能够以数据可绑定的方式轻松更新和维护这些对象。
- Azure Maps 中的坐标定义为 Position 对象。 将此坐标指定为采用
[longitude,latitude]格式的数字数组。 或者,使用新的 atlas.data.Position(longitude, latitude) 来指定此坐标。提示
Position 类包含静态帮助器方法用于导入“纬度, 经度”格式的坐标。 往往可以将 atlas.data.Position.fromLatLng 方法替换为 Google Maps 代码中的
new google.maps.LatLng方法。 - Azure Maps 将样式与数据相区分,而不是在添加到地图的每个形状中指定样式信息。 数据存储在数据源中,并连接到呈现层。 Azure Maps 代码使用数据源来呈现数据。 此方法提供增强的性能优势。 此外,很多层支持数据驱动的样式,其中,业务逻辑可添加到层样式选项。 此项支持更改了单个形状根据形状中定义的属性在层中的呈现方式。
Web SDK 对比示例
此集合包含每个平台的代码示例,其中每个示例涵盖了常见用例。 此集合旨在帮助你将 Web 应用程序从 Google Maps V3 JavaScript SDK 迁移到 Azure Maps Web SDK。 与 Web 应用程序相关的代码示例以 JavaScript 提供。 但是,Azure Maps 还通过 npm 模块提供 TypeScript 定义作为其他选项。
主题
- 加载地图
- 本地化地图
- 设置地图视图
- 添加标记
- 添加自定义标记
- 添加折线
- 添加多边形
- 显示信息窗口
- 导入 GeoJSON 文件
- 标记聚类
- 添加热度地图
- 叠加图块层
- 显示交通情况数据
- 添加地面叠加层
- 将 KML 数据添加到地图
加载地图
这两个 SDK 采用相同的步骤来加载地图:
- 添加对 Map SDK 的引用。
- 在页面正文中添加
div标记,作为地图的占位符。 - 创建加载页面时要调用的 JavaScript 函数。
- 创建相应 map 类的实例。
一些重要差别
- Google Maps 要求在 API 的脚本引用中指定帐户密钥。 Azure Maps 的身份验证凭据指定为 map 类的选项。 此凭据可以是订阅密钥或 Microsoft Entra 信息。
- Google Maps 在 API 的脚本引用中接受一个回调函数,该函数用于调用初始化函数来加载地图。 使用 Azure Maps 时,应使用页面的 onload 事件。
- 引用呈现地图所用的
div元素时,Azure Maps 中的Map类只需要id值,而 Google Maps 需要HTMLElement对象。 - Azure Maps 中的坐标定义为 Position 对象,可将这些对象指定为采用
[longitude, latitude]格式的简单数字数组。 - Azure Maps 中的缩放级别比 Google Maps 中的缩放级别要低一级。 之所以存在这种差异,是因为这两个平台之间的图块系统大小有差别。
- Azure Maps 不会将任何导航控件添加到地图画布。 因此,默认情况下,地图中不提供缩放按钮和地图样式按钮。 但是,有一些控制选项可用于添加地图样式选取器、缩放按钮、罗盘或旋转控件以及俯仰角控件。
- Azure Maps 中添加了一个事件处理程序用于监视地图实例的
ready事件。 在地图加载完 WebGL 上下文以及所需的所有资源后,将激发此事件。 可将地图完成加载后你要运行的任何代码添加到此事件处理程序。
以下示例使用 Google Maps 加载中心点位于纽约坐标的地图。 经度:-73.985,纬度:40.747,地图缩放级别为 12。
前者:Google Maps
显示在某个位置居中并缩放的 Google 地图。
<!DOCTYPE html>
<html>
<head>
    <title></title>
    <meta charset="utf-8" />
    <meta http-equiv="x-ua-compatible" content="IE=Edge" />
    <meta name="viewport" content="width=device-width, initial-scale=1, shrink-to-fit=no" />

    <script type='text/javascript'>
        var map;

        function initMap() {
            map = new google.maps.Map(document.getElementById('myMap'), {
                center: new google.maps.LatLng(40.747, -73.985),
                zoom: 12
            });
        }
    </script>

    <!-- Google Maps Script Reference -->
    <script src="https://maps.googleapis.com/maps/api/js?callback=initMap&key={Your-Google-Maps-Key}" async defer></script>
</head>
<body>
    <div id='myMap' style='position:relative;width:600px;height:400px;'></div>
</body>
</html>
在浏览器中运行此代码会显示如下图所示的地图:

后者:Azure Maps
加载具有 Azure Maps 中的相同视图以及地图样式控件和缩放按钮的地图。
<!DOCTYPE html>
<html>
<head>
    <title></title>
    <meta charset="utf-8" />
    <meta http-equiv="x-ua-compatible" content="IE=Edge" />
    <meta name="viewport" content="width=device-width, initial-scale=1, shrink-to-fit=no" />

    <!-- Add references to the Azure Maps Map control JavaScript and CSS files. -->
    <link rel="stylesheet" href="https://atlas.microsoft.com/sdk/javascript/mapcontrol/3/atlas.min.css" type="text/css" />
    <script src="https://atlas.microsoft.com/sdk/javascript/mapcontrol/3/atlas.min.js"></script>

    <script type='text/javascript'>
        var map;

        function initMap() {
            map = new atlas.Map('myMap', {
                center: [-73.985, 40.747],  //Format coordinates as longitude, latitude.
                zoom: 11,   //Subtract the zoom level by one.

                //Specify authentication information when loading the map.
                authOptions: {
                    authType: 'subscriptionKey',
                    subscriptionKey: '<Your Azure Maps Key>'
                }
            });

            //Wait until the map resources are ready.
            map.events.add('ready', function () {
                //Add zoom controls to bottom right of map.
                map.controls.add(new atlas.control.ZoomControl(), {
                    position: 'bottom-right'
                });

                //Add map style control in top left corner of map.
                map.controls.add(new atlas.control.StyleControl(), {
                    position: 'top-left'
                });
            });
        }
    </script>
</head>
<body onload="initMap()">
    <div id='myMap' style='position:relative;width:600px;height:400px;'></div>
</body>
</html>
在浏览器中运行此代码会显示如下图所示的地图:

有关如何在 Web 应用中设置和使用 Azure Maps 地图控件的详细信息,请参阅使用 Azure Maps 地图控件。
注意
与 Google Maps 不同,Azure Maps 不需要指定初始中心点和缩放级别即可加载地图。 如果在加载地图时未提供此信息,Azure Maps 将尝试确定用户所在的城市。 它会在该位置居中并缩放地图。
更多资源:
- 如需详细了解用于旋转和倾斜地图视图的导航控件,请参阅将控件添加到地图。
本地化地图
如果受众遍布多个国家/地区或讲不同的语言,则本地化就非常重要。
前者:Google Maps
若要本地化 Google Maps,请添加语言和区域参数。
<script type="text/javascript" src=" https://maps.googleapis.com/maps/api/js?callback=initMap&key={api-Key}& language={language-code}®ion={region-code}" async defer></script>
下面是将语言设置为“fr-FR”的 Google Maps 示例。

后者:Azure Maps
Azure Maps 提供两种不同的方式来设置地图的语言和区域视图。 第一种做法是将此信息添加到全局 atlas 命名空间。 这会导致应用中的所有地图控件实例默认采用这些设置。 以下示例将语言设置为法语(“fr-FR”),将区域视图设置为“Auto”:
atlas.setLanguage('fr-FR');
atlas.setView('auto');
第二种做法是在加载地图时将此信息传入地图选项。 类似于下面这样:
map = new atlas.Map('myMap', {
    language: 'fr-FR',
    view: 'auto',

    authOptions: {
        authType: 'subscriptionKey',
        subscriptionKey: '<Your Azure Maps Key>'
    }
});
注意
使用 Azure Maps 时,可以在同一页面上加载使用不同语言和区域设置的多个地图实例。 还可以在加载地图后在其中更新这些设置。
有关支持的语言的详细信息,请参阅 Azure Maps 中的本地化支持。
下面是将语言设置为“fr”、将用户区域设置为“fr-FR”的 Azure Maps 示例。

设置地图视图
可以编程方式将 Azure Maps 和 Google Maps 中的动态地图移到新的地理位置。 为此,请调用 JavaScript 中的相应函数。 这些示例演示如何在 Google Maps 中使地图显示卫星航拍图像,将地图中心点置于某个位置,并将缩放级别更改为 15。 使用以下位置坐标:经度:-111.0225,纬度:35.0272。
注意
Google Maps 使用尺寸为 256 像素的图块,而 Azure Maps 则使用更大的 512 像素图块。 因此,在加载与 Google Maps 相同的地图区域时,Azure Maps 所需的网络请求数更少。 由于地图控件中图块金字塔的工作方式,Azure Maps 中更大的图块意味着在,在使用 Azure Maps 时,需要将 Google Maps 中使用的缩放级别减 1。 此算术运算确保 Azure Maps 中较大的图块呈现与 Google Maps 中相同的地图区域。
前者:Google Maps
使用 setOptions 方法移动 Google Maps 地图控件。 此方法允许指定地图的中心点和缩放级别。
map.setOptions({
    mapTypeId: google.maps.MapTypeId.SATELLITE,
    center: new google.maps.LatLng(35.0272, -111.0225),
    zoom: 15
});

后者:Azure Maps
在 Azure Maps 中,使用 setCamera 方法更改地图位置,使用 setStyle 方法更改地图样式。 Azure Maps 中的坐标采用“经度, 纬度”格式,缩放级别值需减 1。
map.setCamera({
    center: [-111.0225, 35.0272],
    zoom: 14
});

map.setStyle({
    style: 'satellite'
});

更多资源:
添加标记
在 Azure Maps 中,可通过多种方式在地图上呈现点数据:
- HTML 标记 – 使用传统的 DOM 元素呈现点。 HTML 标记支持拖动。
- 符号层 – 在 WebGL 上下文中使用图标或文本呈现点。
- 气泡层 – 在地图上以圆的形式呈现点。 可根据数据中的属性缩放圆的半径。
在 WebGL 上下文中呈现符号层和气泡层。 这两个层可在地图上呈现较大的点集。 这些层要求将数据存储在数据源中。 激发 ready 事件后,应将数据源和呈现层添加到地图中。 HTML 标记在页面中呈现为 DOM 元素,而不使用数据源。 页面中的 DOM 元素越多,页面加载速度越慢。 若要在地图上呈现好几百个点,我们建议改用某个呈现层。
让我们使用叠加的数字 10 作为标签,将一个标记添加到地图。 使用经度:-0.2,纬度:51.5。
前者:Google Maps
使用 Google Maps 时,请使用 google.maps.Marker 类将标记添加到地图,并将地图指定为选项之一。
//Create a marker and add it to the map.
var marker = new google.maps.Marker({
    position: new google.maps.LatLng(51.5, -0.2),
    label: '10',
    map: map
});

后者:使用 HTML 标记的 Azure Maps
在 Azure Maps 中,使用 HTML 标记在地图上显示某个点。 对于只需在地图上显示少量点的简单应用,建议使用 HTML 标记。 若要使用 HTML 标记,请创建 atlas.HtmlMarker 类的实例。 设置文本和位置选项,然后使用 map.markers.add 方法将标记添加到地图。
//Create a HTML marker and add it to the map.
map.markers.add(new atlas.HtmlMarker({
    text: '10',
    position: [-0.2, 51.5]
}));

后者:使用符号层的 Azure Maps
对于符号层,请将数据添加到数据源。 将数据源附加到层。 此外,在 ready 事件激发后,应将数据源和层添加到地图。 若要在符号上方呈现唯一的文本值,需将文本信息存储为数据点的属性。 必须在层的 textField 选项中引用该属性。 这种做法比使用 HTML 标记要略微繁琐一些,但具有性能优势。
<!DOCTYPE html>
<html>
<head>
    <title></title>
    <meta charset="utf-8" />
    <meta http-equiv="x-ua-compatible" content="IE=Edge" />
    <meta name="viewport" content="width=device-width, initial-scale=1, shrink-to-fit=no" />

    <!-- Add references to the Azure Maps Map control JavaScript and CSS files. -->
    <link rel="stylesheet" href="https://atlas.microsoft.com/sdk/javascript/mapcontrol/3/atlas.min.css" type="text/css" />
    <script src="https://atlas.microsoft.com/sdk/javascript/mapcontrol/3/atlas.min.js"></script>

    <script type='text/javascript'>
        var map, datasource;

        function initMap() {
            map = new atlas.Map('myMap', {
                center: [-0.2, 51.5],
                zoom: 9,

                authOptions: {
                    authType: 'subscriptionKey',
                    subscriptionKey: '<Your Azure Maps Key>'
                }
            });

            //Wait until the map resources are ready.
            map.events.add('ready', function () {

                //Create a data source and add it to the map.
                datasource = new atlas.source.DataSource();
                map.sources.add(datasource);

                //Create a point feature, add a property to store a label for it, and add it to the data source.
                datasource.add(new atlas.data.Feature(new atlas.data.Point([-0.2, 51.5]), {
                    label: '10'
                }));

                //Add a layer for rendering point data as symbols.
                map.layers.add(new atlas.layer.SymbolLayer(datasource, null, {
                    textOptions: {
                        //Use the label property to populate the text for the symbols.
                        textField: ['get', 'label'],
                        color: 'white',
                        offset: [0, -1]
                    }
                }));
            });
        }
    </script>
</head>
<body onload="initMap()">
    <div id='myMap' style='position:relative;width:600px;height:400px;'></div>
</body>
</html>

更多资源:
添加自定义标记
可以使用自定义图像来表示地图上的点。 以下地图使用自定义图像在地图上显示一个点。 该点的显示位置为纬度:51.5,经度:-0.2。 定位点将标记位置偏移,使图钉图标的点与地图上的正确位置对齐。

yellow-pushpin.png
前者:Google Maps
通过指定 Icon 对象来创建自定义标记,该对象包含图像的 url。 指定一个 anchor 点,该点将图钉图像点与地图上的坐标对齐。 Google Maps 中的定位点值相对于图像的左上角。
var marker = new google.maps.Marker({
    position: new google.maps.LatLng(51.5, -0.2),
    icon: {
        url: 'https://samples.azuremaps.com/images/icons/ylw-pushpin.png',
        anchor: new google.maps.Point(5, 30)
    },
    map: map
});

后者:使用 HTML 标记的 Azure Maps
若要自定义 HTML 标记,请将 HTML string 或 HTMLElement 传递给该标记的 htmlContent 选项。 使用 anchor 选项指定标记相对于位置坐标的位置。 将九个已定义的参照点之一分配到 anchor 选项。 这些定义的点为:“center”、“top”、“bottom”、“left”、“right”、“top-left”、“top-right”、“bottom-left”、“bottom-right”。 默认情况下,内容将定位到 html 内容的中下方。 若要更轻松地从 Google Maps 迁移代码,请将 anchor 设置为“top-left”,然后将 pixelOffset 选项与 Google Maps 中使用的相同偏移量结合使用。 Azure Maps 中的偏移方向与 Google Maps 中的偏移方向相反。 因此,需将偏移量乘以 -1。
提示
在显示不需要的图标的 Microsoft Edge 中,添加 pointer-events:none 作为 html 内容的样式可以禁用默认拖放行为。
map.markers.add(new atlas.HtmlMarker({
    htmlContent: '<img src="https://samples.azuremaps.com/images/icons/ylw-pushpin.png" style="pointer-events: none;" />',
    anchor: 'top-left',
    pixelOffset: [-5, -30],
    position: [-0.2, 51.5]
}));

后者:使用符号层的 Azure Maps
Azure Maps 中的符号层也支持自定义图像。 首先,将图像加载到地图资源,并为其分配唯一的 ID。 引用符号层中的图像。 使用 offset 选项使图像与地图上的正确点对齐。 使用 anchor 选项指定符号相对于位置坐标的位置。 使用九个已定义的参照点之一。 这些点为:“center”、“top”、“bottom”、“left”、“right”、“top-left”、“top-right”、“bottom-left”、“bottom-right”。 默认情况下,内容将定位到 html 内容的中下方。 若要更轻松地从 Google Maps 迁移代码,请将 anchor 设置为“top-left”,然后将 offset 选项与 Google Maps 中使用的相同偏移量结合使用。 Azure Maps 中的偏移方向与 Google Maps 中的偏移方向相反。 因此,需将偏移量乘以 -1。
<!DOCTYPE html>
<html>
<head>
    <title></title>
    <meta charset="utf-8" />
    <meta http-equiv="x-ua-compatible" content="IE=Edge" />
    <meta name="viewport" content="width=device-width, initial-scale=1, shrink-to-fit=no" />

    <!-- Add references to the Azure Maps Map control JavaScript and CSS files. -->
    <link rel="stylesheet" href="https://atlas.microsoft.com/sdk/javascript/mapcontrol/3/atlas.min.css" type="text/css" />
    <script src="https://atlas.microsoft.com/sdk/javascript/mapcontrol/3/atlas.min.js"></script>

    <script type='text/javascript'>
        var map, datasource;

        function initMap() {
            map = new atlas.Map('myMap', {
                center: [-0.2, 51.5],
                zoom: 9,
                authOptions: {
                    authType: 'subscriptionKey',
                    subscriptionKey: '<Your Azure Maps Key>'
                }
            });

            //Wait until the map resources are ready.
            map.events.add('ready', function () {

                //Load the custom image icon into the map resources.
                map.imageSprite.add('my-yellow-pin', 'https://samples.azuremaps.com/images/icons/ylw-pushpin.png').then(function () {

                    //Create a data source and add it to the map.
                    datasource = new atlas.source.DataSource();
                    map.sources.add(datasource);

                    //Create a point and add it to the data source.
                    datasource.add(new atlas.data.Point([-0.2, 51.5]));

                    //Add a layer for rendering point data as symbols.
                    map.layers.add(new atlas.layer.SymbolLayer(datasource, null, {
                        iconOptions: {
                            //Set the image option to the id of the custom icon that was loaded into the map resources.
                            image: 'my-yellow-pin',
                            anchor: 'top-left',
                            offset: [-5, -30]
                        }
                    }));
                });
            });
        }
    </script>
</head>
<body onload="initMap()">
    <div id='myMap' style='position:relative;width:600px;height:400px;'></div>
</body>
</html>
![]()
提示
若要呈现高级自定义点,请结合使用多个呈现层。 例如,假设你要使用多个图钉,而这些图钉在不同的彩色圆上使用相同的图标。 不需要针对每个颜色叠加层创建大量的图像,而可以在气泡层的顶部添加一个符号层。 使图钉引用同一个数据源。 这种做法比创建并维护大量不同的图像更为高效。
更多资源:
添加折线
使用折线来表示地图上的线条或路径。 让我们在地图上创建虚线折线。
前者:Google Maps
Polyline 类接受一组选项。 将坐标数组传入折线的 path 选项。
//Get the center of the map.
var center = map.getCenter();

//Define a symbol using SVG path notation, with an opacity of 1.
var lineSymbol = {
    path: 'M 0,-1 0,1',
    strokeOpacity: 1,
    scale: 4
};

//Create the polyline.
var line = new google.maps.Polyline({
    path: [
        center,
        new google.maps.LatLng(center.lat() - 0.5, center.lng() - 1),
        new google.maps.LatLng(center.lat() - 0.5, center.lng() + 1)
    ],
    strokeColor: 'red',
    strokeOpacity: 0,
    strokeWeight: 4,
    icons: [{
        icon: lineSymbol,
        offset: '0',
        repeat: '20px'
    }]
});

//Add the polyline to the map.
line.setMap(map);

后者:Azure Maps
折线称为 LineString 或 MultiLineString 对象。 可将这些对象添加到数据源,并使用线条层来呈现。 将 LineString 添加到数据源,然后将数据源添加到 LineLayer 以呈现它。
//Get the center of the map.
var center = map.getCamera().center;

//Create a data source and add it to the map.
var datasource = new atlas.source.DataSource();
map.sources.add(datasource);

//Create a line and add it to the data source.
datasource.add(new atlas.data.LineString([
    center,
    [center[0] - 1, center[1] - 0.5],
    [center[0] + 1, center[1] - 0.5]
]));

//Add a layer for rendering line data.
map.layers.add(new atlas.layer.LineLayer(datasource, null, {
    strokeColor: 'red',
    strokeWidth: 4,
    strokeDashArray: [3, 3]
}));

更多资源:
添加多边形
Azure Maps 和 Google Maps 为多边形提供类似的支持。 多边形用于表示地图上的某个区域。 以下示例演示如何创建一个多边形,该多边形基于地图的中点坐标构成一个三角形。
前者:Google Maps
Polygon 类接受一组选项。 将坐标数组传入多边形的 paths 选项。
//Get the center of the map.
var center = map.getCenter();

//Create a polygon.
var polygon = new google.maps.Polygon({
    paths: [
        center,
        new google.maps.LatLng(center.lat() - 0.5, center.lng() - 1),
        new google.maps.LatLng(center.lat() - 0.5, center.lng() + 1),
        center
    ],
    strokeColor: 'red',
    strokeWeight: 2,
    fillColor: 'rgba(0, 255, 0, 0.5)'
});

//Add the polygon to the map
polygon.setMap(map);

后者:Azure Maps
将 Polygon 或 MultiPolygon 对象添加到数据源。 使用层在地图上呈现对象。 使用多边形层呈现多边形的区域。 使用线条层呈现多边形的轮廓。
//Get the center of the map.
var center = map.getCamera().center;

//Create a data source and add it to the map.
datasource = new atlas.source.DataSource();
map.sources.add(datasource);

//Create a polygon and add it to the data source.
datasource.add(new atlas.data.Polygon([
    center,
    [center[0] - 1, center[1] - 0.5],
    [center[0] + 1, center[1] - 0.5],
    center
]));

//Add a polygon layer for rendering the polygon area.
map.layers.add(new atlas.layer.PolygonLayer(datasource, null, {
    fillColor: 'rgba(0, 255, 0, 0.5)'
}));

//Add a line layer for rendering the polygon outline.
map.layers.add(new atlas.layer.LineLayer(datasource, null, {
    strokeColor: 'red',
    strokeWidth: 2
}));

更多资源:
显示信息窗口
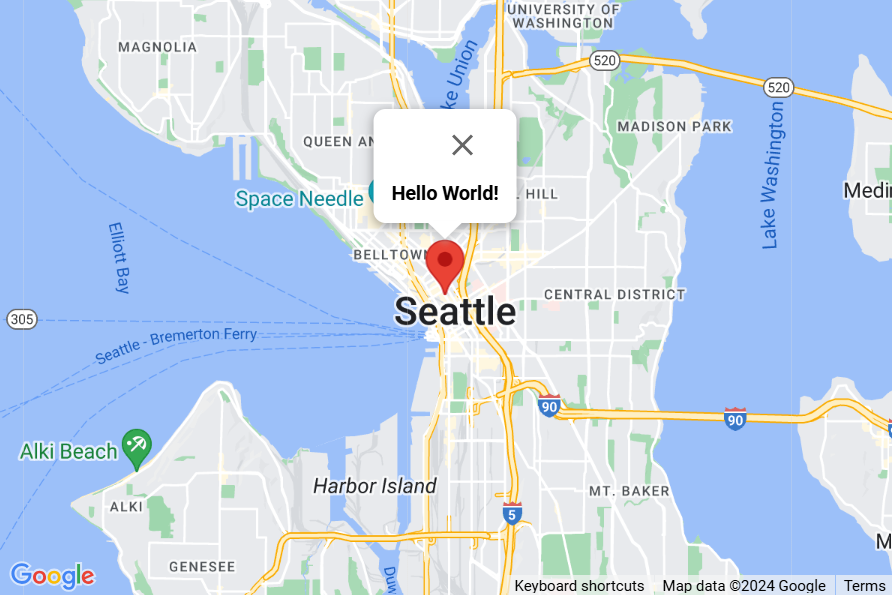
在 Google Maps 中,实体的其他信息可以作为 google.maps.InfoWindow 类显示在地图上。 在 Azure Maps 中,可以使用 atlas.Popup 类实现此功能。 下面的示例将一个标记添加到地图。 单击该标记会显示信息窗口或弹出窗口。
前者:Google Maps
使用 google.maps.InfoWindow 构造函数实例化信息窗口。
//Add a marker in which to display an infowindow for.
var marker = new google.maps.Marker({
    position: new google.maps.LatLng(47.6, -122.33),
    map: map
});

//Create an infowindow.
var infowindow = new google.maps.InfoWindow({
    content: '<div style="padding:5px"><b>Hello World!</b></div>'
});

//Add a click event to the marker to open the infowindow.
marker.addListener('click', function () {
    infowindow.open(map, marker);
});
后者:Azure Maps
让我们使用弹出窗口显示有关位置的附加信息。 将 HTML string 或 HTMLElement 对象传递给弹出窗口的 content 选项。 如果需要,可以独立于任何形状显示弹出窗口。 因此,需要为弹出窗口指定 position 值 指定 position 值。 若要显示弹出窗口,请调用 open 方法,并传递要在其中显示弹出窗口的 map。
//Add a marker to the map in which to display a popup for.
var marker = new atlas.HtmlMarker({
    position: [-122.33, 47.6]
});

//Add the marker to the map.
map.markers.add(marker);

//Create a popup.
var popup = new atlas.Popup({
    content: '<div style="padding:5px"><b>Hello World!</b></div>',
    position: [-122.33, 47.6],
    pixelOffset: [0, -35]
});

//Add a click event to the marker to open the popup.
map.events.add('click', marker, function () {
    //Open the popup
    popup.open(map);
});

注意
可以使用符号、气泡、线条或多边形层实现相同的目的,只需将该层传递给地图事件代码即可,而不要使用标记。
更多资源:
导入 GeoJSON 文件
Google Maps 支持通过 google.maps.Data 类加载 GeoJSON 数据并动态设置其样式。 此类的功能在很大程度上与 Azure Maps 的数据驱动样式相同。 但存在一个重要的差别。 使用 Google Maps 时,需指定回调函数。 此外,需指定业务逻辑,用于设置它在 UI 线程中单独处理的每个特征的样式。 但在 Azure Maps 中,层支持将数据驱动的表达式指定为样式选项。 在呈现时,这些表达式将在单独的线程中处理。 Azure Maps 方法可以提高呈现性能。 需要快速呈现较大的数据集时,这项优势就很明显。
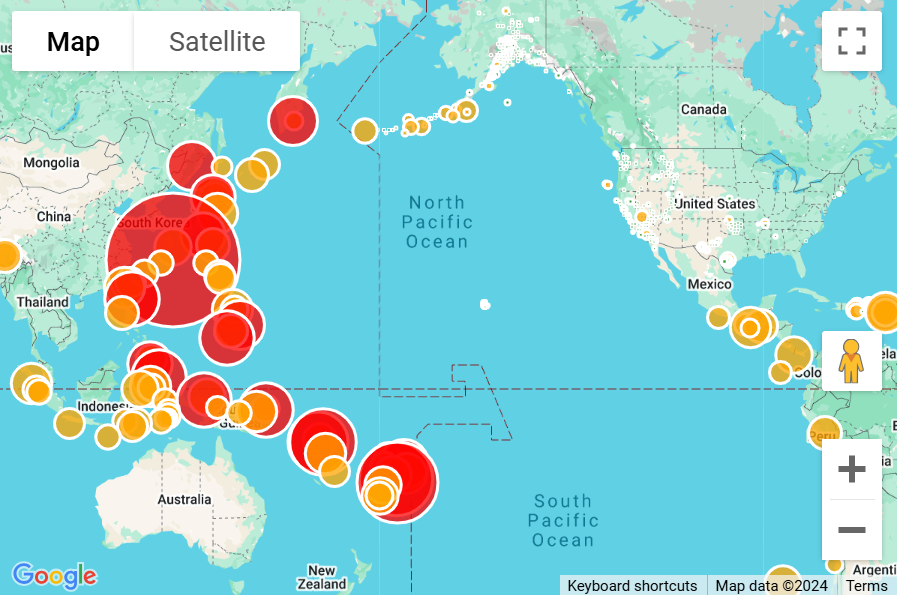
以下示例从 USGS 加载过去 7 天内发生的所有地震的 GeoJSON 源, 地震数据在地图上以缩放圆的形式呈现。 每个圆的颜色和比例基于每次地震的震级,此震级数据存储在数据集中每个特征的 "mag" 属性中。 如果震级大于或等于 5,则圆为红色。 如果震级大于或等于 3 但小于 5,则圆为橙色。 如果震级小于 3,则圆为绿色。 每个圆的半径是震级的幂乘以 0.1。
前者:Google Maps
在 map.data.setStyle 方法中指定单个回调函数。 在该回调函数中,将业务逻辑应用到每个特征。 使用 map.data.loadGeoJson 方法加载 GeoJSON 源。
<!DOCTYPE html>
<html>
<head>
    <title></title>
    <meta charset="utf-8" />
    <meta http-equiv="x-ua-compatible" content="IE=Edge" />
    <meta name="viewport" content="width=device-width, initial-scale=1, shrink-to-fit=no" />

    <script type='text/javascript'>
        var map;
        var earthquakeFeed = 'https://earthquake.usgs.gov/earthquakes/feed/v1.0/summary/all_week.geojson';

        function initMap() {
            map = new google.maps.Map(document.getElementById('myMap'), {
                center: new google.maps.LatLng(20, -160),
                zoom: 2
            });

            //Define a callback to style each feature.
            map.data.setStyle(function (feature) {

                //Extract the 'mag' property from the feature.
                var mag = parseFloat(feature.getProperty('mag'));

                //Set the color value to 'green' by default.
                var color = 'green';

                //If the mag value is greater than 5, set the color to 'red'.
                if (mag >= 5) {
                    color = 'red';
                }
                //If the mag value is greater than 3, set the color to 'orange'.
                else if (mag >= 3) {
                    color = 'orange';
                }

                return /** @type {google.maps.Data.StyleOptions} */({
                    icon: {
                        path: google.maps.SymbolPath.CIRCLE,

                        //Scale the radius based on an exponential of the 'mag' value.
                        scale: Math.exp(mag) * 0.1,
                        fillColor: color,
                        fillOpacity: 0.75,
                        strokeWeight: 2,
                        strokeColor: 'white'
                    }
                });
            });

            //Load the data feed.
            map.data.loadGeoJson(earthquakeFeed);
        }
    </script>

    <!-- Google Maps Script Reference -->
    <script src="https://maps.googleapis.com/maps/api/js?callback=initMap&key={Your-Google-Maps-Key}" async defer></script>
</head>
<body>
    <div id='myMap' style='position:relative;width:600px;height:400px;'></div>
</body>
</html>
后者:Azure Maps
GeoJSON 是 Azure Maps 中的基础数据类型。 使用 datasource.importFromUrl 方法将其导入到数据源中。 使用气泡层。 气泡层提供基于数据源中特征的属性呈现缩放圆的功能。 它不使用回调函数,而是将业务逻辑转换为表达式,并将其传入样式选项。 表达式定义业务逻辑的工作方式。 可将表达式传入另一个线程,并针对特征数据进行评估。 可将多个数据源和层添加到 Azure Maps,其中每个数据源和层具有不同的业务逻辑。 使用此功能可以通过不同的方式在地图上呈现多个数据集。
<!DOCTYPE html>
<html>
<head>
    <title></title>
    <meta charset="utf-8" />
    <meta http-equiv="x-ua-compatible" content="IE=Edge" />
    <meta name="viewport" content="width=device-width, initial-scale=1, shrink-to-fit=no" />

    <!-- Add references to the Azure Maps Map control JavaScript and CSS files. -->
    <link rel="stylesheet" href="https://atlas.microsoft.com/sdk/javascript/mapcontrol/3/atlas.min.css" type="text/css" />
    <script src="https://atlas.microsoft.com/sdk/javascript/mapcontrol/3/atlas.min.js"></script>

    <script type='text/javascript'>
        var map;
        var earthquakeFeed = 'https://earthquake.usgs.gov/earthquakes/feed/v1.0/summary/all_week.geojson';

        function initMap() {
            //Initialize a map instance.
            map = new atlas.Map('myMap', {
                center: [-160, 20],
                zoom: 1,

                //Add your Azure Maps subscription key to the map SDK. Get an Azure Maps key at https://azure.com/maps
                authOptions: {
                    authType: 'subscriptionKey',
                    subscriptionKey: '<Your Azure Maps Key>'
                }
            });

            //Wait until the map resources are ready.
            map.events.add('ready', function () {

                //Create a data source and add it to the map.
                datasource = new atlas.source.DataSource();
                map.sources.add(datasource);

                //Load the earthquake data.
                datasource.importDataFromUrl(earthquakeFeed);

                //Create a layer to render the data points as scaled circles.
                map.layers.add(new atlas.layer.BubbleLayer(datasource, null, {
                    //Make the circles semi-transparent.
                    opacity: 0.75,

                    color: [
                        'case',

                        //If the mag value is greater than 5, return 'red'.
                        ['>=', ['get', 'mag'], 5],
                        'red',

                        //If the mag value is greater than 3, return 'orange'.
                        ['>=', ['get', 'mag'], 3],
                        'orange',

                        //Return 'green' as a fallback.
                        'green'
                    ],

                    //Scale the radius based on an exponential of the 'mag' value.
                    radius: ['*', ['^', ['e'], ['get', 'mag']], 0.1]
                }));
            });
        }
    </script>
</head>
<body onload="initMap()">
    <div id='myMap' style='position:relative;width:600px;height:400px;'></div>
</body>
</html>

更多资源:
标记聚类
当地图上出现大量数据点时,点可能会重叠,使地图看起来混乱且难以阅读和使用。 聚类点数据是将相邻的数据点合并在一起,并在地图上将其作为单个聚类数据点进行呈现的过程。 当用户放大地图时,聚类的各个数据点将会分开。 对数据点进行聚类分析可改善用户体验和地图性能。
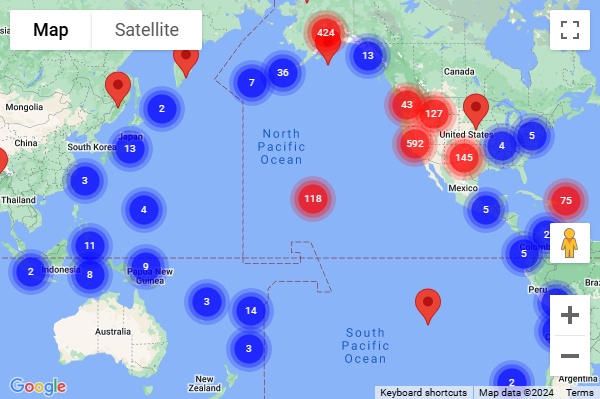
以下示例代码加载过去一周的地震数据的 GeoJSON 源,并将其添加到地图。 聚类呈现为缩放的彩色圆。 圆的颜色和比例取决于它们包含的点数。
注意
Google Maps 和 Azure Maps 使用的聚类算法略有不同。 因此,聚类中的点分布有时也不同。
前者:Google Maps
使用 MarkerCluster 库来聚类标记。 聚类图标限制为在名称中包含数字 1 到 5 的图像。 它们驻留在同一目录中。
<!DOCTYPE html>
<html>
<head>
    <title></title>
    <meta charset="utf-8" />
    <meta http-equiv="x-ua-compatible" content="IE=Edge" />
    <meta name="viewport" content="width=device-width, initial-scale=1, shrink-to-fit=no" />

    <script type='text/javascript'>
        var map;
        var earthquakeFeed = 'https://earthquake.usgs.gov/earthquakes/feed/v1.0/summary/all_week.geojson';

        function initMap() {
            map = new google.maps.Map(document.getElementById('myMap'), {
                center: new google.maps.LatLng(20, -160),
                zoom: 2
            });

            //Download the GeoJSON data.
            fetch(earthquakeFeed)
                .then(function (response) {
                    return response.json();
                }).then(function (data) {
                    //Loop through the GeoJSON data and create a marker for each data point.
                    var markers = [];

                    for (var i = 0; i < data.features.length; i++) {

                        markers.push(new google.maps.Marker({
                            position: new google.maps.LatLng(data.features[i].geometry.coordinates[1], data.features[i].geometry.coordinates[0])
                        }));
                    }

                    //Create a marker clusterer instance and tell it where to find the cluster icons.
                    var markerCluster = new MarkerClusterer(map, markers,
                        { imagePath: 'https://developers.google.com/maps/documentation/javascript/examples/markerclusterer/m' });
                });
        }
    </script>

    <!-- Load the marker cluster library. -->
    <script src="https://developers.google.com/maps/documentation/javascript/examples/markerclusterer/markerclusterer.js"></script>

    <!-- Google Maps Script Reference -->
    <script src="https://maps.googleapis.com/maps/api/js?callback=initMap&key={Your-Google-Maps-Key}" async defer></script>
</head>
<body>
    <div id='myMap' style='position:relative;width:600px;height:400px;'></div>
</body>
</html>
后者:Azure Maps
在数据源中添加和管理数据。 连接数据源和层,然后呈现数据。 Azure Maps 中的 DataSource 类提供多个聚类选项。
cluster– 告知数据源聚类点数据。clusterRadius- 要将其中的点聚类到一起的半径(以像素为单位)。clusterMaxZoom- 进行聚类的最大缩放级别。 如果放大到此级别以上,将以符号形式呈现所有点。clusterProperties- 定义自定义属性,这些属性是使用表达式针对每个聚类中的、已添加到每个聚类点的属性中的所有点计算的。
启用聚类后,数据源会将已聚类和未聚类的数据点发送到层进行呈现。 数据源能够聚类数十万个数据点。 聚类的数据点包含以下属性:
| 属性名称 | 类型 | 说明 |
|---|---|---|
cluster |
boolean | 指示特征是否表示聚类。 |
cluster_id |
字符串 | 可与数据源 getClusterExpansionZoom、getClusterChildren 和 getClusterLeaves 方法结合使用的群集唯一 ID。 |
point_count |
数字 | 聚类包含的点数。 |
point_count_abbreviated |
字符串 | 用于缩写过长的 point_count 值的字符串。 (例如,将 4,000 缩写为 4K) |
DataSource 类包含以下帮助器函数,用于通过 cluster_id 访问有关聚类的其他信息。
| 方法 | 返回类型 | 说明 |
|---|---|---|
getClusterChildren(clusterId: number) |
Promise<Array<Feature<Geometry, any> | Shape>> | 在下一个缩放级别检索给定聚类的子级。 这些子级可以是形状和子群集的组合。 子聚类是具有与 ClusteredProperties 匹配的属性的特征。 |
getClusterExpansionZoom(clusterId: number) |
Promise<number> | 计算聚类开始展开或分解的缩放级别。 |
getClusterLeaves(clusterId: number, limit: number, offset: number) |
Promise<Array<Feature<Geometry, any> | Shape>> | 检索聚类中的所有点。 设置 limit 可返回点的子集,使用 offset 可逐页呈现点。 |
在地图上呈现聚类的数据时,通常最好是使用两个或更多个层。 以下示例使用三个层。 一个气泡层,用于根据聚类的大小绘制缩放的彩色圆。 一个符号层,用于将聚类大小呈现为文本。 此层使用另一个符号层来呈现未聚类的点。 如需详细了解用于呈现聚类数据的其他方法,请参阅在 Web SDK 中聚类点数据。
使用 DataSource 类中的 importDataFromUrl 函数,在 Azure Maps 地图中直接导入 GeoJSON 数据。
<!DOCTYPE html>
<html>
<head>
    <title></title>
    <meta charset="utf-8" />
    <meta http-equiv="x-ua-compatible" content="IE=Edge" />
    <meta name="viewport" content="width=device-width, initial-scale=1, shrink-to-fit=no" />

    <!-- Add references to the Azure Maps Map control JavaScript and CSS files. -->
    <link rel="stylesheet" href="https://atlas.microsoft.com/sdk/javascript/mapcontrol/3/atlas.min.css" type="text/css" />
    <script src="https://atlas.microsoft.com/sdk/javascript/mapcontrol/3/atlas.min.js"></script>

    <script type='text/javascript'>
        var map, datasource;
        var earthquakeFeed = 'https://earthquake.usgs.gov/earthquakes/feed/v1.0/summary/all_week.geojson';

        function initMap() {
            //Initialize a map instance.
            map = new atlas.Map('myMap', {
                center: [-160, 20],
                zoom: 1,

                //Add your Azure Maps subscription key to the map SDK. Get an Azure Maps key at https://azure.com/maps
                authOptions: {
                    authType: 'subscriptionKey',
                    subscriptionKey: '<Your Azure Maps Key>'
                }
            });

            //Wait until the map resources are ready.
            map.events.add('ready', function () {

                //Create a data source and add it to the map.
                datasource = new atlas.source.DataSource(null, {
                    //Tell the data source to cluster point data.
                    cluster: true
                });
                map.sources.add(datasource);

                //Create layers for rendering clusters, their counts and unclustered points and add the layers to the map.
                map.layers.add([
                    //Create a bubble layer for rendering clustered data points.
                    new atlas.layer.BubbleLayer(datasource, null, {
                        //Scale the size of the clustered bubble based on the number of points in the cluster.
                        radius: [
                            'step',
                            ['get', 'point_count'],
                            20,         //Default of 20 pixel radius.
                            100, 30,    //If point_count >= 100, radius is 30 pixels.
                            750, 40     //If point_count >= 750, radius is 40 pixels.
                        ],

                        //Change the color of the cluster based on the value on the point_cluster property of the cluster.
                        color: [
                            'step',
                            ['get', 'point_count'],
                            'lime',            //Default to lime green.
                            100, 'yellow',     //If the point_count >= 100, color is yellow.
                            750, 'red'         //If the point_count >= 750, color is red.
                        ],
                        strokeWidth: 0,
                        filter: ['has', 'point_count'] //Only rendered data points which have a point_count property, which clusters do.
                    }),

                    //Create a symbol layer to render the count of locations in a cluster.
                    new atlas.layer.SymbolLayer(datasource, null, {
                        iconOptions: {
                            image: 'none' //Hide the icon image.
                        },
                        textOptions: {
                            textField: ['get', 'point_count_abbreviated'],
                            offset: [0, 0.4]
                        }
                    }),

                    //Create a layer to render the individual locations.
                    new atlas.layer.SymbolLayer(datasource, null, {
                        filter: ['!', ['has', 'point_count']] //Filter out clustered points from this layer.
                    })
                ]);

                //Retrieve a GeoJSON data set and add it to the data source.
                datasource.importDataFromUrl(earthquakeFeed);
            });
        }
    </script>
</head>
<body onload="initMap()">
    <div id='myMap' style='position:relative;width:600px;height:400px;'></div>
</body>
</html>


更多资源:
添加热度地图
热度地图也称为点密度地图,是一种数据可视化效果。 它们使用各种颜色来表示数据密度。 此外,它们经常用于在地图上显示数据“热点”。 热度地图能够很好地呈现较大的点数据集。
以下示例从 USGS 加载过去一个月发生的所有地震的 GeoJSON 源,并将其呈现为加权的热度地图。 "mag" 属性用作权重。
前者:Google Maps
若要创建热度地图,请通过将 &libraries=visualization 添加到 API 脚本 URL 来加载“可视化”库。 Google Maps 中的热度地图层不直接支持 GeoJSON 数据。 首先下载数据,并将其转换为加权数据点的数组。
<!DOCTYPE html>
<html>
<head>
    <title></title>
    <meta charset="utf-8" />
    <meta http-equiv="x-ua-compatible" content="IE=Edge" />
    <meta name="viewport" content="width=device-width, initial-scale=1, shrink-to-fit=no" />

    <script type='text/javascript'>
        var map;
        var earthquakeFeed = 'https://earthquake.usgs.gov/earthquakes/feed/v1.0/summary/all_month.geojson';

        function initMap() {

            var map = new google.maps.Map(document.getElementById('myMap'), {
                center: new google.maps.LatLng(20, -160),
                zoom: 2,
                mapTypeId: 'satellite'
            });

            //Download the GeoJSON data.
            fetch(url).then(function (response) {
                return response.json();
            }).then(function (res) {
                var points = getDataPoints(res);

                var heatmap = new google.maps.visualization.HeatmapLayer({
                    data: points
                });
                heatmap.setMap(map);
            });
        }

        function getDataPoints(geojson, weightProp) {
            var points = [];

            for (var i = 0; i < geojson.features.length; i++) {
                var f = geojson.features[i];

                if (f.geometry.type === 'Point') {
                    points.push({
                        location: new google.maps.LatLng(f.geometry.coordinates[1], f.geometry.coordinates[0]),
                        weight: f.properties[weightProp]
                    });
                }
            }

            return points;
        }
    </script>

    <!-- Google Maps Script Reference -->
    <script src="https://maps.googleapis.com/maps/api/js?callback=initMap&key={Your-Google-Maps-Key}&libraries=visualization" async defer></script>
</head>
<body>
    <div id='myMap' style='position:relative;width:600px;height:400px;'></div>
</body>
</html>

后者:Azure Maps
将 GeoJSON 数据载入数据源,然后将数据源连接到热度地图层。 可以使用表达式将用于权重的属性传入 weight 选项。 使用 DataSource 类中的 importDataFromUrl 函数,将 GeoJSON 数据直接导入 Azure Maps。
<!DOCTYPE html>
<html>
<head>
    <title></title>
    <meta charset="utf-8" />
    <meta http-equiv="x-ua-compatible" content="IE=Edge" />
    <meta name="viewport" content="width=device-width, initial-scale=1, shrink-to-fit=no" />

    <!-- Add references to the Azure Maps Map control JavaScript and CSS files. -->
    <link rel="stylesheet" href="https://atlas.microsoft.com/sdk/javascript/mapcontrol/3/atlas.min.css" type="text/css" />
    <script src="https://atlas.microsoft.com/sdk/javascript/mapcontrol/3/atlas.min.js"></script>

    <script type='text/javascript'>
        var map;
        var earthquakeFeed = 'https://earthquake.usgs.gov/earthquakes/feed/v1.0/summary/all_month.geojson';

        function initMap() {
            //Initialize a map instance.
            map = new atlas.Map('myMap', {
                center: [-160, 20],
                zoom: 1,
                style: 'satellite',

                //Add your Azure Maps subscription key to the map SDK. Get an Azure Maps key at https://azure.com/maps
                authOptions: {
                    authType: 'subscriptionKey',
                    subscriptionKey: '<Your Azure Maps Key>'
                }
            });

            //Wait until the map resources are ready.
            map.events.add('ready', function () {

                //Create a data source and add it to the map.
                datasource = new atlas.source.DataSource();
                map.sources.add(datasource);

                //Load the earthquake data.
                datasource.importDataFromUrl(earthquakeFeed);

                //Create a layer to render the data points as a heat map.
                map.layers.add(new atlas.layer.HeatMapLayer(datasource, null, {
                    weight: ['get', 'mag'],
                    intensity: 0.005,
                    opacity: 0.65,
                    radius: 10
                }));
            });
        }
    </script>
</head>
<body onload="initMap()">
    <div id='myMap' style='position:relative;width:600px;height:400px;'></div>
</body>
</html>

更多资源:
叠加图块层
Azure Maps 中的图块层在 Google Maps 中称为图像叠加层。 图块层可让你叠加较大图像,这些图像已分解成与地图图块系统相符的较小图块式图像。 这是叠加大型图像或大型数据集的常用方法。
以下示例叠加爱荷华州立大学环境气象网提供的气象雷达图块层。
前者:Google Maps
在 Google Maps 中,可以使用 google.maps.ImageMapType 类创建图块层。
map.overlayMapTypes.insertAt(0, new google.maps.ImageMapType({
    getTileUrl: function (coord, zoom) {
        return "https://mesonet.agron.iastate.edu/cache/tile.py/1.0.0/nexrad-n0q-900913/" + zoom + "/" + coord.x + "/" + coord.y;
    },
    tileSize: new google.maps.Size(256, 256),
    opacity: 0.8
}));

后者:Azure Maps
可以像添加任何其他层一样将图块层添加到地图中。 使用包含 x 轴、y 轴、缩放比例占位符的带格式 URL;{x}、{y}、{z} 用于告知层要在何处访问图块。 Azure Maps 图块层还支持 {quadkey}、{bbox-epsg-3857} 和 {subdomain} 占位符。
提示
在 Azure Maps 中,可以轻松地在其他层下面呈现层,包括基础地图层。 通常,最好是在地图标签下面呈现图块层,以便于阅读。 map.layers.add 方法采用另一个参数,该参数是要在其中插入新层的层的 ID。 若要在地图标签下面插入图块层,请使用以下代码:map.layers.add(myTileLayer, "labels");
//Create a tile layer and add it to the map below the label layer.
map.layers.add(new atlas.layer.TileLayer({
    tileUrl: 'https://mesonet.agron.iastate.edu/cache/tile.py/1.0.0/nexrad-n0q-900913/{z}/{x}/{y}.png',
    opacity: 0.8,
    tileSize: 256
}), 'labels');

提示
可以使用地图的 transformRequest 选项捕获图块请求。 这样,就可以根据需要修改请求或在其中添加标头。
更多资源:
显示交通情况数据
在 Azure Maps 和 Google Maps 中都可以叠加交通状况数据。
前者:Google Maps
使用交通状况层将交通状况数据叠加到地图中。
var trafficLayer = new google.maps.TrafficLayer();
trafficLayer.setMap(map);
后者:Azure Maps
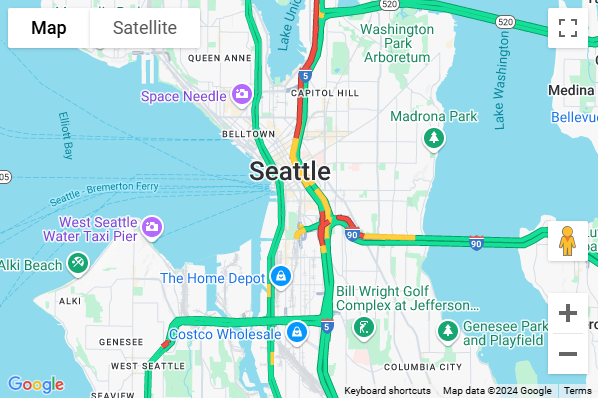
Azure Maps 提供用于显示交通状况的多种不同选项。 在地图上以图标形式显示交通事件,例如道路封闭和事故。 在地图上叠加交通流量和带颜色编码的道路。 可以根据公布的限速、相对于正常的预期延误时间或绝对延误时间修改颜色。 Azure Maps 中的事件数据每隔一分钟更新一次,交通流量数据每隔两分钟更新一次。
为 setTraffic 选项分配所需的值。
map.setTraffic({
    incidents: true,
    flow: 'relative'
});

如果在 Azure Maps 中选择其中一个流量图标,则会在弹出窗口中显示更多信息。

更多资源:
添加地面叠加层
Azure Maps 和 Google Maps 都支持在地图上叠加地理围栏图像。 平移和缩放地图时,地理围栏图像将会移动和缩放。 在 Google Maps 中,地理围栏图像称为地面叠加层,而在 Azure Maps 中则称为图像层。 它们非常适合用于建筑楼面布置图、叠加旧地图或无人机拍图。
前者:Google Maps
指定要叠加的图像的 URL,以及用于在地图上限定图像的边界框。 此示例在地图上叠加 1922 年新泽西州纽瓦克市的地图图像。
<!DOCTYPE html>
<html>
<head>
    <title></title>
    <meta charset="utf-8" />
    <meta http-equiv="x-ua-compatible" content="IE=Edge" />
    <meta name="viewport" content="width=device-width, initial-scale=1, shrink-to-fit=no" />

    <script type='text/javascript'>
        var map, historicalOverlay;

        function initMap() {
            map = new google.maps.Map(document.getElementById('myMap'), {
                center: new google.maps.LatLng(40.740, -74.18),
                zoom: 12
            });

            var imageBounds = {
                north: 40.773941,
                south: 40.712216,
                east: -74.12544,
                west: -74.22655
            };

            historicalOverlay = new google.maps.GroundOverlay(
                'https://www.lib.utexas.edu/maps/historical/newark_nj_1922.jpg',
                imageBounds);
            historicalOverlay.setMap(map);
        }
    </script>

    <!-- Google Maps Script Reference -->
    <script src="https://maps.googleapis.com/maps/api/js?callback=initMap&key={Your-Google-Maps-Key}" async defer></script>
</head>
<body>
    <div id="myMap" style="position:relative;width:600px;height:400px;"></div>
</body>
</html>
在浏览器中运行此代码会显示如下图所示的地图:

后者:Azure Maps
使用 atlas.layer.ImageLayer 类叠加地理围栏图像。 此类需要指定图像的 URL,以及该图像四个角的坐标。 该图像必须位于同一个域中,或已启用 CORs。
提示
如果只有东南西北坐标和旋转信息,而没有图像每个角的坐标,可以使用静态 atlas.layer.ImageLayer.getCoordinatesFromEdges 方法。
<!DOCTYPE html>
<html>
<head>
    <title></title>
    <meta charset="utf-8" />
    <meta http-equiv="x-ua-compatible" content="IE=Edge" />
    <meta name="viewport" content="width=device-width, initial-scale=1, shrink-to-fit=no" />

    <!-- Add references to the Azure Maps Map control JavaScript and CSS files. -->
    <link rel="stylesheet" href="https://atlas.microsoft.com/sdk/javascript/mapcontrol/3/atlas.min.css" type="text/css" />
    <script src="https://atlas.microsoft.com/sdk/javascript/mapcontrol/3/atlas.min.js"></script>

    <script type='text/javascript'>
        var map;

        function initMap() {
            //Initialize a map instance.
            map = new atlas.Map('myMap', {
                center: [-74.18, 40.740],
                zoom: 12,

                //Add your Azure Maps subscription key to the map SDK. Get an Azure Maps key at https://azure.com/maps
                authOptions: {
                    authType: 'subscriptionKey',
                    subscriptionKey: '<Your Azure Maps Key>'
                }
            });

            //Wait until the map resources are ready.
            map.events.add('ready', function () {

                //Create an image layer and add it to the map.
                map.layers.add(new atlas.layer.ImageLayer({
                    url: 'newark_nj_1922.jpg',
                    coordinates: [
                        [-74.22655, 40.773941], //Top Left Corner
                        [-74.12544, 40.773941], //Top Right Corner
                        [-74.12544, 40.712216], //Bottom Right Corner
                        [-74.22655, 40.712216]  //Bottom Left Corner
                    ]
                }));
            });
        }
    </script>
</head>
<body onload="initMap()">
    <div id='myMap' style='position:relative;width:600px;height:400px;'></div>
</body>
</html>

更多资源:
将 KML 数据添加到地图
Azure Maps 和 Google Maps 都可以在地图上导入和呈现 KML、KMZ 与 GeoRSS 数据。 Azure Maps 还支持 GPX、GML、空间 CSV 文件、GeoJSON、已知文本 (WKT)、Web 地图服务 (WMS)、Web 地图图块服务 (WMTS) 和 Web 特征服务 (WFS)。 Azure Maps 在本地将文件读取到内存中,在大多数情况下,可以处理比较大的 KML 文件。
前者:Google Maps
<!DOCTYPE html>
<html>
<head>
    <title></title>
    <meta charset="utf-8" />
    <meta http-equiv="x-ua-compatible" content="IE=Edge" />
    <meta name="viewport" content="width=device-width, initial-scale=1, shrink-to-fit=no" />

    <script type='text/javascript'>
        var map, historicalOverlay;

        function initMap() {
            map = new google.maps.Map(document.getElementById('myMap'), {
                center: new google.maps.LatLng(0, 0),
                zoom: 1
            });

             var layer = new google.maps.KmlLayer({
              url: 'https://googlearchive.github.io/js-v2-samples/ggeoxml/cta.kml',
              map: map
            });
        }
    </script>

    <!-- Google Maps Script Reference -->
    <script src="https://maps.googleapis.com/maps/api/js?callback=initMap&key={Your-Google-Maps-Key}" async defer></script>
</head>
<body>
    <div id="myMap" style="position:relative;width:600px;height:400px;"></div>
</body>
</html>
在浏览器中运行此代码会显示如下图所示的地图:

后者:Azure Maps
在 Azure Maps 中,GeoJSON 是在 Web SDK 中使用的主要数据格式,可在其中使用空间 IO 模块轻松集成更多空间数据格式。 此模块提供读取和写入空间数据的功能,并且包含一个简单的数据层,可轻松地从上述任何空间数据格式呈现数据。 若要读取空间数据文件中的数据,请在 atlas.io.read 函数中传入一个 URL,或者字符串或 Blob 形式的原始数据。 这返回该文件中的所有已分析数据,然后可将这些数据添加到地图中。 KML 比大多数空间数据格式要复杂一些,因为它包含的样式信息要多得多。 SpatialDataLayer 类支持其中的大多数样式,但在加载特征数据之前,必须先将图标图像载入地图,并单独将地面叠加层作为图层添加到地图中。 通过 URL 加载数据时,应将数据托管在支持 CORs 的终结点上,或者应该将代理服务作为一个选项传入 read 函数中。
<!DOCTYPE html>
<html>
<head>
    <title></title>
    <meta charset="utf-8" />
    <meta http-equiv="x-ua-compatible" content="IE=Edge" />
    <meta name="viewport" content="width=device-width, initial-scale=1, shrink-to-fit=no" />

    <!-- Add references to the Azure Maps Map control JavaScript and CSS files. -->
    <link rel="stylesheet" href="https://atlas.microsoft.com/sdk/javascript/mapcontrol/3/atlas.min.css" type="text/css" />
    <script src="https://atlas.microsoft.com/sdk/javascript/mapcontrol/3/atlas.min.js"></script>

    <!-- Add reference to the Azure Maps Spatial IO module. -->
    <script src="https://atlas.microsoft.com/sdk/javascript/spatial/0/atlas-spatial.js"></script>

    <script type='text/javascript'>
        var map, datasource, layer;

        function initMap() {
            //Initialize a map instance.
            map = new atlas.Map('myMap', {
                view: 'Auto',

                //Add your Azure Maps subscription key to the map SDK. Get an Azure Maps key at https://azure.com/maps
                authOptions: {
                    authType: 'subscriptionKey',
                    subscriptionKey: '<Your Azure Maps Key>'
                }
            });

            //Wait until the map resources are ready.
            map.events.add('ready', function () {

                //Create a data source and add it to the map.
                datasource = new atlas.source.DataSource();
                map.sources.add(datasource);

                //Add a simple data layer for rendering the data.
                layer = new atlas.layer.SimpleDataLayer(datasource);
                map.layers.add(layer);

                //Read a KML file from a URL or pass in a raw KML string.
                atlas.io.read('https://googlearchive.github.io/js-v2-samples/ggeoxml/cta.kml').then(async r => {
                    if (r) {

                        //Check to see if there are any icons in the data set that need to be loaded into the map resources.
                        if (r.icons) {
                            //For each icon image, create a promise to add it to the map, then run the promises in parrallel.
                            var imagePromises = [];

                            //The keys are the names of each icon image.
                            var keys = Object.keys(r.icons);

                            if (keys.length !== 0) {
                                keys.forEach(function (key) {
                                    imagePromises.push(map.imageSprite.add(key, r.icons[key]));
                                });

                                await Promise.all(imagePromises);
                            }
                        }

                        //Load all features.
                        if (r.features && r.features.length > 0) {
                            datasource.add(r.features);
                        }

                        //Load all ground overlays.
                        if (r.groundOverlays && r.groundOverlays.length > 0) {
                            map.layers.add(r.groundOverlays);
                        }

                        //If bounding box information is known for data, set the map view to it.
                        if (r.bbox) {
                            map.setCamera({ bounds: r.bbox, padding: 50 });
                        }
                    }
                });
            });
        }
    </script>
</head>
<body onload="initMap()">
    <div id='myMap' style='position:relative;width:600px;height:400px;'></div>
</body>
</html>

更多资源:
更多代码示例
下面是一些与 Google Maps 迁移相关的其他代码示例:
服务:
Google Maps V3 到 Azure Maps Web SDK 的类映射
以下附录提供了 Google Maps V3 和等效 Azure Maps Web SDK 中常用类的交叉参考。
核心类
| Google Maps | Azure Maps |
|---|---|
google.maps.Map |
atlas.Map |
google.maps.InfoWindow |
atlas.Popup |
google.maps.InfoWindowOptions |
atlas.PopupOptions |
google.maps.LatLng |
atlas.data.Position |
google.maps.LatLngBounds |
atlas.data.BoundingBox |
google.maps.MapOptions |
atlas.CameraOptions atlas.CameraBoundsOptions atlas.ServiceOptions atlas.StyleOptions atlas.UserInteractionOptions |
google.maps.Point |
atlas.Pixel |
叠加类
| Google Maps | Azure Maps |
|---|---|
google.maps.Marker |
atlas.HtmlMarker atlas.data.Point |
google.maps.MarkerOptions |
atlas.HtmlMarkerOptions atlas.layer.SymbolLayer atlas.SymbolLayerOptions atlas.IconOptions atlas.TextOptions atlas.layer.BubbleLayer atlas.BubbleLayerOptions |
google.maps.Polygon |
atlas.data.Polygon |
google.maps.PolygonOptions |
atlas.layer.PolygonLayer atlas.PolygonLayerOptions atlas.layer.LineLayer atlas.LineLayerOptions |
google.maps.Polyline |
atlas.data.LineString |
google.maps.PolylineOptions |
atlas.layer.LineLayer atlas.LineLayerOptions |
google.maps.Circle |
请参阅将圆添加到地图 |
google.maps.ImageMapType |
atlas.TileLayer |
google.maps.ImageMapTypeOptions |
atlas.TileLayerOptions |
google.maps.GroundOverlay |
atlas.layer.ImageLayer atlas.ImageLayerOptions |
服务类
Azure Maps Web SDK 包含一个可单独加载的服务模块。 此模块使用 Web API 包装 Azure Maps REST 服务,可在 JavaScript、TypeScript 和 Node.js 应用程序中使用。
| Google Maps | Azure Maps |
|---|---|
google.maps.Geocoder |
atlas.service.SearchUrl |
google.maps.GeocoderRequest |
atlas.SearchAddressOptions atlas.SearchAddressRevrseOptions atlas.SearchAddressReverseCrossStreetOptions atlas.SearchAddressStructuredOptions atlas.SearchAlongRouteOptions atlas.SearchFuzzyOptions atlas.SearchInsideGeometryOptions atlas.SearchNearbyOptions atlas.SearchPOIOptions atlas.SearchPOICategoryOptions |
google.maps.DirectionsService |
atlas.service.RouteUrl |
google.maps.DirectionsRequest |
atlas.CalculateRouteDirectionsOptions |
google.maps.places.PlacesService |
f |
库
库将更多功能添加到地图中。 其中的许多库包含在 Azure Maps 的核心 SDK 中。 下面是可以取代这些 Google Maps 库的等效类
| Google Maps | Azure Maps |
|---|---|
| 绘图库 | 绘图工具模块 |
| 几何库 | atlas.math |
| 可视化库 | 热度地图层 |
清理资源
没有要清理的资源。
后续步骤
详细了解如何迁移到 Azure Maps: