Training
Module
Capture Web Application Logs with App Service Diagnostics Logging - Training
Learn about how to capture trace output from your Azure web apps. View a live log stream and download logs files for offline analysis.
This browser is no longer supported.
Upgrade to Microsoft Edge to take advantage of the latest features, security updates, and technical support.
When you are trying to debug a web-based application, there is no substitute for a good set of trace logs. This tutorial shows how to enable tracing in ASP.NET Web API. You can use this feature to trace what the Web API framework does before and after it invokes your controller. You can also use it to trace your own code.
Software versions used in the tutorial
- Visual Studio 2017 (also works with Visual Studio 2015)
- Web API 2
- Microsoft.AspNet.WebApi.Tracing
First, we'll create a new ASP.NET Web Application project. In Visual Studio, from the File menu, select New > Project. Under Templates, Web, select ASP.NET Web Application.
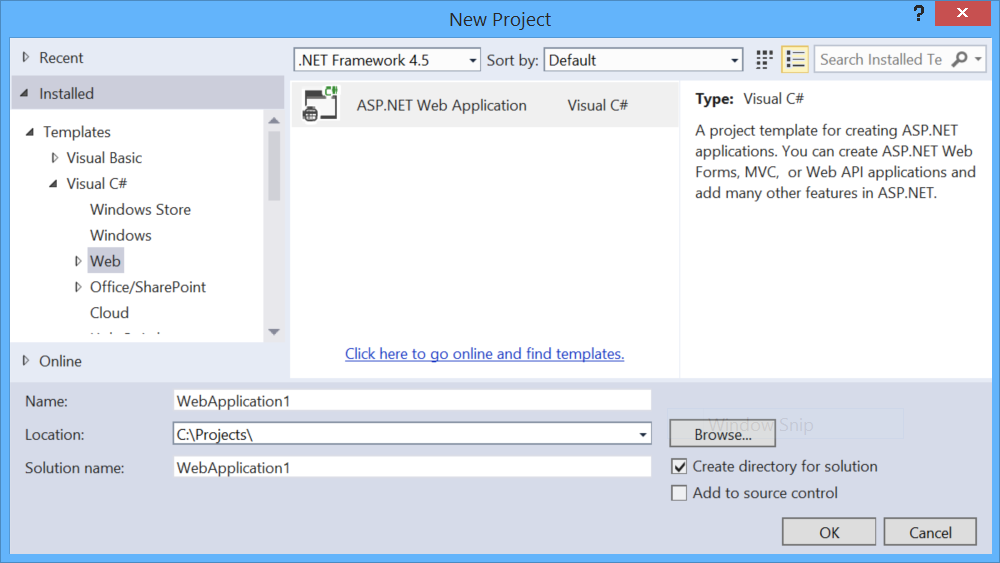
Choose the Web API project template.

From the Tools menu, select NuGet Package Manager, then Package Manage Console.
In the Package Manager Console window, type the following commands.
Install-Package Microsoft.AspNet.WebApi.Tracing
Update-Package Microsoft.AspNet.WebApi.WebHost
The first command installs the latest Web API tracing package. It also updates the core Web API packages. The second command updates the WebApi.WebHost package to the latest version.
Note
If you want to target a specific version of Web API, use the -Version flag when you install the tracing package.
Open the file WebApiConfig.cs in the App_Start folder. Add the following code to the Register method.
public static class WebApiConfig
{
    public static void Register(HttpConfiguration config)
    {
        // New code
        config.EnableSystemDiagnosticsTracing();

        // Other configuration code not shown.
    }
}
This code adds the SystemDiagnosticsTraceWriter class to the Web API pipeline. The SystemDiagnosticsTraceWriter class writes traces to System.Diagnostics.Trace.
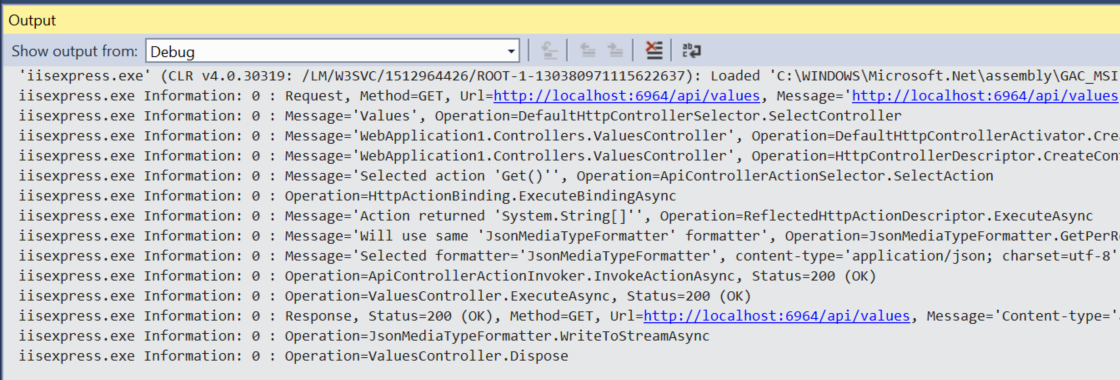
To see the traces, run the application in the debugger. In the browser, navigate to /api/values.

The trace statements are written to the Output window in Visual Studio. (From the View menu, select Output).
Because SystemDiagnosticsTraceWriter writes traces to System.Diagnostics.Trace, you can register additional trace listeners; for example, to write traces to a log file. For more information about trace writers, see the Trace Listeners topic on MSDN.
The following code shows how to configure the trace writer.
SystemDiagnosticsTraceWriter traceWriter = config.EnableSystemDiagnosticsTracing();
traceWriter.IsVerbose = true;
traceWriter.MinimumLevel = TraceLevel.Debug;
There are two settings that you can control:
Adding a trace writer gives you immediate access to the traces created by the Web API pipeline. You can also use the trace writer to trace your own code:
using System.Web.Http.Tracing;

public class ProductsController : ApiController
{
    public HttpResponseMessage GetAllProducts()
    {
        Configuration.Services.GetTraceWriter().Info(
            Request, "ProductsController", "Get the list of products.");

        // ...
    }
}
To get the trace writer, call HttpConfiguration.Services.GetTraceWriter. From a controller, this method is accessible through the ApiController.Configuration property.
To write a trace, you can call the ITraceWriter.Trace method directly, but the ITraceWriterExtensions class defines some extension methods that are more friendly. For example, the Info method shown above creates a trace with trace level Info.
This section describes how to write a custom trace writer for Web API.
The Microsoft.AspNet.WebApi.Tracing package is built on top of a more general tracing infrastructure in Web API. Instead of using Microsoft.AspNet.WebApi.Tracing, you can also plug in some other tracing/logging library, such as NLog or log4net.
To collect traces, implement the ITraceWriter interface. Here is a simple example:
public class SimpleTracer : ITraceWriter
{
    public void Trace(HttpRequestMessage request, string category, TraceLevel level,
        Action<TraceRecord> traceAction)
    {
        TraceRecord rec = new TraceRecord(request, category, level);
        traceAction(rec);
        WriteTrace(rec);
    }

    protected void WriteTrace(TraceRecord rec)
    {
        var message = string.Format("{0};{1};{2}",
            rec.Operator, rec.Operation, rec.Message);
        System.Diagnostics.Trace.WriteLine(message, rec.Category);
    }
}
The ITraceWriter.Trace method creates a trace. The caller specifies a category and trace level. The category can be any user-defined string. Your implementation of Trace should do the following:
To enable tracing, you must configure Web API to use your ITraceWriter implementation. You do this through the HttpConfiguration object, as shown in the following code:
public static void Register(HttpConfiguration config)
{
    config.Services.Replace(typeof(ITraceWriter), new SimpleTracer());
}
Only one trace writer can be active. By default, Web API sets a "no-op" tracer that does nothing. (The "no-op" tracer exists so that tracing code does not have to check whether the trace writer is null before writing a trace.)
Tracing in Web API uses a facade pattern: When tracing is enabled, Web API wraps various parts of the request pipeline with classes that perform trace calls.
For example, when selecting a controller, the pipeline uses the IHttpControllerSelector interface. With tracing enabled, the pipeline inserts a class that implements IHttpControllerSelector but calls through to the real implementation:

The benefits of this design include:
You can also replace the entire Web API trace framework with your own custom framework, by replacing the default ITraceManager service:
config.Services.Replace(typeof(ITraceManager), new MyTraceManager());
Implement ITraceManager.Initialize to initialize your tracing system. Be aware that this replaces the entire trace framework, including all of the tracing code that is built into Web API.
Training
Module
Capture Web Application Logs with App Service Diagnostics Logging - Training
Learn about how to capture trace output from your Azure web apps. View a live log stream and download logs files for offline analysis.