Perform network intrusion detection by using Azure Network Watcher and open-source tools
Packet captures are a key component for implementing network intrusion detection systems (IDSs) and performing network security monitoring. Several open-source IDS tools process packet captures and look for signatures of possible network intrusions and malicious activity. By using the packet captures that Azure Network Watcher provides, you can analyze your network for harmful intrusions or vulnerabilities.
One such open-source tool is Suricata, an IDS engine that uses rule sets to monitor network traffic and triggers alerts whenever suspicious events occur. Suricata offers a multithreaded engine to perform network traffic analysis with increased speed and efficiency. For more information about Suricata and its capabilities, go to the Suricata website.
This article explains how to set up your environment to perform network intrusion detection by using Network Watcher, Suricata, and the Elastic Stack.
Network Watcher gives you the packet captures for performing network intrusion detection. Suricata processes the packet captures and triggers alerts based on packets that match its rule set of threats. Suricata stores these alerts in a log file on your local machine.
By using the Elastic Stack, you can index the logs that Suricata generates and then use them to create a Kibana dashboard. A dashboard provides a visual representation of the logs and a way to quickly gain insights to potential network vulnerabilities.

You can set up both open-source tools on an Azure virtual machine (VM), so you can perform this analysis within your own Azure network environment.
On the command-line terminal of your VM, run the following commands:
sudo add-apt-repository ppa:oisf/suricata-stable
sudo apt-get update
sudo apt-get install suricata
To verify your installation, run the command
suricata -hto see the full list of commands.
For other methods of installation, see the Suricata installation quickstart guide.
At this stage, you don't have any rules for Suricata to run. You can create your own rules if you want to detect specific threats to your network. You can also use developed rule sets from various providers, such as Emerging Threats or Talos rules from Snort. In this article, you use the freely available Emerging Threats rule set.
Download the rule set and copy it into the directory:
wget https://rules.emergingthreats.net/open/suricata/emerging.rules.tar.gz
tar zxf emerging.rules.tar.gz
sudo cp -r rules /etc/suricata/
To process packet captures by using Suricata, run the following command:
sudo suricata -c /etc/suricata/suricata.yaml -r <location_of_pcapfile>
To check the resulting alerts, read the fast.log file:
tail -f /var/log/suricata/fast.log
Logs that Suricata produces contain valuable information about what's happening on your network, but these log files aren't the easiest to read and understand. By connecting Suricata with the Elastic Stack, you can create a Kibana dashboard to search, graph, analyze, and derive insights from your logs.
Elastic Stack version 5.0 and later require Java 8. Run the command
java -versionto check your version. If you don't have Java installed, refer to documentation on the Azure-supported Java Development Kits.Download the correct binary package for your system:
curl -L -O https://artifacts.elastic.co/downloads/elasticsearch/elasticsearch-5.2.0.deb
sudo dpkg -i elasticsearch-5.2.0.deb
sudo /etc/init.d/elasticsearch start
You can find other installation methods on the Elastic webpage for installing Elasticsearch.
Verify that Elasticsearch is running by using this command:
curl http://127.0.0.1:9200You should get a response similar to this example:
{
"name" : "Angela Del Toro",
"cluster_name" : "elasticsearch",
"version" : {
    "number" : "5.2.0",
    "build_hash" : "8ff36d139e16f8720f2947ef62c8167a888992fe",
    "build_timestamp" : "2016-01-27T13:32:39Z",
    "build_snapshot" : false,
    "lucene_version" : "6.1.0"
},
"tagline" : "You Know, for Search"
}
For more instructions on installing Elasticsearch, refer to the Elastic webpage about installation.
Install Logstash by running the following commands:
curl -L -O https://artifacts.elastic.co/downloads/logstash/logstash-5.2.0.deb
sudo dpkg -i logstash-5.2.0.deb
Configure Logstash to read from the output of the eve.json file. Create a logstash.conf file by using this command:
sudo touch /etc/logstash/conf.d/logstash.confAdd the following content to the file. Make sure that the path to the eve.json file is correct.
input {
file {
    path => ["/var/log/suricata/eve.json"]
    codec =>  "json"
    type => "SuricataIDPS"
}

}

filter {
if [type] == "SuricataIDPS" {
    date {
    match => [ "timestamp", "ISO8601" ]
    }
    ruby {
    code => "
        if event.get('[event_type]') == 'fileinfo'
        event.set('[fileinfo][type]', event.get('[fileinfo][magic]').to_s.split(',')[0])
        end
    "
    }

    ruby{
    code => "
        if event.get('[event_type]') == 'alert'
        sp = event.get('[alert][signature]').to_s.split(' group ')
        if (sp.length == 2) and /\A\d+\z/.match(sp[1])
            event.set('[alert][signature]', sp[0])
        end
        end
        "
    }
}

if [src_ip]  {
    geoip {
    source => "src_ip"
    target => "geoip"
    #database => "/opt/logstash/vendor/geoip/GeoLiteCity.dat"
    add_field => [ "[geoip][coordinates]", "%{[geoip][longitude]}" ]
    add_field => [ "[geoip][coordinates]", "%{[geoip][latitude]}"  ]
    }
    mutate {
    convert => [ "[geoip][coordinates]", "float" ]
    }
    if ![geoip.ip] {
    if [dest_ip]  {
        geoip {
        source => "dest_ip"
        target => "geoip"
        #database => "/opt/logstash/vendor/geoip/GeoLiteCity.dat"
        add_field => [ "[geoip][coordinates]", "%{[geoip][longitude]}" ]
        add_field => [ "[geoip][coordinates]", "%{[geoip][latitude]}"  ]
        }
        mutate {
        convert => [ "[geoip][coordinates]", "float" ]
        }
    }
    }
}
}

output {
elasticsearch {
    hosts => "localhost"
}
}
Give the correct permissions to the eve.json file so that Logstash can ingest the file:
sudo chmod 775 /var/log/suricata/eve.jsonStart Logstash by running this command:
sudo /etc/init.d/logstash start
For more instructions on installing Logstash, refer to the official Elastic documentation.
Run the following commands to install Kibana:
curl -L -O https://artifacts.elastic.co/downloads/kibana/kibana-5.2.0-linux-x86_64.tar.gz
tar xzvf kibana-5.2.0-linux-x86_64.tar.gz
Run Kibana by using these commands:
cd kibana-5.2.0-linux-x86_64/
./bin/kibana
View your Kibana web interface by going to
http://localhost:5601.For this scenario, the index pattern used for the Suricata logs is
logstash-*.If you want to view the Kibana dashboard remotely, create an inbound network security group (NSG) rule that allows access to port 5601.
This article provides a sample dashboard for you to view trends and details in your alerts. To use it:
Download the dashboard file, visualization file, and saved search file.
On the Management tab of Kibana, go to Saved Objects and import all three files. Then, on the Dashboard tab, you can open and load the sample dashboard.
You can also create your own visualizations and dashboards tailored for metrics of your own interest. Read more about creating Kibana visualizations from Kibana's official documentation.

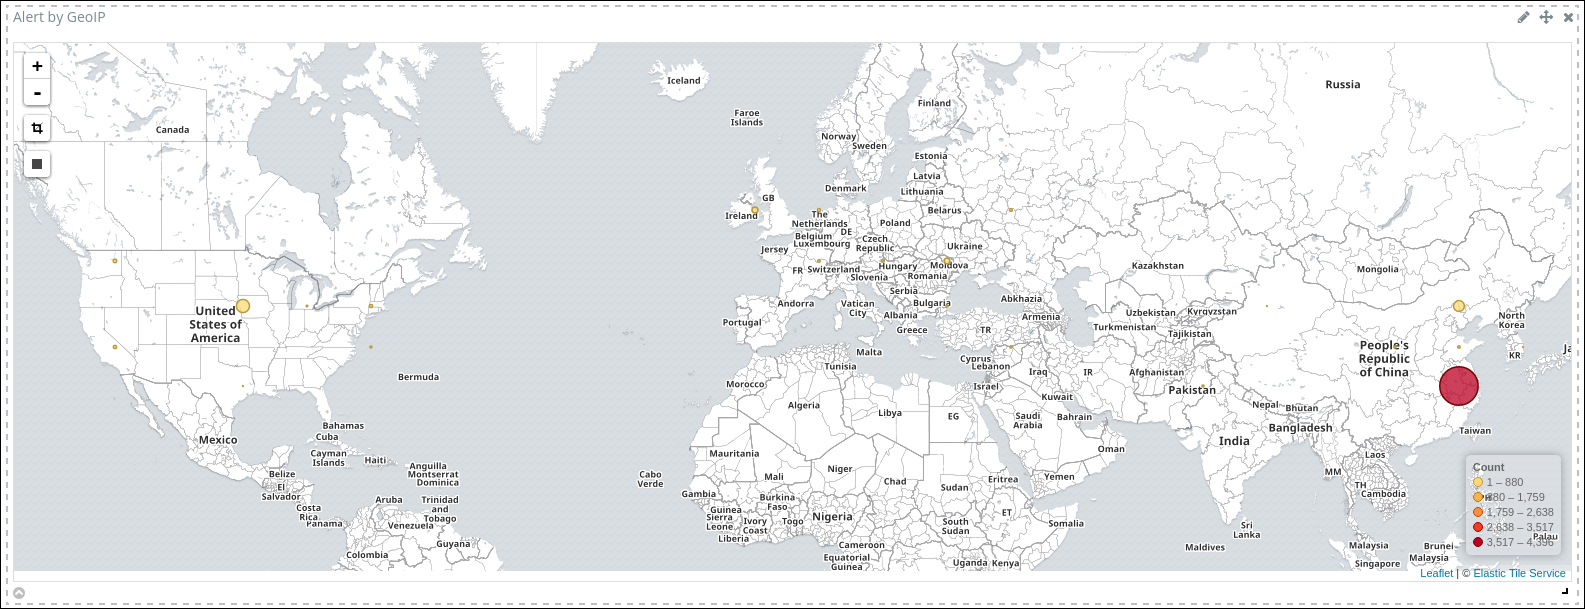
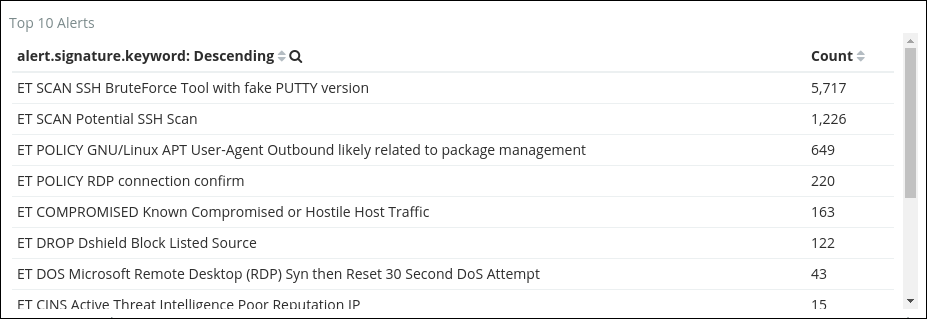
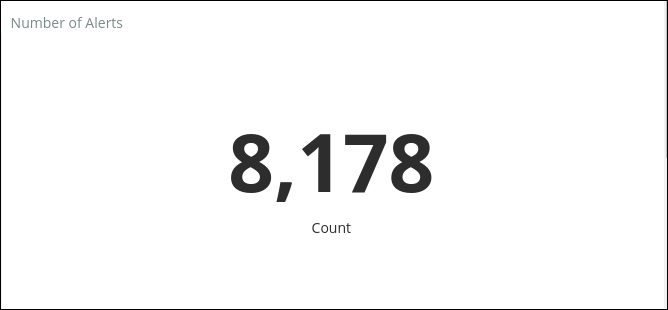
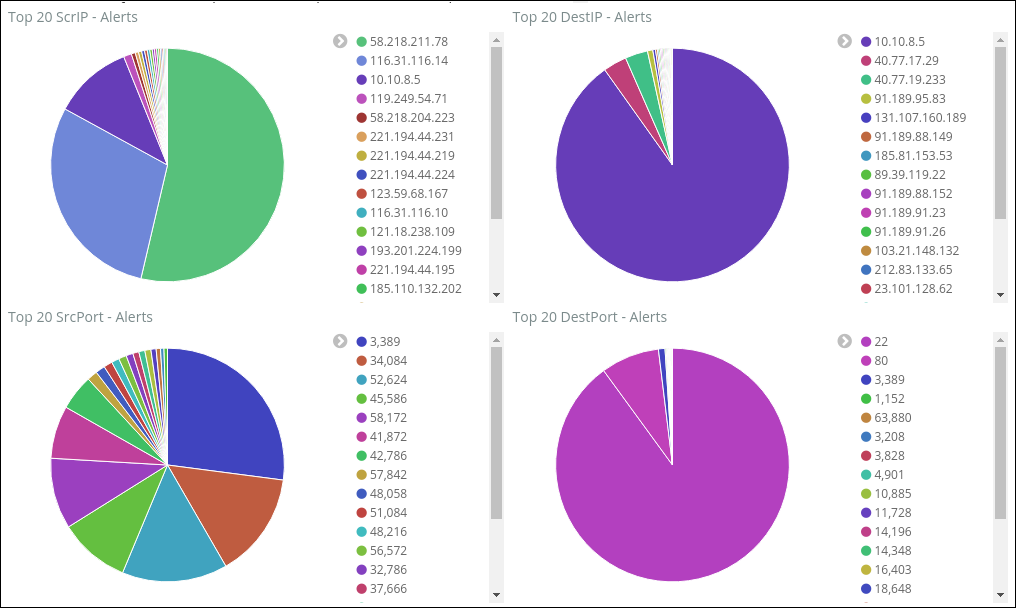
The sample dashboard provides several visualizations of the Suricata alert logs:
Alert by GeoIP: A map that shows the distribution of alerts by their country/region of origin based on geographic location (determined by IP).
Top 10 Alerts: A summary of the 10 most frequently triggered alerts and their descriptions. Selecting an individual alert filters the dashboard to the information that pertains to that specific alert.
Number of Alerts: The total count of alerts that the rule set triggered.
Top 20 ScrIP - Alerts, Top 20 DestIP - Alerts, Top 20 SrcPort - Alerts, Top 20 DestPort - Alerts: Pie charts that show the sources and destinations for the top 20 IPs and ports that alerts were triggered on. You can filter on specific IPs or ports to see how many and what kinds of alerts are being triggered.
Alert Summary: A table that summarizes specific details of each alert. You can customize this table to show other parameters of interest for each alert.


For more information on creating custom visualizations and dashboards, see Kibana's official documentation.
By combining packet captures from Network Watcher and open-source IDS tools such as Suricata, you can perform network intrusion detection for a wide range of threats.
Dashboards help you quickly spot trends and anomalies within your network. You can also use dashboards to examine the data to discover root causes of alerts, such as malicious user agents or vulnerable ports. With this extracted data, you can make informed decisions on how to:
- React to and protect your network from harmful intrusion attempts.
- Create rules to prevent future intrusions to your network.
Learn how to trigger packet captures based on alerts: