Features in Configuration Manager technical preview version 1901
Applies to: Configuration Manager (technical preview branch)
This article introduces the features that are available in the technical preview for Configuration Manager, version 1901. Install this version to update and add new features to your technical preview site.
Review the technical preview article before installing this update. That article familiarizes you with the general requirements and limitations for using a technical preview, how to update between versions, and how to provide feedback.
The following sections describe the new features to try out in this version:
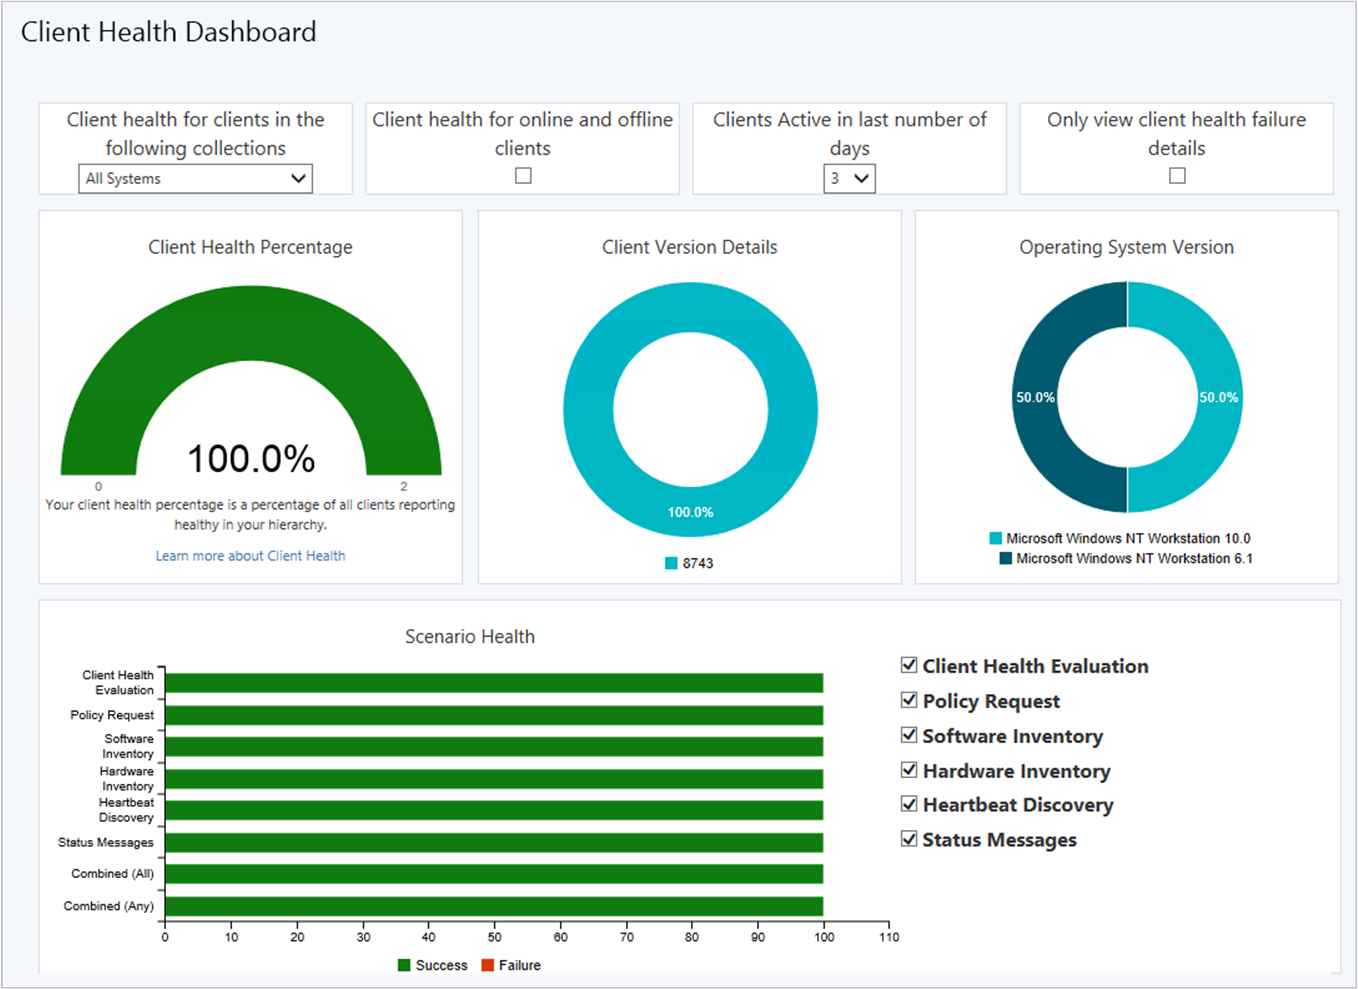
You deploy software updates and other apps to help secure your environment, but these deployments only reach healthy clients. Unhealthy Configuration Manager clients adversely effect overall compliance. Determining client health can be challenging depending upon the denominator: how many total devices should be in your scope of management? For example, if you discover all systems from Active Directory, even if some of those records are for retired machines, this process increases your denominator.
You can now view a dashboard with information about the health of Configuration Manager clients in your environment. View your client health, scenario health, and common errors. Filter the view by several attributes to see any potential issues by OS and client versions.
In the Configuration Manager console, go to the Monitoring workspace. Expand Client status, and select the Client health dashboard node.
Tip
There are no changes to ccmeval in this version.
At the top of the dashboard, there's a set of filters to adjust the data displayed in the dashboard.
Collection: By default, the dashboard displays devices in the All Systems collection. Select a device collection from the list to scope the view to a subset of devices in a specific collection.
Online/offline: By default, the dashboard displays only online clients. This state comes from the client notification channel that update a client's status every five minutes. For more information, see About client status.
Active # days: By default, the dashboard displays clients that are active in the last three days.
Failure only: Scope the view to only devices that are reporting a client health failure.
Tip
Use this filter along with the client version and OS version tiles. For more information, see Version tiles.
This tile shows the overall client health in your hierarchy.
A healthy Configuration Manager client has the following properties:
- Online
- Actively sending data
- Passes all client health evaluation checks
For more information, see About client status.
A healthy client successfully communicates with the site. It reports all data based on the defined schedules in client settings.
Select a segment of this chart to drill down to a device list view.
There are two tiles that show client health by Configuration Manager client version and OS version. These tiles are useful when you make changes to the filters, such as Failure only. They can help highlight whether any issues are consistent across a specific version. Use this information to help you make upgrade decisions.
Select a segment of these charts to drill down to a device list view.
This bar chart shows the overall health for the following core scenarios:
- Client policy
- Heartbeat discovery
- Hardware inventory
- Software inventory
- Status messages
Use the selectors to adjust the focus on specific scenarios in the chart.
The following two bars are always shown:
- Combined (All): the combination of all scenarios (AND)
- Combined (Any): at least one of the scenarios (OR)
Tip
Scenario health isn't measured from your configuration of client settings. These values can vary based upon the resultant set of policy per device. Use the following steps to adjust the evaluation periods for scenario health:
- In the Configuration Manager console, go to the Monitoring workspace, and select the Client Status node.
- In the ribbon, select Client Status Settings.
By default, if a client doesn't send scenario-specific data in 7 days, Configuration Manager considers it unhealthy for that scenario.
This chart lists the most common failures in your environment. These errors come from Windows or Configuration Manager.
Adjust the priority with which clients install a feature update through Windows 10 servicing. By default, clients now install feature updates with higher processing priority.
A new client setting provides the following options:
Normal: Windows Setup uses more system resources and updates faster. It uses more processor time, so the total installation time is shorter, but the user's outage is longer. This value is the default.
Low: You can continue to work on the device while it downloads and updates in the background. The total installation time is longer, but the user's outage is shorter.
Tip
This setting has no impact on Windows 10 in-place upgrade task sequences.
This setting applies when upgrading to Windows 10, version 1709 or later.
Try to complete the tasks. Then send Feedback with your thoughts on the feature.
Configure client settings. For more information, see How to configure client settings.
In the Software Updates group, configure the following setting: Specify thread priority for feature updates.
Deploy a Windows 10 feature update using a servicing plan. For more information, see Windows 10 servicing plan.
This setting configures the following options in the setupconfig.ini file on the device:
- Normal:
/Priority Normal - Low: remove the
/Priorityproperty
For more information, see Windows Setup Command-Line Options.
Phased deployments now have their own dedicated monitoring node. This node makes it easier to identify phased deployments that you created and then navigate to the phased deployment monitoring view.
Try to complete the tasks. Then send Feedback with your thoughts on the feature.
In the Configuration Manager console, go to the Monitoring workspace.
Select the Phased Deployments node. It shows the list of phased deployments.
Select one of the phased deployments, and then choose View phased deployment status in the ribbon.
Configuration Manager now supports running CMPivot from the central administration site in a hierarchy.
Note
This option can't be used with this release due to the technical preview limit of a single primary site.
The primary site still handles the communication to the client. When running CMPivot from the central administration site, it communicates with the primary site over the high-speed message subscription channel. This communication doesn't rely upon standard SQL Server replication between sites.
For more general information, see CMPivot for real-time data.
Tip
You could previously run scripts from a central administration site. With this improvement, scripts also use the high-speed message subscription channel. The primary site quickly receives the message and notifies the client to run the script. This behavior reduces the time delay for running a script on a client from the central administration site.
For more general information on scripts, see Create and run PowerShell scripts from the Configuration Manager console.
Based on your feedback, the Run PowerShell Script task sequence step now includes the following improvements:
Specify alternate user credentials with the option to Run this step as the following account.
Specify a Time-out (minutes). This option ends the step if the script runs past the timeout value.
Specify a working directory with the Start in field.
On the Options tab, specify Success codes. Include other exit codes from the script that the step should evaluate as success.
The product lifecycle dashboard now includes information for installed versions of Office 2003 through Office 2016. Data shows up after the site runs the lifecycle summarization task, which is every 24 hours.
For more information on this dashboard, see Use the Product Lifecycle dashboard.
Management insights has new rules with recommendations on managing collections. Use these insights to simplify management and improve performance.
The following rules are in the Collections group:
Collections with no query rules and no direct members: To simplify the list of collections in your hierarchy, delete these collections.
Collections with the same re-evaluation start time: These collections have the same re-evaluation time as other collections. Modify the re-evaluation time so they don't conflict.
Collections with query time over two seconds: Review the query rules for this collection. Consider modifying or deleting the collection.
The following rules include configurations that potentially cause unnecessary load on the site. Review these collections, then either delete them, or disable rule evaluation:
Collections with no query rules and incremental updates enabled
Collections with no query rules and enabled for scheduled or incremental evaluation
Collections with no query rules and schedule full evaluation selected
Based on your feedback, you can now search for a MAC address in a device view of the Configuration Manager console. This property is useful for OS deployment administrators while troubleshooting PXE-based deployments.
Go to the Assets and Compliance workspace, and select the Devices node. You can also view the membership of a Device Collection. When you view a list of devices, add the MAC Address column to the view. Use the search field to add the MAC Address search criteria.
You can now set a distribution point in maintenance mode. Enable maintenance mode when you're installing software updates, or making hardware changes to the server.
While the distribution point is in maintenance mode, it has the following behaviors:
The site doesn't distribute any content to it.
Management points don't return the location of this distribution point to clients.
When you update the site, a distribution point in maintenance mode still updates.
The distribution point properties are read-only. For example, you can't change the certificate or add boundary groups.
Any scheduled task, like content validation, still runs on the same schedule.
Be careful about enabling maintenance mode on more than one distribution point. This action may cause a performance impact to your other distribution points. Depending upon your boundary group configurations, clients may have increased download times or be unable to download content.
Try to complete the tasks. Then send Feedback with your thoughts on the feature.
In the Configuration Manager console, go to the Administration workspace.
Select the Distribution Points node.
Select the target distribution point, and choose Enable maintenance mode from the ribbon.
To view the current state of the distribution points, add the "Maintenance mode" column to the Distribution Points node in the console.
You can use the SetDPMaintenanceMode WMI method in the SMS_DistributionPointInfo class to automate this action.
For more information, see SMS_DistributionPointInfo Server WMI Class.
uint32 SetDPMaintenanceMode(
    [in] string NALPath,
    [in] uint32 Mode
);
NALPath- Data type:
String - Qualifiers:
[in] - Description: Source distribution point NAL path.
- Data type:
Mode- Data type:
uint32 - Qualifiers:
[in] - Description:
1to enable maintenance mode,0to disable
- Data type:
An uint32 data type that's 0 indicates success. A non-zero hresult indicates failure.
For more information about handling returned errors, see About Configuration Manager Errors.
When you apply software updates to an OS image, there's a new option to optimize the output by removing any superseded updates. The optimization to offline servicing only applies to images with a single index. This feature is based on your feedback.
When you schedule the site to apply software updates to an OS image, it uses the Windows Deployment Image Servicing and Management (DISM) command-line tool. During the servicing process, this change introduces the following two additional steps:
Run DISM against the mounted offline image with the parameters
/Cleanup-Image /StartComponentCleanup /ResetBase. If this command fails, the current servicing process fails. It doesn't commit any changes to the image.After Configuration Manager commits changes to the image and unmounts it from the file system, it exports the image to another file. This step uses the DISM parameter
/Export-Image. It removes unneeded files from the image, which reduces the size.
Microsoft recommends that you regularly apply updates to your offline images. You don't have to use this option every time you service an image. When you do this process each month, this new option provides you the greatest advantage by using it over time.
While this option helps reduce the overall size of the serviced image, it does take longer to complete the process. Use the wizard to schedule servicing during convenient times. It also requires additional storage on the site server. You can customize the site to use location an alternate location. For more information, see Specify the drive for offline OS image servicing.
For more general information about offline servicing, see Apply software updates to an image.
Try to complete the tasks. Then send Feedback with your thoughts on the feature.
Start the servicing process.
On the Set Schedule page, select the option to Remove superseded updates after the image is updated. This option isn't automatically enabled. If the image has more than one index, you can't use this option.
To schedule image servicing, complete the wizard.
Validate and monitor the process using the OfflineServicing.log.
When importing a Windows image (WIM) file to Configuration Manager, you can now specify to automatically import a single index rather than all image indexes in the file. This option provides the following benefits:
- Smaller image file
- Faster offline servicing
- Optimize image servicing, for a smaller image file after offline servicing
Try to complete the tasks. Then send Feedback with your thoughts on the feature.
On the Data Source page, select the option to Extract a specific image index from the specified WIM file. Then select the image index from the list.
Complete the wizard.
Configuration Manager doesn't modify the source image file. It creates a new image file in the same source directory.
Starting in Configuration Manager current branch version 1810, the classic service deployment in Azure is deprecated for use in Configuration Manager. That version is the last to support creation of these Azure deployments.
Existing deployments continue to work. Starting in this technical preview branch version, Azure Resource Manager is the only deployment mechanism for new instances of the cloud management gateway and cloud distribution point.
For more information, see the following articles:
- Azure Resource Manager for the cloud management gateway
- Azure Resource Manager for the cloud distribution point
When you send feedback in the Configuration Manager console, it now shows a confirmation message. This message includes a Feedback ID, which you can give to Microsoft as a tracking identifier.
To copy the feedback ID, select the copy icon next to the feedback ID, or use the CTRL + C key shortcut. This ID isn't stored on your computer, so make sure to copy it before closing the window.
Automatically create and configure virtual machines in Microsoft Azure with Configuration Manager technical preview branch. It uses Azure templates to simplify and automate the creation of a lab using Azure resources.
For more information, see Create a Configuration Manager technical preview lab in Azure.
You can now specify a custom port number for wake-up proxy. For more general information, see New client notification action to wake up device.
Try to complete the tasks. Then send Feedback with your thoughts on the feature.
Configure client settings. For more information, see How to configure client settings.
In the Power Management group, configure the following settings:
Allow network wake-up: Enable
Wake On LAN port number (UDP): By default, this setting is UDP port
9. Change it as necessary for your network environment.
Based on your feedback, you can now view the most recent connections for the Configuration Manager console. The view includes active connections and those that recently connected.
Your account needs the Read permission on the SMS_Site object
Enable the SMS Provider to use a certificate. Use one of the following options:
Enable Enhanced HTTP (recommended)
Manually bind a PKI-based certificate to port 443 in IIS on the server that hosts the SMS Provider role
Try to complete the tasks. Then send Feedback with your thoughts on the feature.
In the Configuration Manager console, go to the Administration workspace.
Expand Security and select the Console Connections node.
View the recent connections, with the following properties:
- User name
- Machine name
- Connected site code
- Console version
- Last connected time: When the user last opened the console
You'll always see your current console connection in the list. It only shows connections from the Configuration Manager console, not PowerShell or other SDK-based connections to the SMS Provider. The site removes instances from the list that are older than 30 days.
When you view this node, the Configuration Manager console may stop working correctly.
On the properties of the SMS Provider site role, disable the option to Allow Configuration Manager cloud management gateway traffic for administration service.
Configuration Manager can now stop a cloud management gateway (CMG) service when the total data transfer goes over your limit. The CMG has always had alerts, to trigger notifications when the usage reached warning or critical levels. To help reduce any unexpected Azure costs because of a spike in usage, this new option turns off the cloud service.
Important
Even if the service isn't running, there are still costs associated with the cloud service. Stopping the service doesn't eliminate all associated Azure costs. To remove all cost for the cloud service, delete the CMG.
When the CMG service is stopped, internet-based clients can't communicate with Configuration Manager.
The total data transfer (egress) includes data from the cloud service and storage account. This data comes from the following flows:
- CMG to client
- CMG to site, including CMG log files
- If you enable CMG for content, storage account to client
For more information on these data flows, see CMG ports and data flow.
The storage alert threshold is separate. That alert monitors the capacity of your Azure storage instance.
When you select the CMG instance in the Cloud Management Gateway node in the console, you can see the total data transfer in the details pane.
Configuration Manager checks the threshold value every six minutes. If there's a sudden spike in usage, Configuration Manager can take up to six minutes to detect it exceeded the threshold and stop the service.
Try to complete the tasks. Then send Feedback with your thoughts on the feature.
Enable the option to Stop this service when it exceeds the critical threshold.
To test this option, temporarily reduce one of the following values:
14-day threshold for outbound data transfer (GB). The default value is
10000.Percentage of threshold for raising Critical alert. The default value is
90.
During an OS deployment task sequence, Configuration Manager places the client in provisioning mode. In this state, the client doesn't process policy from the site. This behavior allows the task sequence to run without risk of additional deployments running on the client. When the task sequence completes, either success or handled failure, it exits client provisioning mode.
If the task sequence unexpectedly fails, the client can be left in provisioning mode. For example, if the device restarts in the middle of task sequence processing, and it's unable to recover. An administrator must manually identify and fix clients in this state.
Now the task sequence sets a timestamp when it puts the client in provisioning mode. A client in provisioning mode checks every 60 minutes the duration of time since the timestamp. If it's been in provisioning mode for more than 48 hours, the client automatically exits provisioning mode and restarts its process.
48 hours is the default provisioning mode timeout value. You can adjust this timer on a device by setting the ProvisioningMaxMinutes value in the following registry key: HKLM\Software\Microsoft\CCM\CcmExec. If this value doesn't exist or is 0, the client uses the default 48 hours.
This technical preview version includes the following improvements to OS deployment:
Based on your feedback, there's a new View action on task sequences.
Based on your feedback, the task sequence error dialog window now displays more information. It shows the name of the task sequence step that failed.
When you set the OSDDoNotLogCommand task sequence variable to true, now it also hides the command line from the Run Command Line step in the log file. It previously only masked the program name from the Install Package step in smsts.log.
When you enable a PXE responder on a distribution point without Windows Deployment Service, it can now be on the same server as the DHCP service. Add the following settings to support this configuration:
- Set the DWord value DoNotListenOnDhcpPort to
1in the following registry key:HKLM\Software\Microsoft\SMS\DP. - Set DHCP option 60 to
PXEClient. - Restart the SCCMPXE and DHCP services on the server.
- Set the DWord value DoNotListenOnDhcpPort to
For more information about installing or updating the technical preview branch, see Technical preview.
For more information about the different branches of Configuration Manager, see Which branch of Configuration Manager should I use?