This article lists and briefly describes key terms and concepts related to Azure Virtual Desktop Insights.
Alerts
Any active Azure Monitor alerts that you've configured on the subscription and classified as severity 0 will appear in the Overview page. To learn how to set up alerts, see Azure Monitor Log Alerts.
Available sessions
Available sessions shows the number of available sessions in the host pool. The service calculates this number by multiplying the number of virtual machines (VMs) by the maximum number of sessions allowed per virtual machine, then subtracting the total sessions.
Client operating system (OS)
The client operating system (OS) shows which version of the OS end-users accessing Azure Virtual Desktop resources are currently using. The client OS also shows which version of the web (HTML) client and the full Remote Desktop client the users have. For a full list of Windows OS versions, see Operating System Version.
Connection success
This item shows connection health. "Connection success" means that the connection could reach the host, as confirmed by the stack on that virtual machine. A failed connection means that the connection couldn't reach the host.
Daily active users (DAU)
The total number of users that have started a session in the last 24 hours.
Daily alerts
The total number of alerts triggered each day.
Daily connections and reconnections
The total number of connections and reconnections started or completed within the last 24 hours.
Daily connected hours
The total number of hours spent connected to a session across users in the last 24 hours.
Diagnostics and errors
When an error or alert appears in Azure Virtual Desktop Insights, it's categorized by three things:
Activity type: this category is how the error is categorized by Azure Virtual Desktop diagnostics. The categories are management activities, feeds, connections, host registrations, errors, and checkpoints. Learn more about these categories at Use Log Analytics for the diagnostics feature.
Kind: this category shows the error's location.
Errors marked as "service" or "ServiceError = TRUE" happened in the Azure Virtual Desktop service.
Errors marked as "deployment" or tagged "ServiceError = FALSE" happened outside of the Azure Virtual Desktop service.
Source: this category gives a more specific description of where the error happened.
Diagnostics: the service role responsible for monitoring and reporting service activity to let users observe and diagnose deployment issues.
RDBroker: the service role responsible for orchestrating deployment activities, maintaining the state of objects, validating authentication, and more.
RDGateway: the service role responsible for handling network connectivity between end-users and virtual machines.
RDStack: a software component that's installed on your VMs to allow them to communicate with the Azure Virtual Desktop service.
Client: software running on the end-user machine that provides the interface to the Azure Virtual Desktop service. It displays the list of published resources and hosts the Remote Desktop connection once you've made a selection.
Some metrics in Azure Virtual Desktop Insights list the gateway region a user connects through. The gateway region is represented by a three or four-letter code that corresponds to the Azure region where the gateway is located. The following table lists the gateway region codes and their corresponding Azure regions:
Gateway region code
Azure region
AUC
Australia Central
AUC2
Australia Central 2
AUE
Australia East
AUSE
Australia Southeast
BRS
Brazil South
CAC
Canada Central
CAE
Canada East
CHNO
Switzerland North
CIN
Central India
CUS
Central US
EAS
East Asia
EEU
East Europe
EUS
East US
EUS2
East US 2
FRAS
France South
FRC
France Central
GEC
Germany Central
GEN
Germany North
GENE
Germany Northeast
GWC
Germany West Central
JPE
Japan East
JPW
Japan West
KRC
Korea Central
KRS
Korea South
KRS2
Korea South 2
NCUS
North Central US
NEU
North Europe
NOE
Norway East
NOW
Norway West
SAN
South Africa North
SAW
South Africa West
SCUS
South Central US
SEA2
Southeast Asia 2
SEAS
Southeast Asia
SIN
South India
SWW
Switzerland West
UAEC
UAE Central
UAEN
UAE North
UKN
UK North
UKS
UK South
UKS2
UK South 2
UKW
UK West
WCUS
West Central US
WEU
West Europe
WIN
West India
WUS
West US
Input delay
"Input delay" in Azure Virtual Desktop Insights means the input delay per process performance counter for each session. In the host performance page at aka.ms/azmonwvdi, this performance counter is configured to send a report to the service once every 30 seconds. These 30-second intervals are called "samples," and the report the worst case in that window. The median and p95 values reflect the median and 95th percentile across all samples.
Under Input delay by host, you can select a session host row to filter all other visuals in the page to that host. You can also select a process name to filter the median input delay over time chart.
The total number of users that have started a session in the last 28 days. If you store data for 30 days or less, you may see lower-than-expected MAU and Connection values during periods where you have fewer than 28 days of data available.
Performance counters
Performance counters show the performance of hardware components, operating systems, and applications.
The following table lists the recommended performance counters and time intervals that Azure Monitor uses for Azure Virtual Desktop:
Performance counter name
Time interval
Logical Disk(C:)\Avg. Disk Queue Length
30 seconds
Logical Disk(C:)\Avg. Disk sec/Transfer
60 seconds
Logical Disk(C:)\Current Disk Queue Length
30 seconds
Memory(*)\Available Mbytes
30 seconds
Memory(*)\Page Faults/sec
30 seconds
Memory(*)\Pages/sec
30 seconds
Memory(*)\% Committed Bytes in Use
30 seconds
PhysicalDisk(*)\Avg. Disk Queue Length
30 seconds
PhysicalDisk(*)\Avg. Disk sec/Read
30 seconds
PhysicalDisk(*)\Avg. Disk sec/Transfer
30 seconds
PhysicalDisk(*)\Avg. Disk sec/Write
30 seconds
Processor Information(_Total)\% Processor Time
30 seconds
Terminal Services(*)\Active Sessions
60 seconds
Terminal Services(*)\Inactive Sessions
60 seconds
Terminal Services(*)\Total Sessions
60 seconds
*User Input Delay per Process(*)\Max Input Delay
30 seconds
*User Input Delay per Session(*)\Max Input Delay
30 seconds
RemoteFX Network(*)\Current TCP RTT
30 seconds
RemoteFX Network(*)\Current UDP Bandwidth
30 seconds
Potential connectivity issues
Potential connectivity issues shows the hosts, users, published resources, and clients with a high connection failure rate. Once you choose a "report by" filter, you can evaluate the issue's severity by checking the values in these columns:
Attempts (number of connection attempts)
Resources (number of published apps or desktops)
Hosts (number of VMs)
Clients
For example, if you select the By user filter, you can check to see each user's connection attempts in the Attempts column.
If you notice that a connection issue spans multiple hosts, users, resources, or clients, it's likely that the issue affects the whole system. If it doesn't, it's a smaller issue that lower priority.
You can also select entries to view additional information. You can view which hosts, resources, and client versions were involved with the issue. The display will also show any errors reported during the connection attempts.
Round-trip time (RTT)
Round-trip time (RTT) is an estimate of the connection's round-trip time between the end-user’s location and the session host's Azure region. To see which locations have the best latency, look up your desired location in Azure network round-trip latency statistics.
Session history
The Sessions item shows the status of all sessions, connected and disconnected. Idle sessions only shows the disconnected sessions.
Severity 0 alerts
The most urgent items that you need to take care of right away. If you don't address these issues, they could cause your Azure Virtual Desktop deployment to stop working.
Time to connect
Time to connect is the time between when a user opens a resource to start their session and when their desktop has loaded and is ready to use. For example, for a RemoteApp, this is the time it takes to launch the application.
Time to connect has two stages:
Connection, which is how long it takes for the Azure service to route the user to a session host.
"Logon," which is how long it takes for the service to perform tasks related to signing in the user and establishing the session on the session host.
When monitoring time to connect, keep in mind the following things:
Time to connect is measured with the following checkpoints from Azure Virtual Desktop service diagnostics data. The checkpoints Insights uses to determine when the connection is established are different for a desktop versus a RemoteApp scenario.
Ends: WVDCheckpoints Name = ShellReady (desktops); Name = RdpShellAppExecuted (RemoteApp. For timing, consider the first app launch only)
For example, Insights measures the time for a desktop experience to launch based on how long it takes to launch Windows Explorer. Insights also measures the time for a RemoteApp to launch based on the time taken to launch the first instance of the shell app for a connection.
Note
If a user launches more than one RemoteApp, sometimes the shell app can execute multiple times during a single connection. For an accurate measurement of time to connect, you should only use the first execution checkpoint for each connection.
Establishing new sessions usually takes longer than reestablishing connections to existing sessions due to differences in the "logon" process for new and established connections.
The time it takes for the user to provide credentials is subtracted from their time to connect to account for situations where a user either takes a while to enter credentials or use alternative authentication methods to sign in.
When troubleshooting a high time to connect, Azure Monitor will break down total connection time data into four components to help you identify how to reduce sign-in time.
Note
The components in this section only show the primary connection stages. These components can run in parallel, which means they won't add up to equal the total time to connect. The total time to connect is a measurement that Azure Monitor determines in a separate process.
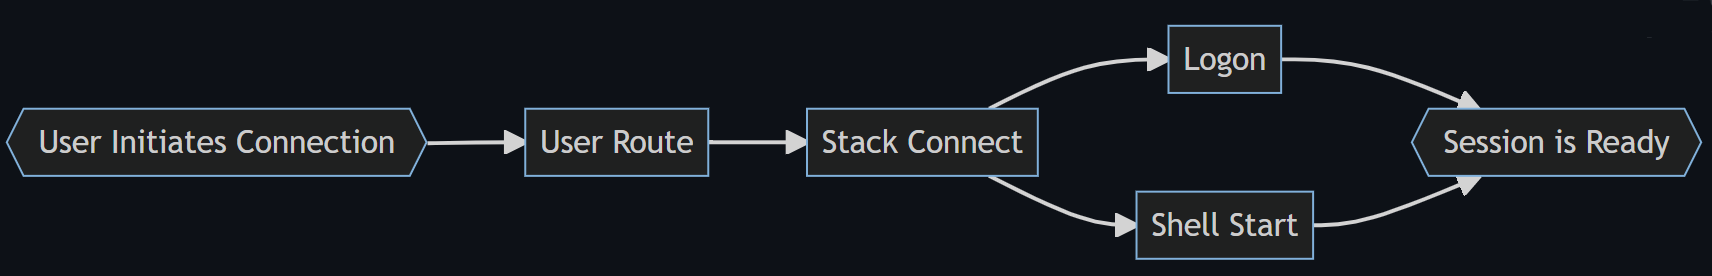
The following flowchart shows the four stages of the sign-in process:
The flowchart shows the following four components:
User route: the time it takes from when the user selects the Azure Virtual Desktop icon to launch a session to when the service identifies a host to connect to. High network load, high service load, or unique network traffic routing can lead to high routing times. To troubleshoot user route issues, look at your network paths.
Stack connected: the time it takes from when the service resolves a target session host for the user to when the service establishes a connection between the session host and the user’s remote client. Like user routing, the network load, server load, or unique network traffic routing can affect connection time. For this component, you'll also need to pay attention to your network routing. To reduce connection time, make sure you've appropriately configured all proxy configurations on both the client and session hosts, and that routing to the service is optimal.
Logon: the time it takes between when a connection to a host is established to when the shell starts to load. Logon time includes several processes that can contribute to high connection times. You can view data for the "logon" stage in Insights to see if there are unexpected peaks in average times.
The "logon" process is divided into four stages:
Profiles: the time it takes to load a user’s profile for new sessions. How long loading takes depends on user profile size or the user profile solutions you're using (such as User Experience Virtualization). If you're using a solution that depends on network-stored profiles, excess latency can also lead to longer profile loading times.
Group Policy Objects (GPOs): the time it takes to apply group policies to new sessions. A spike in this area of the data is a sign that you have too many group policies, the policies take too long to apply, or the session host is experiencing resource issues. One thing you can do to optimize processing times is make sure the domain controller is close to session hosts as possible.
Shell Start: the time it takes to launch the shell (usually explorer.exe).
FSLogix (Frxsvc): the time it takes to launch FSLogix in new sessions. A long launch time may indicate issues with the shares used to host the FSLogix user profiles. To troubleshoot these issues, make sure the shares are collocated with the session hosts and appropriately scaled for the average number of users signing in to the hosts. Another area you should look at is profile size. Large profile sizes can slow down launch times.
Shell start to shell ready: the time from when the shell starts to load to when it's fully loaded and ready for use. Delays in this phase can be caused by session host overload (high CPU, memory, or disk activity) or configuration issues.
User report
The user report page lets you view a specific user’s connection history and diagnostic information. Each user report shows usage patterns, user feedback, and any errors users have encountered during their sessions. Most smaller issues can be resolved with user feedback. If you need to dig deeper, you can also filter information about a specific connection ID or period of time.
Users per core
This is the number of users in each virtual machine core. Tracking the
maximum number of users per core over time can help you identify whether the
environment consistently runs at a high, low, or fluctuating number of users per
core. Knowing how many users are active will help you efficiently resource and scale the environment.
Windows Event Logs
Windows Event Logs are data sources collected by either the Azure Monitor Agent or the Log Analytics agent on Windows virtual machines. You can collect events from standard logs like System and Application as well as custom logs created by applications you need to monitor.
The following table lists the required Windows Event Logs for Azure Virtual Desktop Insights: