The success of your cloud solution depends on its reliability. Reliability can be broadly defined as the probability that the system functions as expected, under the specified environmental conditions, within a specified time. Site reliability engineering (SRE) is a set of principles and practices for creating scalable and highly reliable software systems. Increasingly, SRE is used during the design of digital services to ensure greater reliability.
For more information on SRE strategies, see AZ-400: Develop a Site Reliability Engineering (SRE) strategy.
The concepts in this article apply to:
- API-based cloud services.
- Public-facing web applications.
- IoT-based or event-based workloads.
Download a PowerPoint file of this architecture.
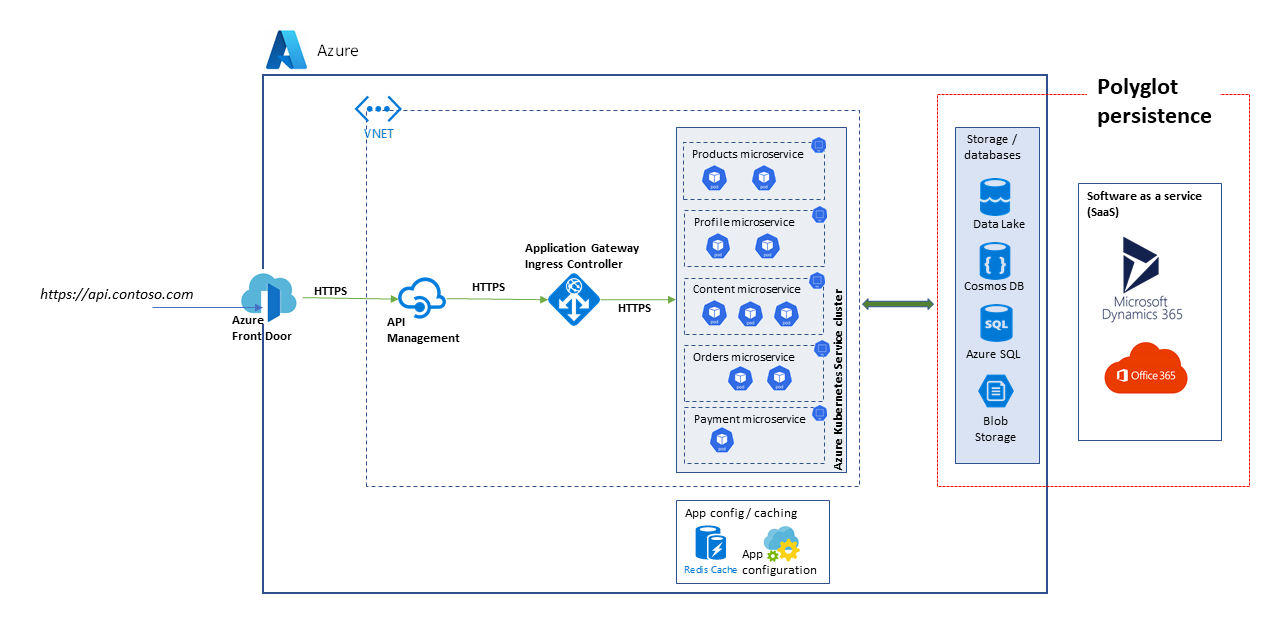
The architecture that's considered here is that of a scalable API platform. The solution comprises multiple microservices that use a variety of databases and storage services, including software as a service (SaaS) solutions such as Dynamics 365 and Microsoft 365.
This article considers a solution that handles high-level marketplace and e-Commerce use cases to demonstrates the blocks shown in the diagram. The use cases are:
- Product browsing.
- Registration and login.
- Viewing of content such as news articles.
- Order and subscription management.
Client applications such as web apps, mobile apps, and even service applications consume the API platform services through a unified access path, https://api.contoso.com.
- Azure Front Door provides a secured, unified point of entry for all requests to the solution. For more information, see Routing architecture overview.
- Azure API Management provides a governance layer on top of all published APIs. You can use Azure API Management policies to apply additional capabilities on the API layer, such as access restrictions, caching, and data transformation. API Management supports autoscaling in Standard and Premium tiers.
- Azure Kubernetes Service (AKS) is the Azure implementation of open-source Kubernetes clusters. As a hosted Kubernetes service, Azure handles critical tasks like health monitoring and maintenance. Since Kubernetes masters are managed by Azure, you only manage and maintain the agent nodes. In this architecture, all microservices are deployed in AKS.
- Azure Application Gateway is an application delivery controller service. It operates at layer 7, the application layer, and has various load-balancing capabilities. The Application Gateway Ingress Controller (AGIC) is a Kubernetes application that makes it possible for Azure Kubernetes Service (AKS) customers to use the Azure native Application Gateway L7 load-balancer to expose cloud software to the Internet. Autoscaling and zone redundancy are supported in the v2 SKU.
- Azure Storage, Azure Data Lake Storage, Azure Cosmos DB and Azure SQL can store both structured and non-structured content. Azure Cosmos DB containers and databases can be created with autoscale throughput.
- Microsoft Dynamics 365 is a software as a service (SaaS) offering from Microsoft which provides several business applications for Customer Service, Sales, Marketing, and finance. In this architecture, Dynamics 365 is primarily used for managing product catalogs and for Customer Service management. Scale units provide resiliency to Dynamics 365 applications.
- Microsoft 365 (formerly Office 365) is used as an enterprise content management system that's built on Microsoft 365 SharePoint in Microsoft 365. It's used to create, manage, and publish content such as media assets and documents.
Because this solution uses a highly scalable microservices-based architecture, consider these alternatives for the compute plane:
- Azure Functions for serverless API services
- Azure Spring Apps for Java-based microservices
The degree of reliability that's required for a solution depends on the business context. A retail outlet store that's open for 14 hours, and that has system usage peaking within that span, has different requirements than an online business that accepts orders at all hours. SRE practices can be tailored to achieve the appropriate level of reliability.
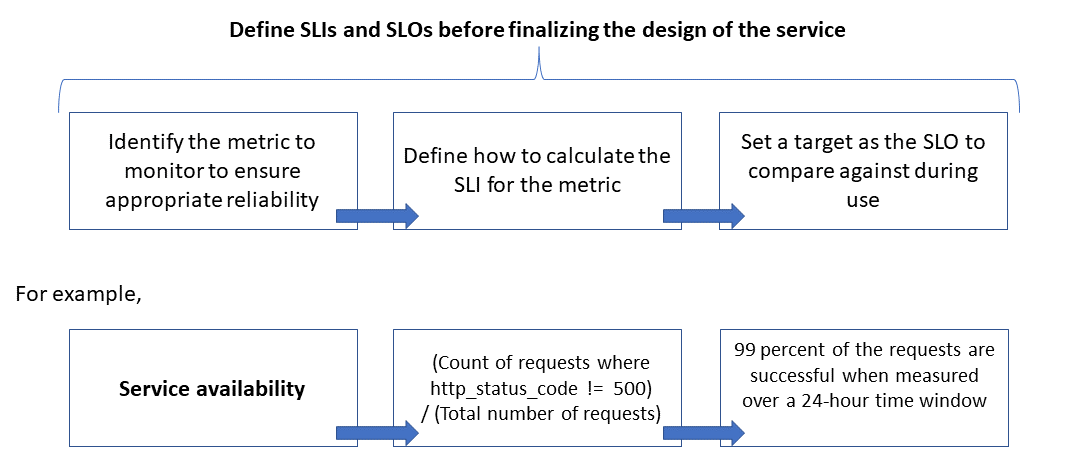
Reliability is defined and measured using service level objectives (service-level objectives (SLOs)) that define the target level of reliability for a service. Achieving the target level assures that consumers are satisfied. The SLO goals can evolve or change depending on the demands of the business. However, the service owners should constantly measure reliability against the SLOs to detect issues and take corrective actions. SLOs are usually defined as a percentage achievement over a period.
Another important term to note is service level indicator (service-level indicator (SLI)), which is the metric that's used to calculate the SLO. SLIs are based on insights that are derived from data that's captured as the customer consumes the service. SLIs are always measured from a customer's point of view.
SLOs and SLIs always go hand in hand, and are usually defined in an iterative manner. SLOs are driven by key business objectives, whereas SLIs are driven by what's possible to be measured while implementing the service.
The relationship between the monitored metric, the SLI, and the SLO is depicted below:

This is explained in more detail in Define SLI metrics to calculate SLOs.
For a software system, performance generally refers to the overall responsiveness of a system when executing an action within a specified time, while scalability is the ability of the system to handle increased user loads without hurting performance.
A system is regarded as scalable if the underlying resources are made available dynamically to support an increase in load. Cloud applications must be designed for scale, and the traffic volume is difficult to predict at times. Seasonal spikes can increase the scale requirements, especially when a service handles requests for multiple tenants.
It's a good practice to design applications so that the cloud resources scale up and down automatically as needed to meet the load. Basically, the system should adapt to the workload increase by provisioning or allocating resources in an incremental manner to meet the demand. Scalability pertains not only to compute instances, but also to other elements such as data storage and messaging infrastructure.
This article shows how you can ensure appropriate reliability for a cloud application by conducting scale and performance modeling of the workload scenarios, and using the results to define the monitors, the SLIs, and the SLOs.
Refer to the Reliability and Performance Efficiency pillars of Azure Well Architected Framework for guidance on building scalable and reliable applications.
This article explores how to apply scalability and performance modeling techniques to fine-tune the solution architecture and design. These techniques identify changes to the transaction flows for optimal user experience. Base your technical decisions on non-functional requirements of the solution. The process is:
- Identify the scalability requirements.
- Model the expected load.
- Define the SLIs and SLOs for the user scenarios.
Note
Azure Application Insights, part of Azure Monitor, is a powerful application performance management (APM) tool that you can easily integrate with your applications to send telemetry and analyze application-specific metrics. It also provides ready-to-use dashboards and a metrics explorer that you can use to analyze the data to explore business needs.
Assume these peak load metrics:
- Number of consumers who use the API Platform: 1.5 million
- Hourly active consumers (30 percent of 1.5 million): 450,000
- Percentage of load for each activity:
- Product browsing: 75 percent
- Registration including profile creation, and login: 10 percent
- Management of orders and subscriptions: 10 percent
- Content viewing: 5 percent
The load produces the following scale requirements, under normal peak load, for the APIs that are hosted by the platform:
- Product microservice: about 500 requests per second (RPS)
- Profile microservice: about 100 RPS
- Orders and payment microservice: about 100 RPS
- Content microservice: about 50 RPS
These scale requirements don't take into consideration seasonal and random peaks, and peaks during special events such as marketing promotions. During peaks, the scale requirement for some user activities is up to 10 times the normal peak load. Keep these constraints and expectations in mind when you make the design choices for the microservices.
SLI metrics indicate the degree to which a service provides a satisfactory experience, and can be expressed as the ratio of good events to total events.
For an API service, events refer to the application-specific metrics that are captured during execution as telemetry or processed data. This example has the following SLI metrics:
| Metric | Description |
|---|---|
| Availability | Whether the request was serviced by the API |
| Latency | Time for the API to process the request and return a reply |
| Throughput | Number of requests that the API handled |
| Success Rate | Number of requests that the API handled successfully |
| Error Rate | Number of errors for the requests that the API handled |
| Freshness | Number of times the user received the latest data for read operations on the API, despite the underlying data store being updated with a certain write latency |
Note
Be sure to identify any additional SLIs that are important for your solution.
Here are examples of SLIs:
- (Number of requests that are completed successfully in less than 1,000 ms) / (Number of requests)
- (Number of search results that return, within three seconds, any products that were published to the catalog) / (Number of searches)
After you define the SLIs, determine what events or telemetry to capture to measure them. For example, to measure availability, you capture events to indicate whether the API service successfully processed a request. For HTTP-based services, success or failure is indicated with HTTP status codes. The API design and implementation must provide the proper codes. In general, SLI metrics are an important input to the API implementation.
For cloud-based systems, you can obtain some of the metrics by using the diagnostic and monitoring support that are available for the resources. Azure Monitor is a comprehensive solution for collecting, analyzing, and acting on telemetry from your cloud services. Depending on your SLI requirements, more monitoring data can be captured to calculate the metrics.
Some SLIs are calculated using a percentile distribution technique. This gives better results if there are outliers that can skew other techniques such as mean or median distributions.
For example, consider that the metric is latency of the API requests and three seconds is the threshold for optimal performance. The sorted response times for an hour of API requests show that few requests take longer than three seconds, and most receive responses within the threshold limit. This is expected behavior of the system.
The percentile distribution is meant to exclude outliers caused by intermittent issues. For example, if proper service responses are in the 90th or 95th percentile, the SLO is considered to be met.
The measurement period for defining an SLO is very important. It must capture activity, not idleness, for the results to be meaningful to the user experience. This window can be five minutes to 24 hours depending on how you want to monitor and calculate the SLI metric.
The performance of an API must be managed from its inception until it's deprecated or retired. A robust governance process must be in place to ensure that performance issues are detected and fixed early, before they cause a major outage that impacts the business.
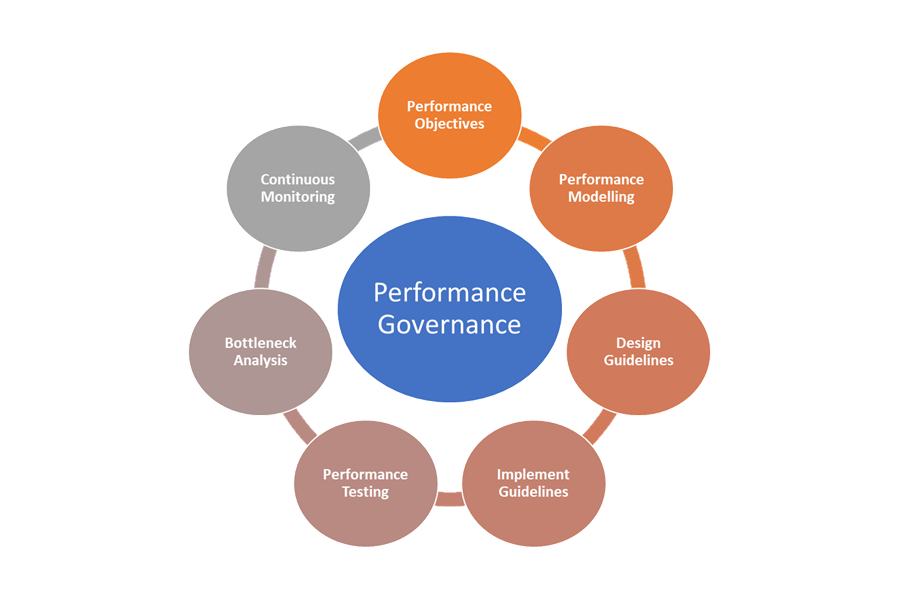
Here are the elements of performance governance:

- Performance Objectives: Define the aspirational performance SLOs for the business scenarios.
- Performance Modeling: Identify business-critical workflows and transactions, and conduct modeling to understand the performance-related implications. Capture this information at a granular level for more accurate predictions.
- Design Guidelines: Prepare performance design guidelines and recommend appropriate business workflow modifications. Ensure that teams understand these guidelines.
- Implement Guidelines: Implement performance design guidelines for the solution components, including instrumentation to capture metrics. Conduct performance design reviews. It's critical to track all these using architecture backlog items for the different teams.
- Performance Testing: Conduct load and stress testing in accordance with the load profile distribution to capture the metrics that are related to platform health. You can also conduct these tests for a limited load to benchmark the solution infrastructure requirements.
- Bottleneck Analysis: Use code inspection and code reviews to identify, analyze, and remove performance bottlenecks at various components. Identify horizontal or vertical scaling enhancements that are required to support the peak loads.
- Continuous Monitoring: Establish a continuous monitoring and alerting infrastructure as part of the DevOps processes. Ensure that the concerned teams are notified when response times degrade significantly compared to benchmarks.
- Performance Governance: Establish a performance governance consisting of well-defined processes and teams to sustain the performance SLOs. Track compliance after each release to avoid any degradation due to build upgrades. Periodically conduct reviews to assess for any increased load to identify solution upgrades.
Make sure to repeat the steps throughout the course of your solution development as part of the progressive elaboration process.
Track your performance objectives to help assure they're achieved. Capture granular and detailed user stories to track. This will help ensure that development teams make performance governance activities a high priority.
Here are sample aspirational SLOs for the API platform solution under consideration:
- Responds to 95 percent of all READ requests during a day within one second.
- Responds to 95 percent of all CREATE and UPDATE requests during a day within three seconds.
- Responds to 99 percent of all requests during a day within five seconds with no failures.
- Responds to 99.9 percent of all requests during a day successfully within five minutes.
- Less than one percent of requests during the peak one-hour window error out.
The SLOs can be tailored to suit specific application requirements. However, it's critical to be sufficiently granular to have the clarity to ensure reliability.
Monitoring logs are created automatically when the API service is in use. Assume that a week of data shows the following:
- Requests: 123,456
- Successful requests: 123,204
- 90th percentile latency: 497 ms
- 95th percentile latency: 870 ms
- 99th percentile latency: 1,024 ms
This data produces the following initial SLIs:
- Availability = (123,204 / 123,456) = 99.8 percent
- Latency = at least 90 percent of the requests were served within 500 ms
- Latency = about 98 percent of the requests were served within 1000 ms
Assume that, during planning, the aspirational latency SLO target is that 90 percent of the requests are processed within 500 ms with a success rate of 99 percent over a period of one week. With the log data, you can easily identify whether the SLO target was met. If you do this type of analysis for a few weeks, you can start seeing the trends around SLO compliance.
Use the following checklist of recommended practices to mitigate scalability and performance risks:
- Design for scale and performance.
- Ensure that you capture scale requirements for every user scenario and workload, including seasonality and peaks.
- Conduct performance modeling to identify system constraints and bottlenecks
- Manage technical debt.
- Do extensive tracing of performance metrics.
- Consider using scripts to run tools such as K6.io, Karate, and JMeter on your development staging environment with a range of user loads—50 to 100 RPS, for example. This will provide information in the logs for detecting design and implementation issues.
- Integrate the automated test scripts as part of your continuous deployment (CD) processes to detect build breaks.
- Have a production mindset.
- Adjust autoscaling thresholds as indicated by the health statistics.
- Prefer horizontal scaling techniques over vertical.
- Be proactive with scaling to handle seasonality.
- Prefer ring-based deployment.
- Use error budgets to experiment.
Reliability, performance efficiency, and cost optimization go hand in hand. The Azure services that are used in the architecture help reduce costs, because they autoscale to accommodate changing user loads.
For AKS, you can initially start with standard-sized VMs for the node pool. You can then monitor resource requirements during development or production use, and adjust accordingly.
Cost optimization is a pillar of the Microsoft Azure Well-Architected Framework. For more information, see Overview of the cost optimization pillar. To estimate the cost of Azure products and configurations, use the Pricing calculator.
This article is maintained by Microsoft. It was originally written by the following contributors.
Principal author:
- Subhajit Chatterjee | Principal Software Engineer
- Azure documentation
- Microsoft Azure Well-Architected Framework
- Microservices architecture style
- Design to scale out
- Choose an Azure compute service for your application
- Microservices architecture on Azure Kubernetes Service
- What is Azure Front Door?
- About API Management
- What is Application Gateway Ingress Controller?
- Azure Kubernetes Service
- Autoscaling and Zone-redundant Application Gateway v2
- Automatically scale a cluster to meet application demands on Azure Kubernetes Service (AKS)
- Create Azure Cosmos DB containers and databases with autoscale throughput
- Microsoft Dynamics 365 documentation
- Microsoft 365 documentation
- Site reliability engineering documentation
- AZ-400: Develop a Site Reliability Engineering (SRE) strategy
- Baseline web application with zone redundancy
